Datadog Integration on Hasura Cloud
Introduction
You can export metrics, operation logs and traces of your Hasura Cloud project to your organization's Datadog dashboard. This can be configured on the integrations tab on the project's setting page.
For Hasura Cloud projects, the Datadog Integration is only available on the Standard (pay-as-you-go) tier and above.
Try the new OpenTelemetry exporter to get advanced metrics and traces to connect with Datadog. This integration will export the metrics as detailed here.
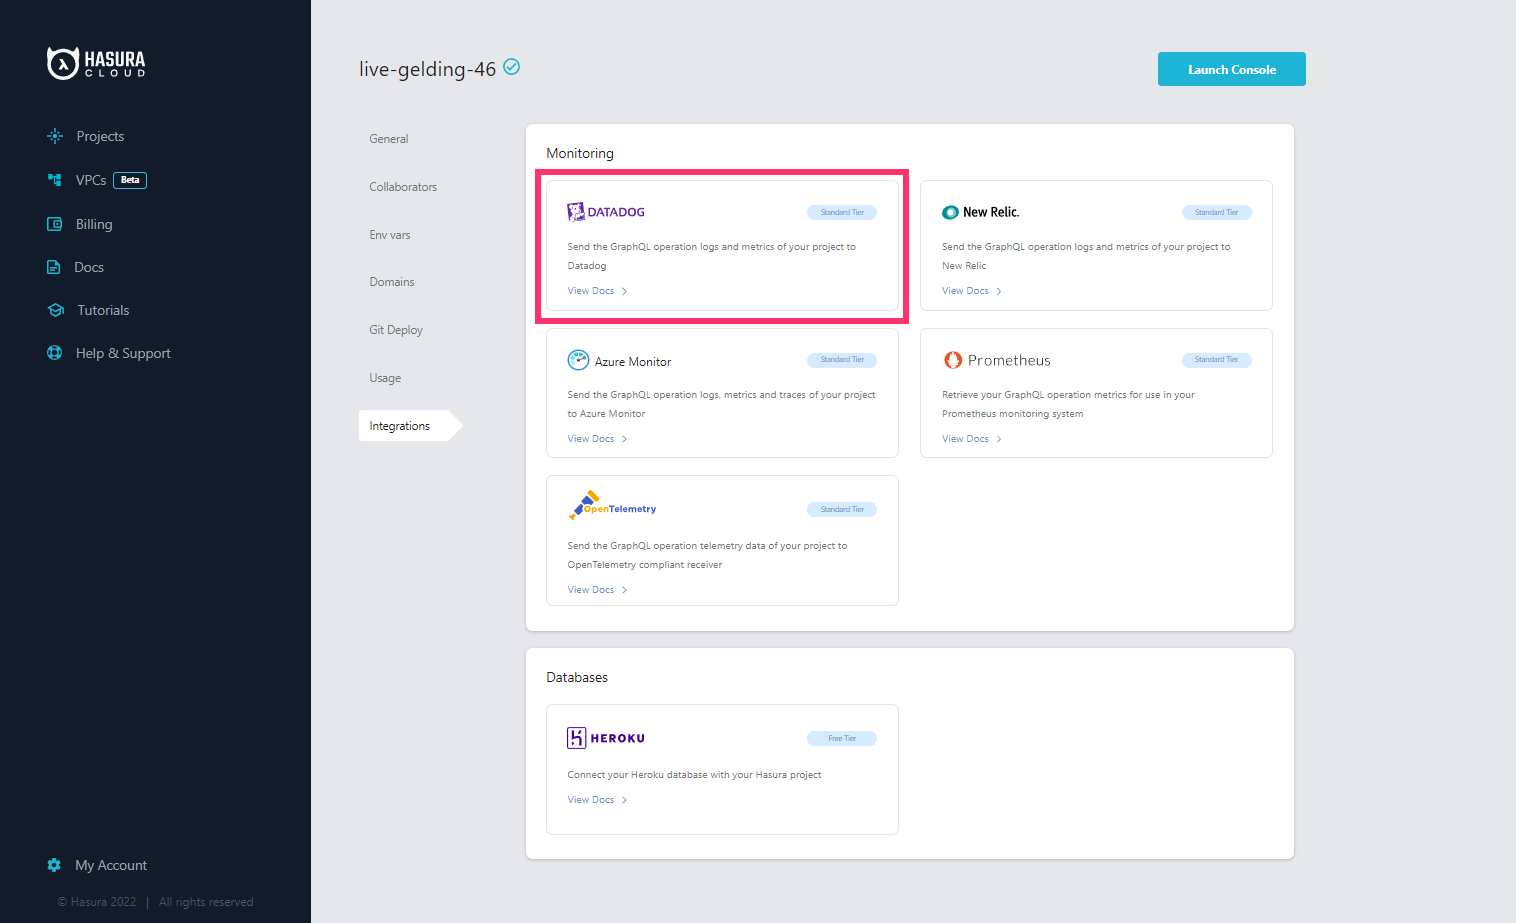
Configure Datadog integration
Navigate to the integrations tab on project settings page to find Datadog integration.
Select the Datadog API region and enter the Datadog API key (can be retrieved by navigating to Datadog's settings page
by clicking the Get API Key link), host, service name and tags to associate with exported logs, metrics and traces.
| Field | Description |
|---|---|
| Region | Hasura supports all available Datadog regions, namely US1, US3, US5, EU, US1FED. |
| API Key | API keys are unique to your organization. An API key is required by the Datadog agent to submit metrics and events to Datadog. Click on Read more above the API Key field in the Datadog integration form to get the API key. |
| Host | The name of the originating host of the log and metrics. |
| Tags | Tags associated with your logs and metrics. Default tags project_id and project_name are exported with all logs and metrics. A source tag hasura-cloud-metrics is added to all exported logs. |
| Service Name | The name of the application or service generating the log events. |
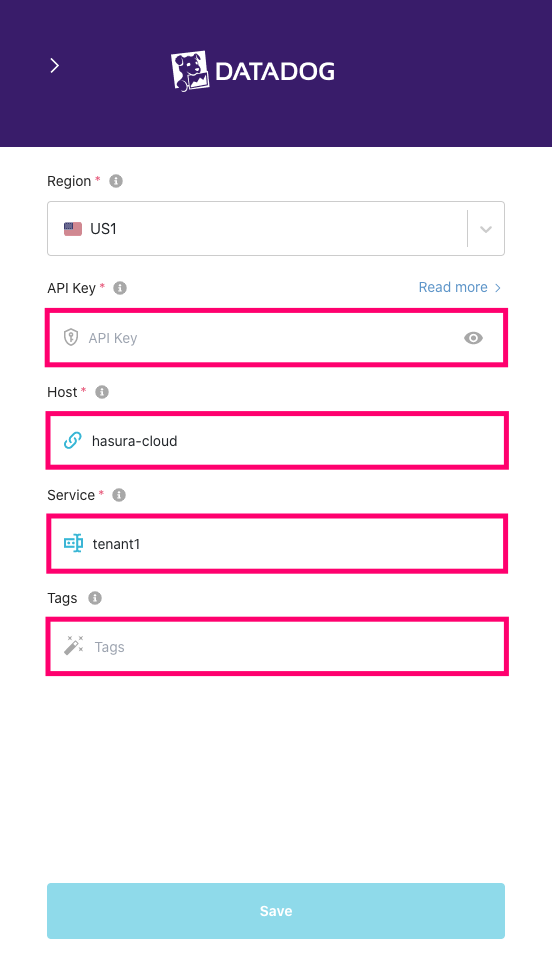
After adding appropriate values, click Save.
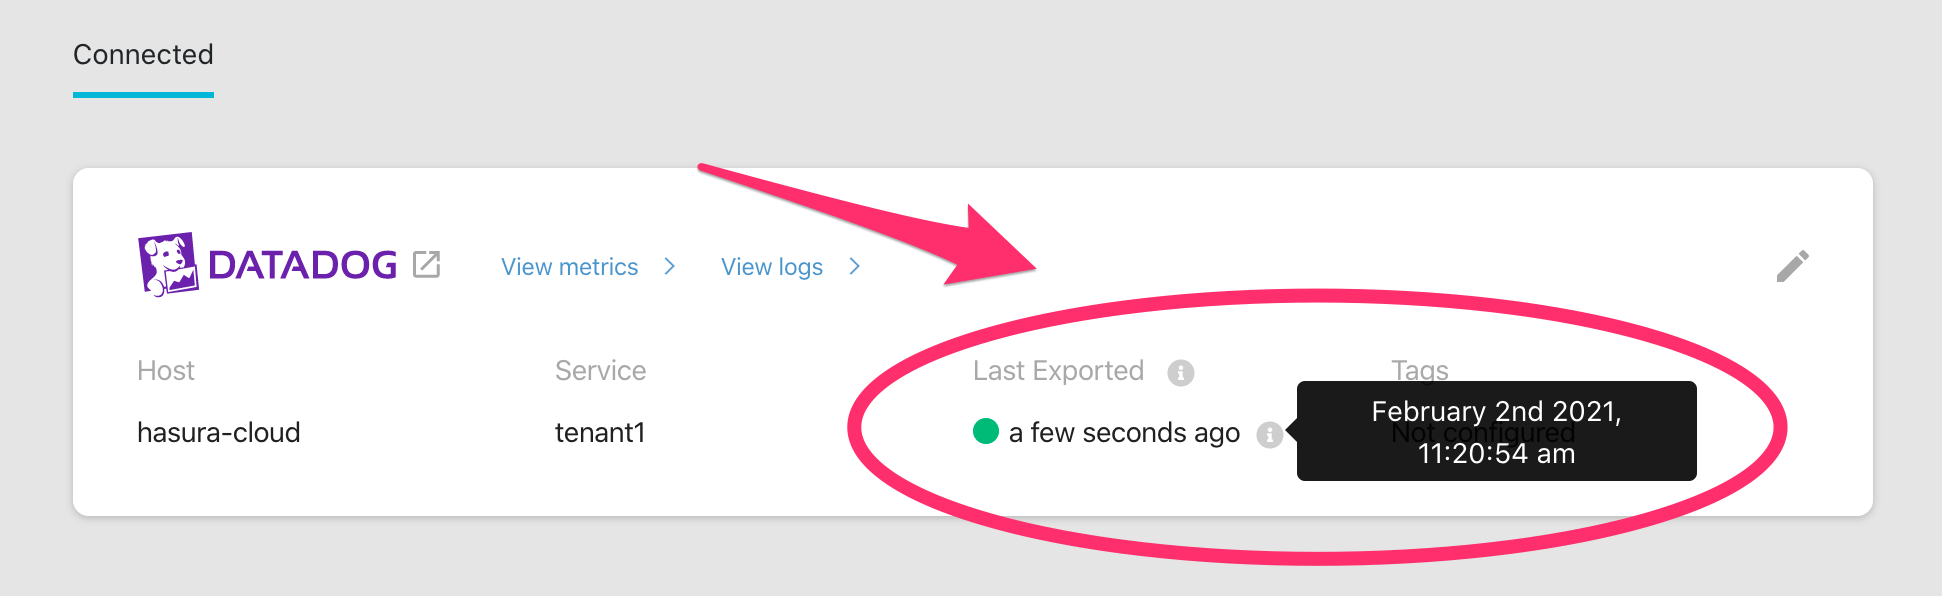
Checking the status of the integration
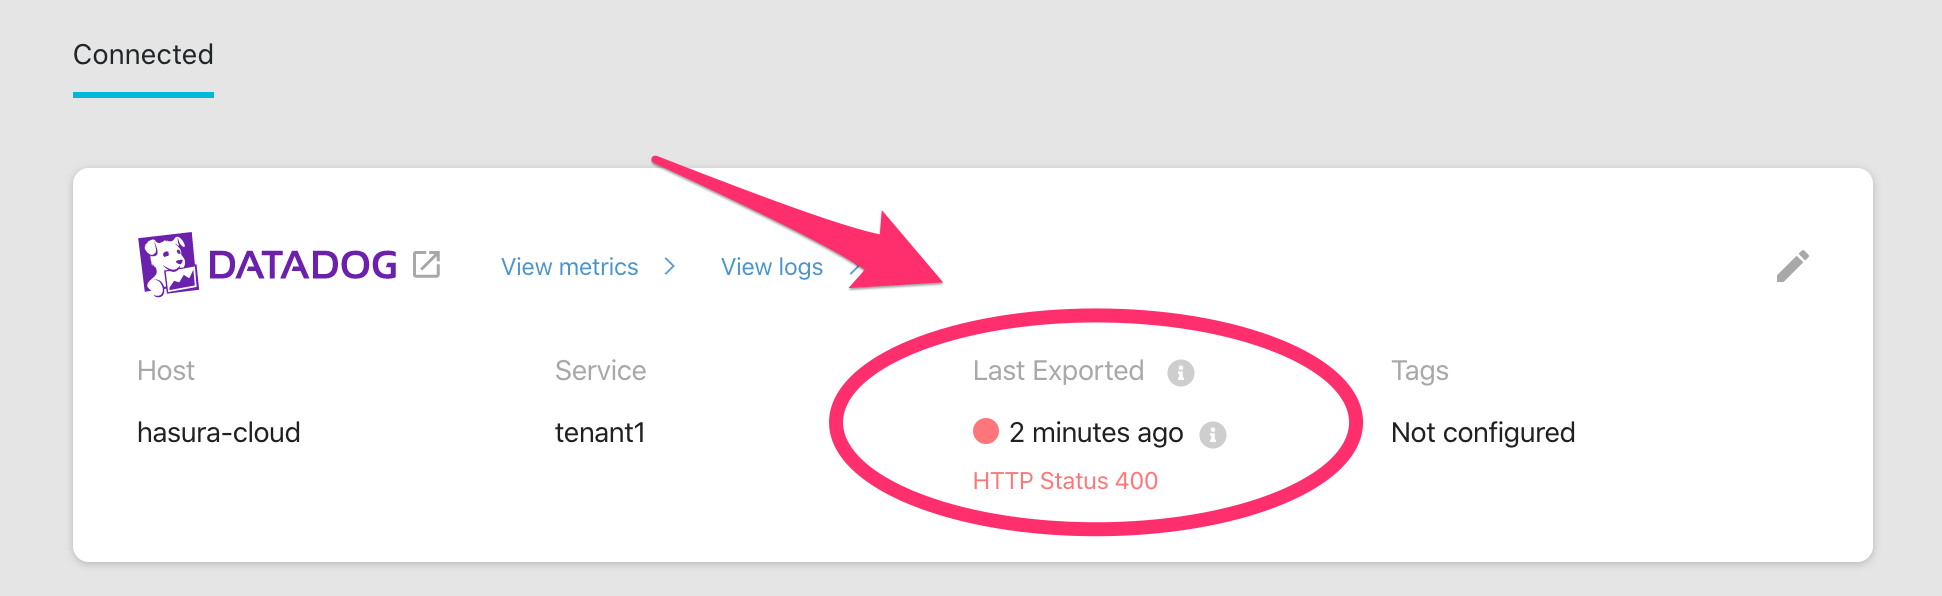
The green/red dot signifies the status of the integration. Green signifies successful exporting of logs to datadog. When
logs are successfully exported, Last Exported is continuously updated, indicating the timestamp of the last log line
successfully exported to your Datadog dashboard.
In case there is an error while exporting logs to datadog, the dot is red and the HTTP status code of the error is displayed right below it.
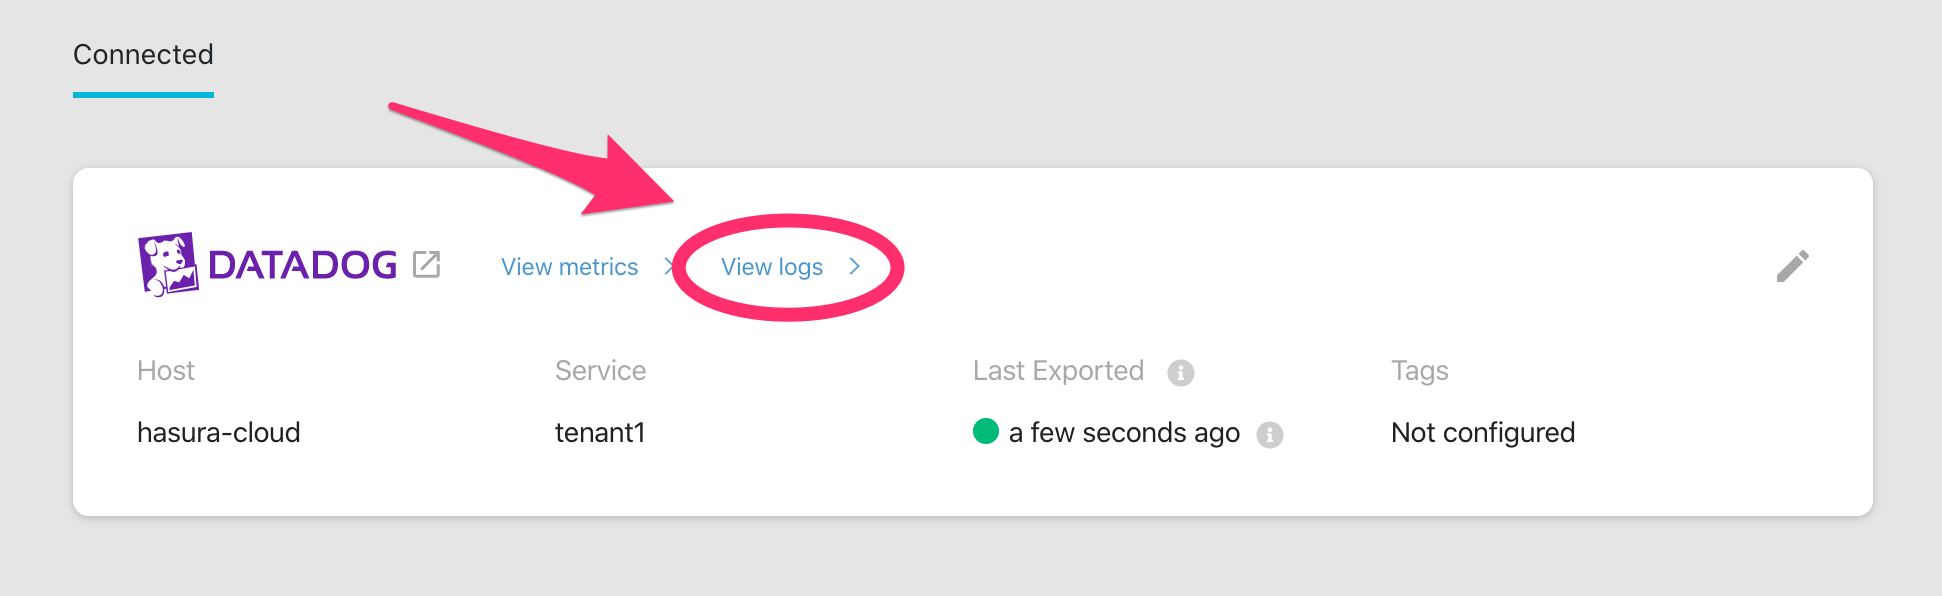
View logs
The logs can be viewed in your Datadog dashboard, under the Logs tab. To navigate to the same, click View Logs.
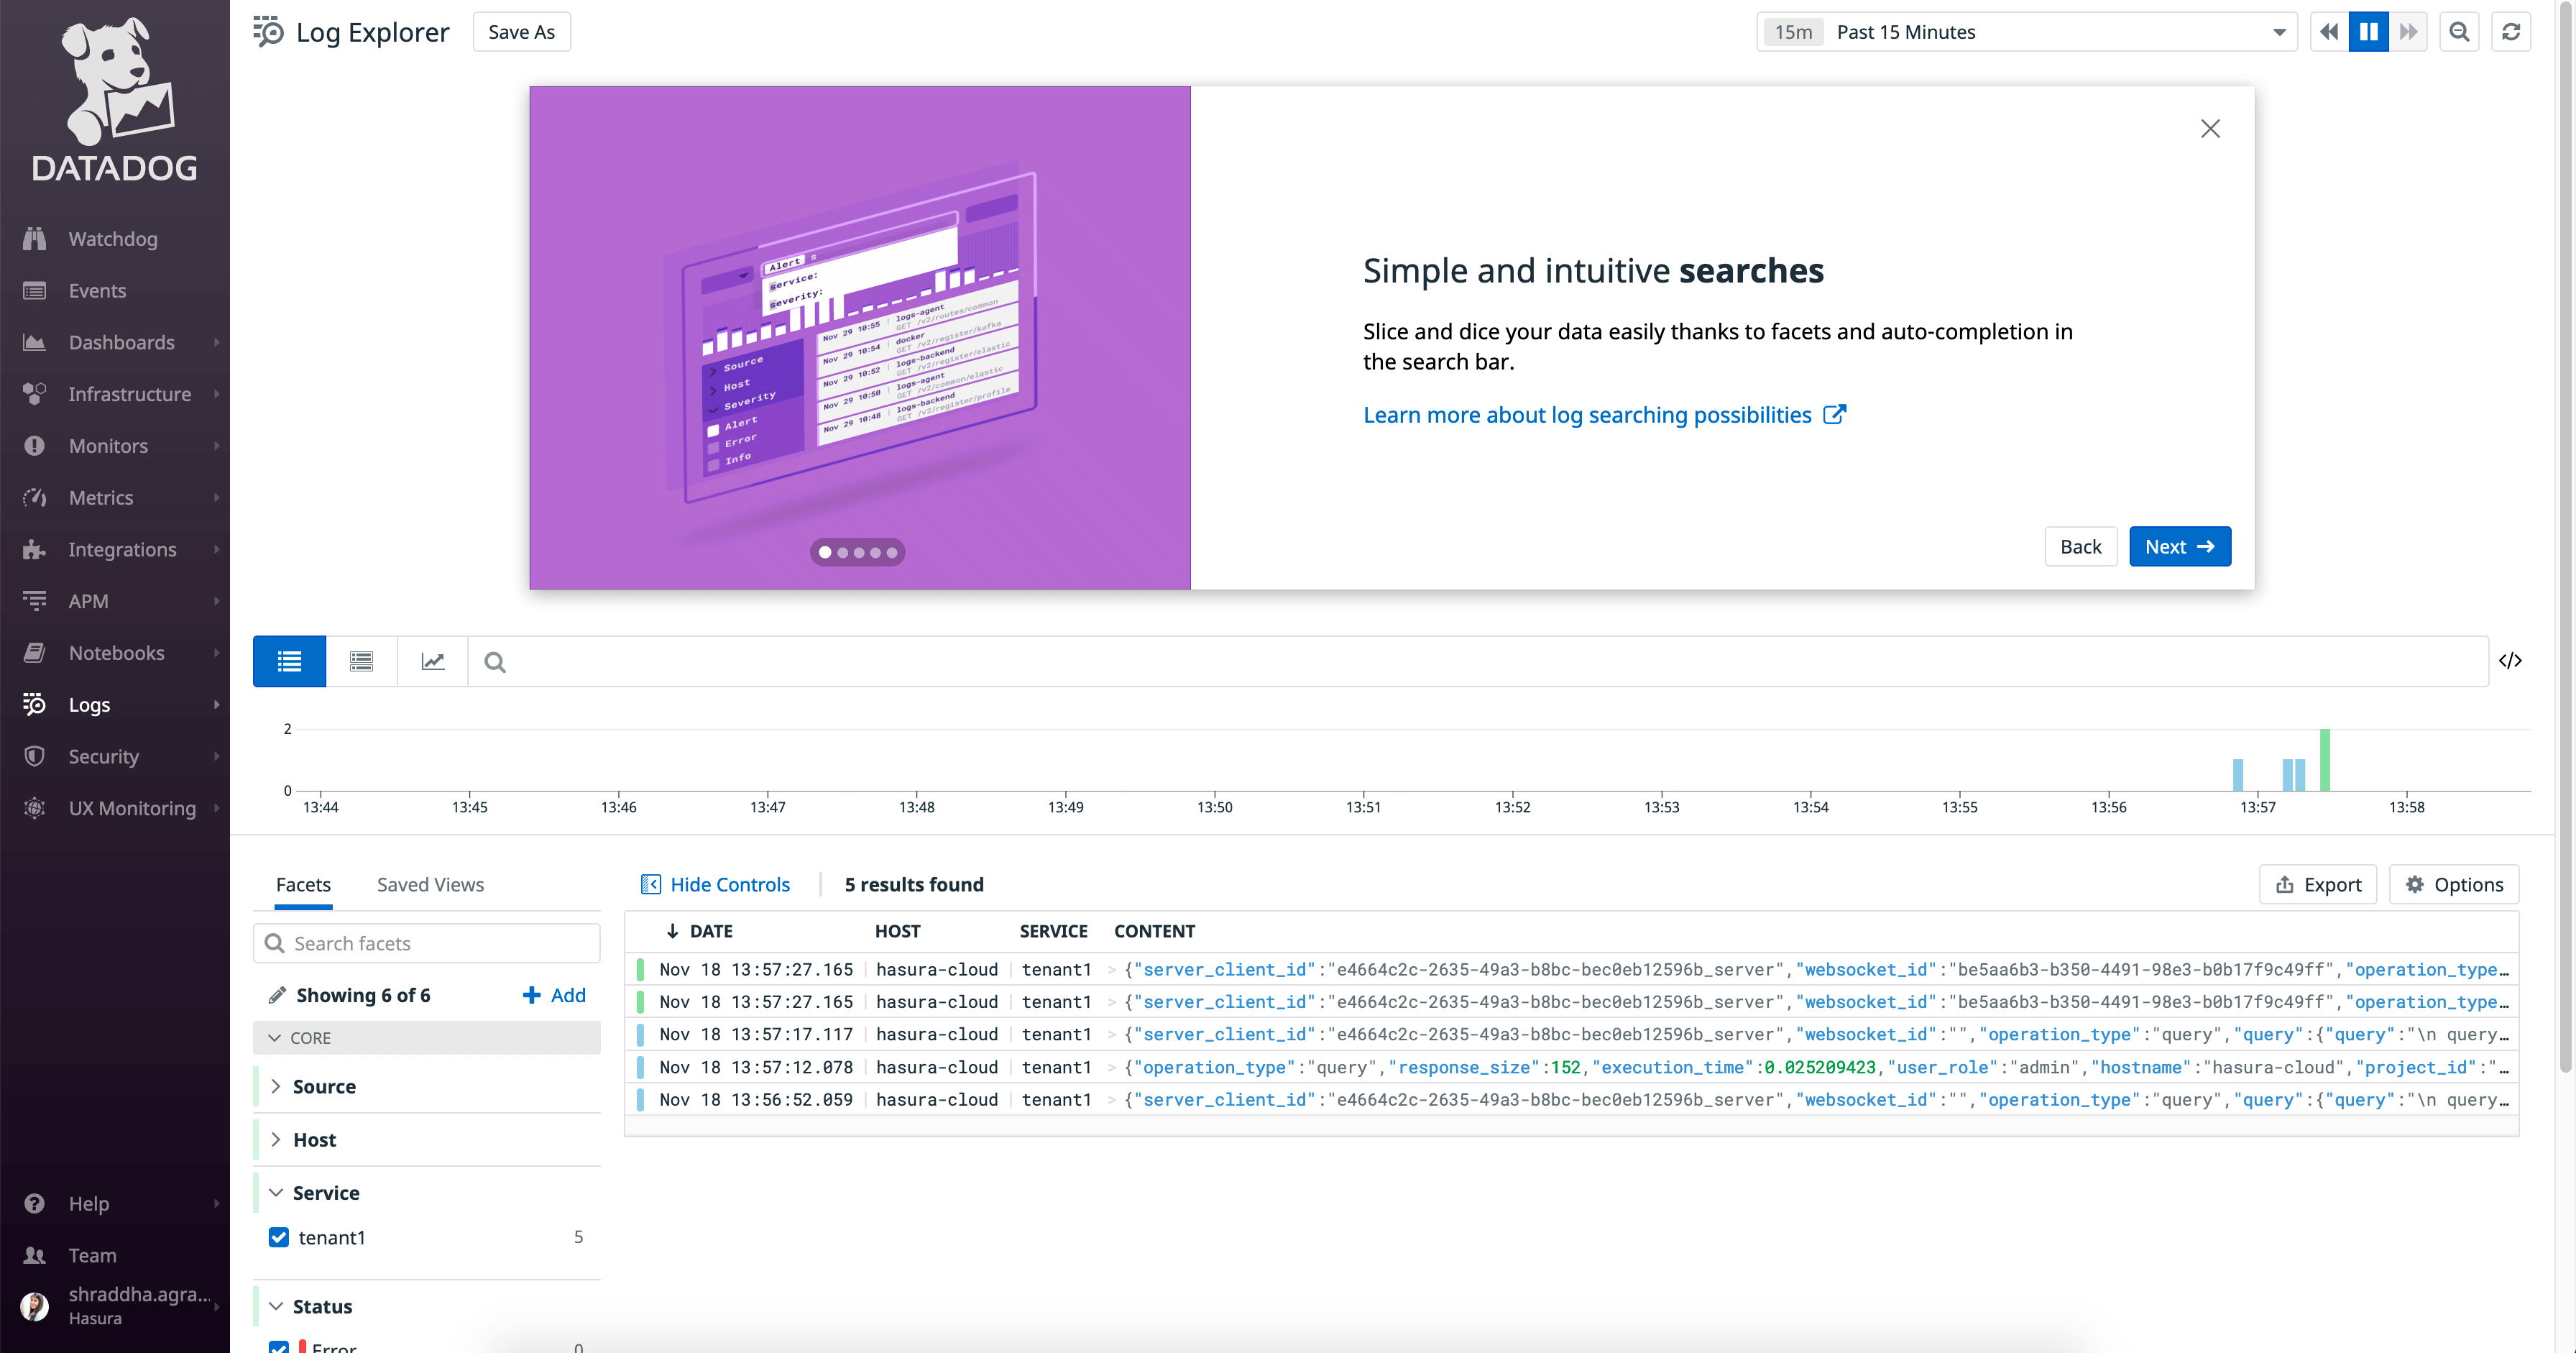
To view only logs exported by Hasura Cloud, filter your logs using host and/or tags you configured with this
integration.
Datadog allows ingestion of logs with maximum size 256kB for a single log. If a log exceeds this limit, Datadog will truncate the log at 256kB.
View metrics
The integration exports the following five metrics to your Datadog dashboard:
| Metric Exported | Metric Name in Datadog |
|---|---|
| Average number of requests | average_requests_per_minute |
| Average request execution time | average_execution_time |
| Success rate of requests | success_rate |
| Active subscriptions | active_subscriptions |
| Number of websockets open | websockets_open |
Non zero values of all the above metrics are exported over a one minute time interval. Each metric name is prefixed with
hasura_cloud.
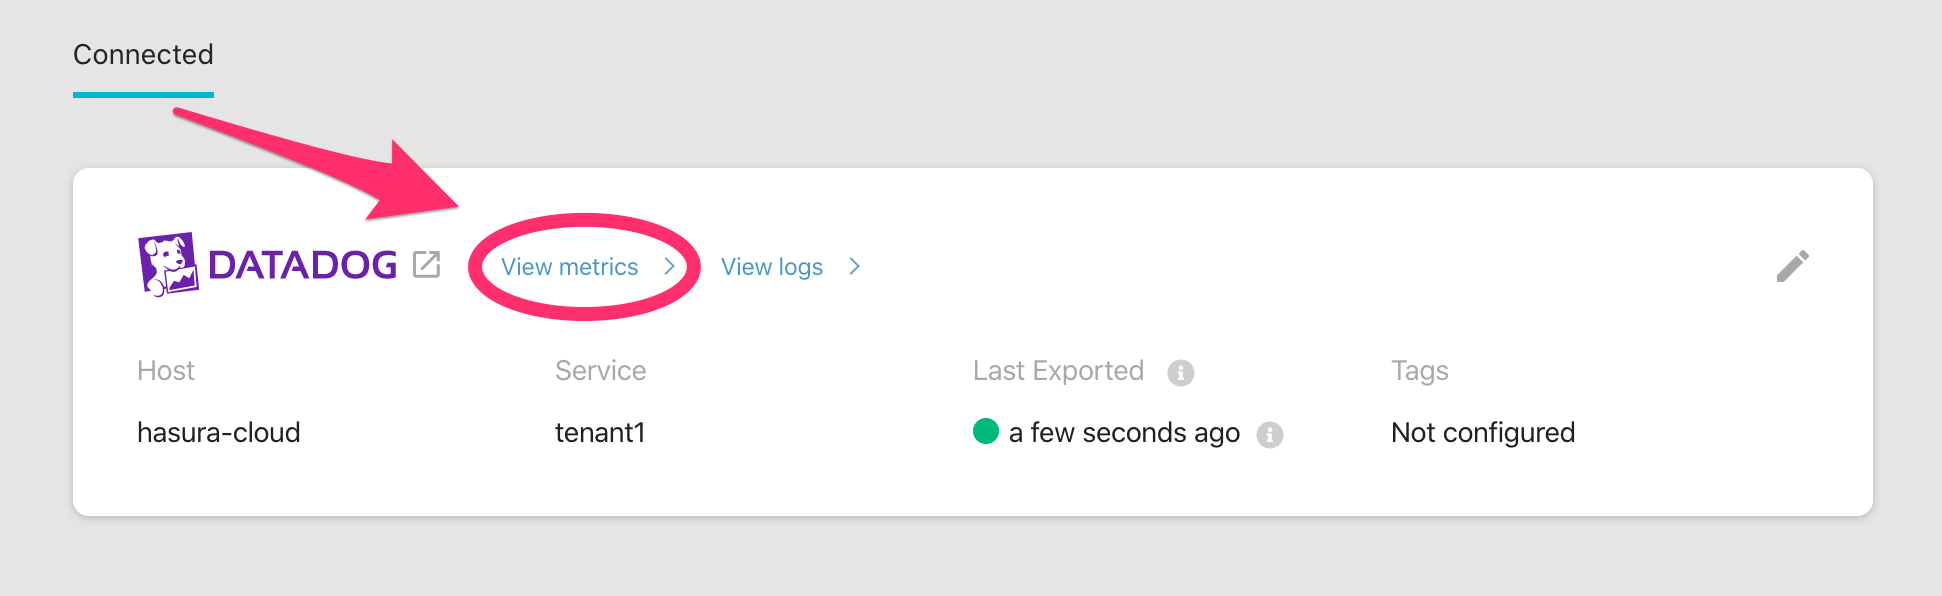
Graphs for all the above metrics can be viewed in your Datadog dashboard, under the Metrics tab. To navigate to the
same, click View Metrics.
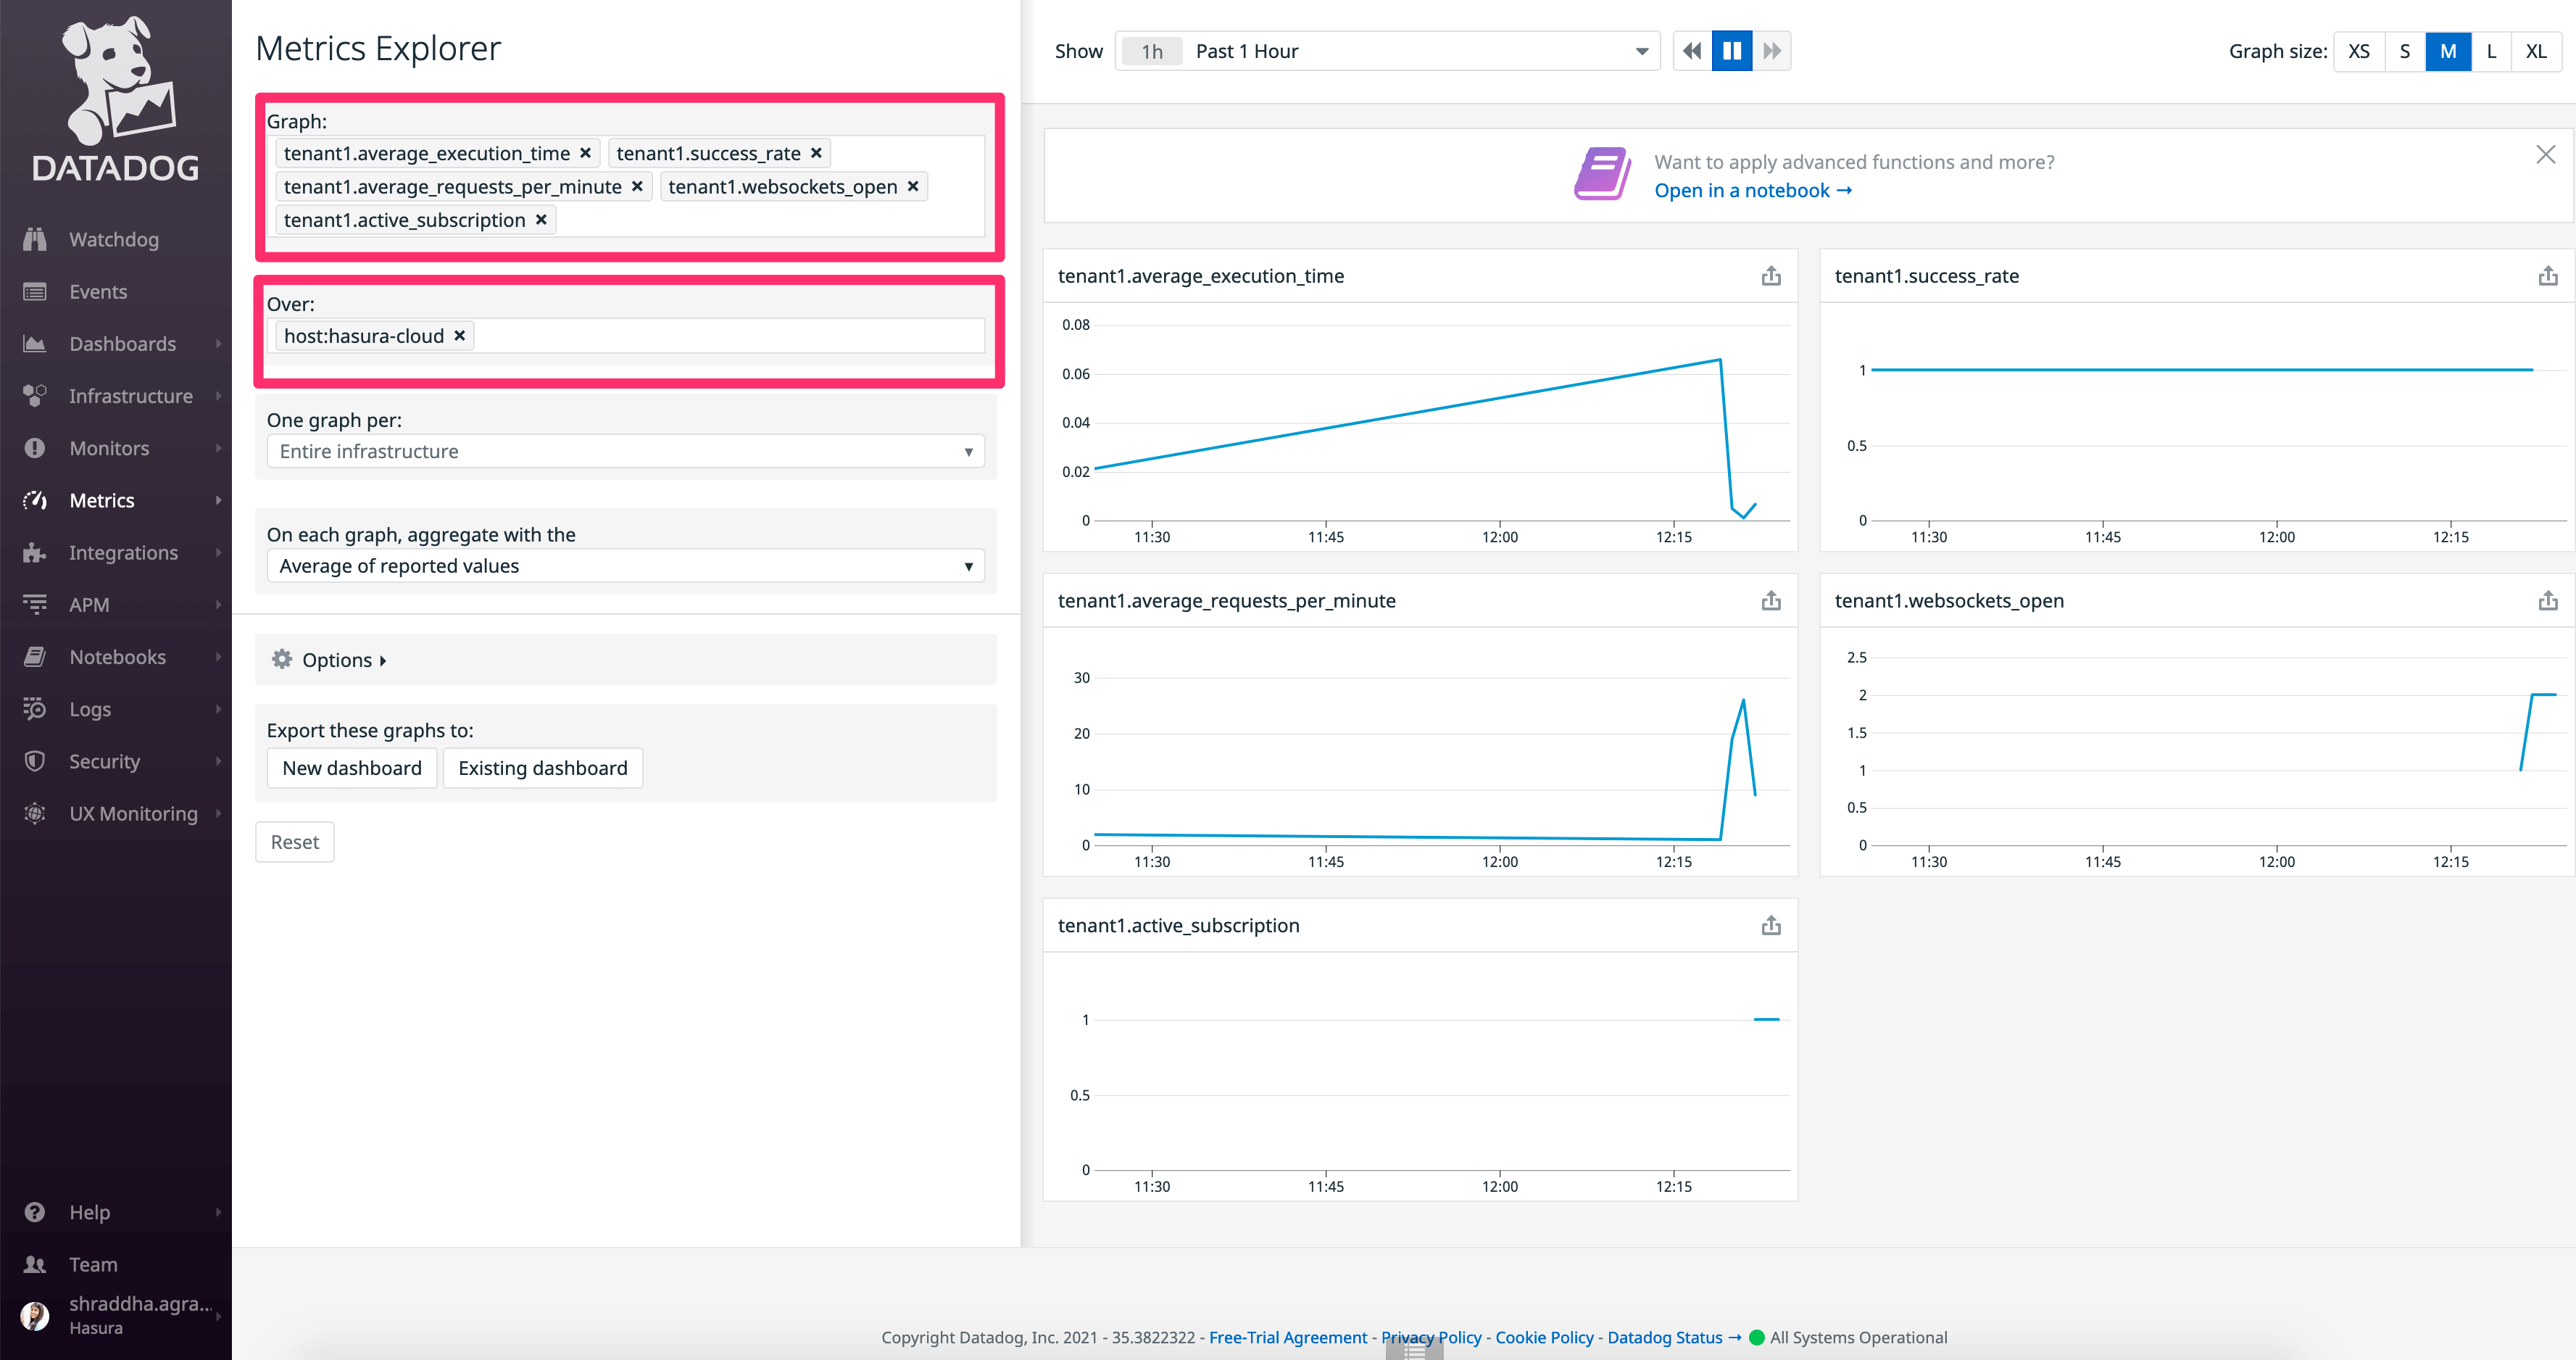
Select the graphs you want to view from the metrics explorer. Alternatively, select the host you configured with this
integration to see all the graphs corresponding to metrics exported by Hasura Cloud.
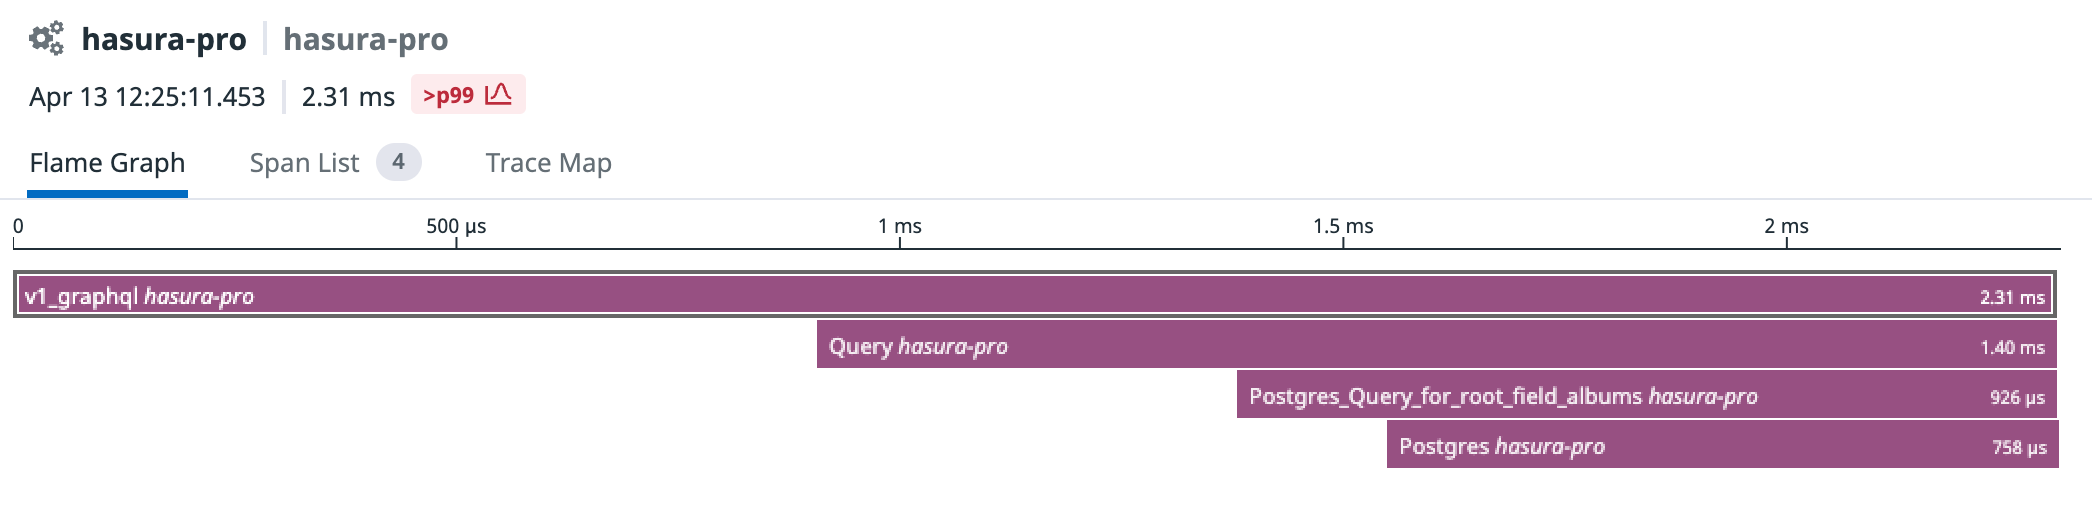
View traces
Along with the logs and metrics, query tracing is exported to Datadog. From your Datadog metrics page, APM > Traces
will show you a live search of ingested trace data, with each entry of the output table showing the duration of the
operation.
Clicking on an entry from the table will show the details about the trace, including a flame graph, which contains a visual representation of where the operation spent its execution over time. For example, in this case a query took 2.31 milliseconds in total, of which 758 microseconds was the actual Postgres database processing the query.