Prometheus Integration for Hasura Cloud
Introduction
You can export metrics of your Hasura Cloud project to Prometheus. This can be configured on the integrations tab on the project's setting page.
For Hasura Cloud projects, the Prometheus Integration is only available on the Standard (pay-as-you-go) tier and
above.
Try the new OpenTelemetry exporter to get advanced metrics and traces to connect with Prometheus. This integration will export the metrics as detailed here.
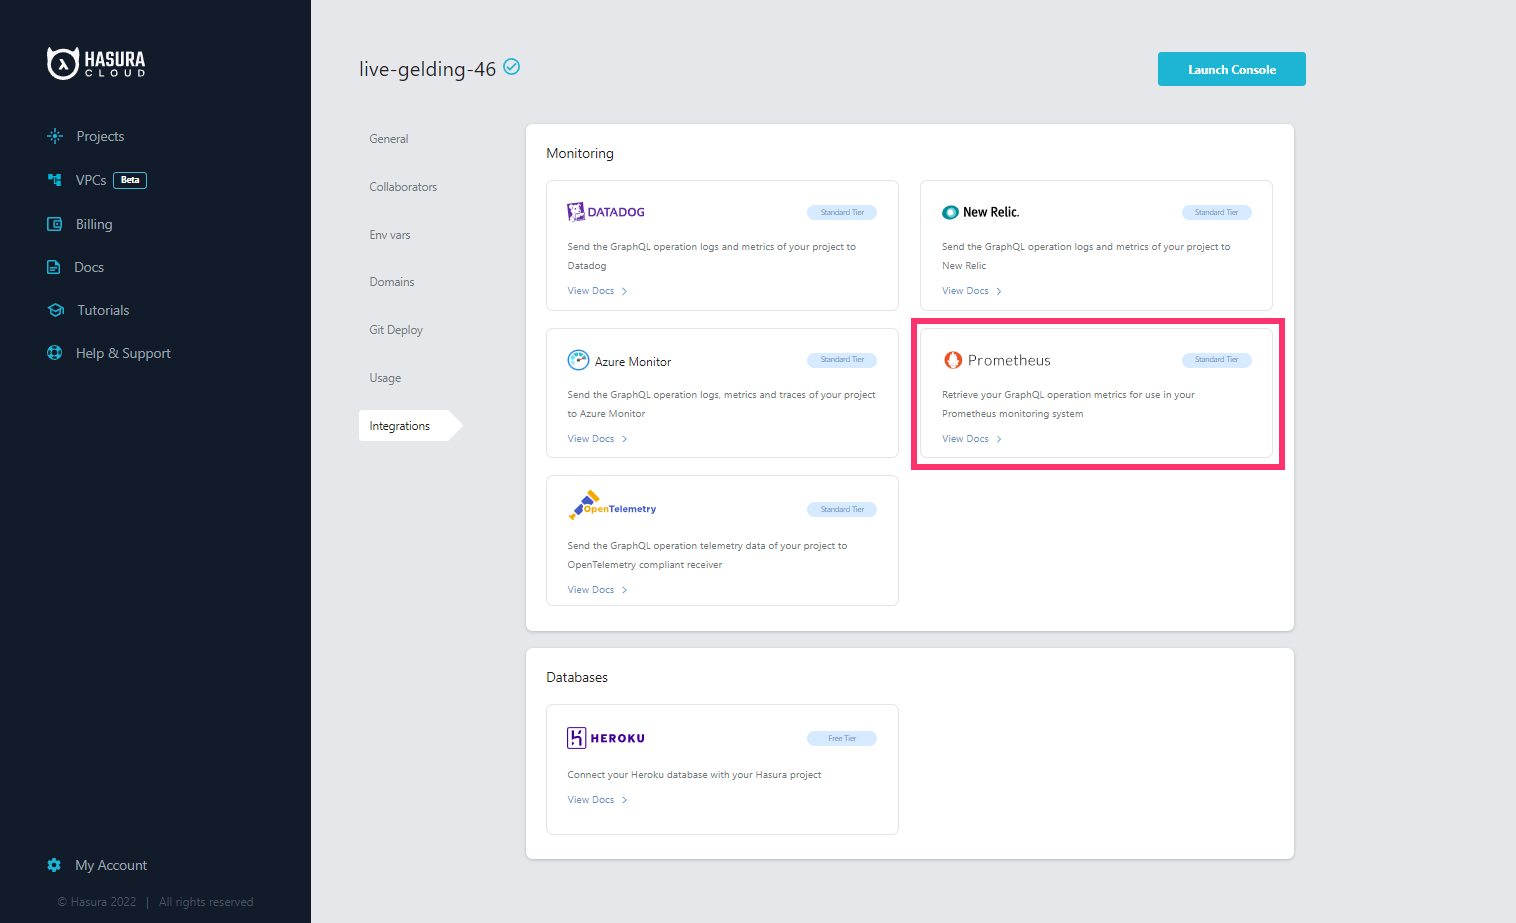
Configure Prometheus integration
Navigate to the integrations tab on project settings page to find Prometheus integration.
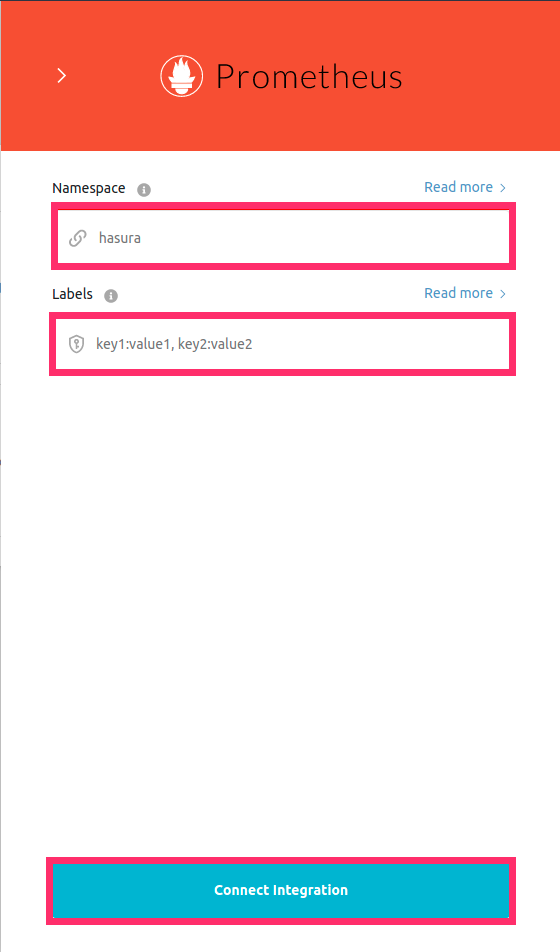
Enter the Namespace and label values to be associated to the exported metrics and click on Connect Integration.
| Field | Description |
|---|---|
| Namespace (Optional) | The single word prefix relevant to the domain the metrics belong to. Read more about namespace on Prometheus docs. |
| Labels (Optional) | Labels are key-value pairs associated with your metrics used to differentiate the characteristics of the metric that is being measured. |
Prometheus instance configuration
The Prometheus instance(Agent) needs to be configured with Basic Auth mode with Project ID as username and the generated Access token as Password. The Connection URL is needed to configure the Scrape Target rule.
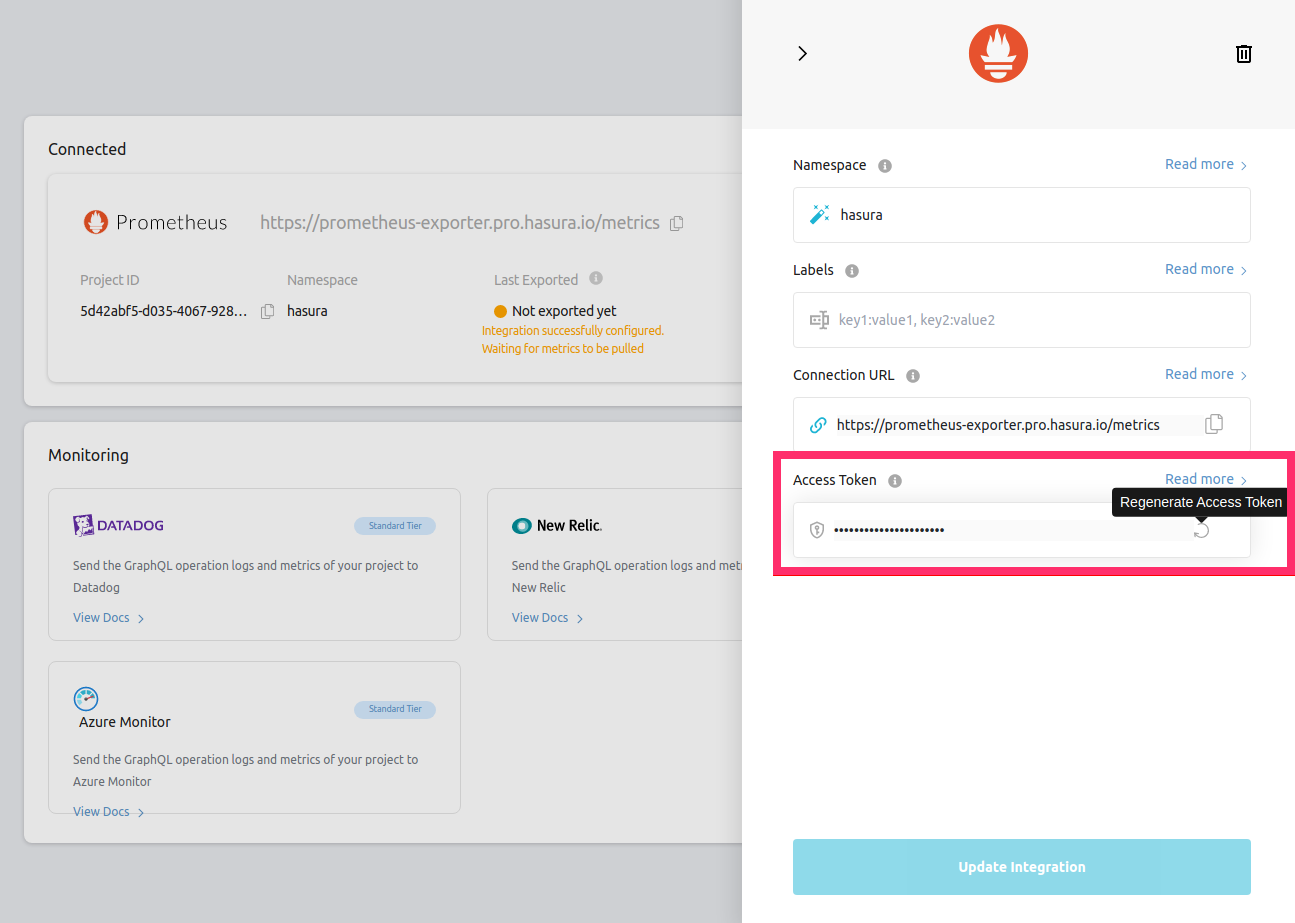
Access Token
The Access Token is generated once the Integration is created. The token is showed only once and cannot be retrieved again. Access token is used as the password for Basic Authentication by the Prometheus Agent.
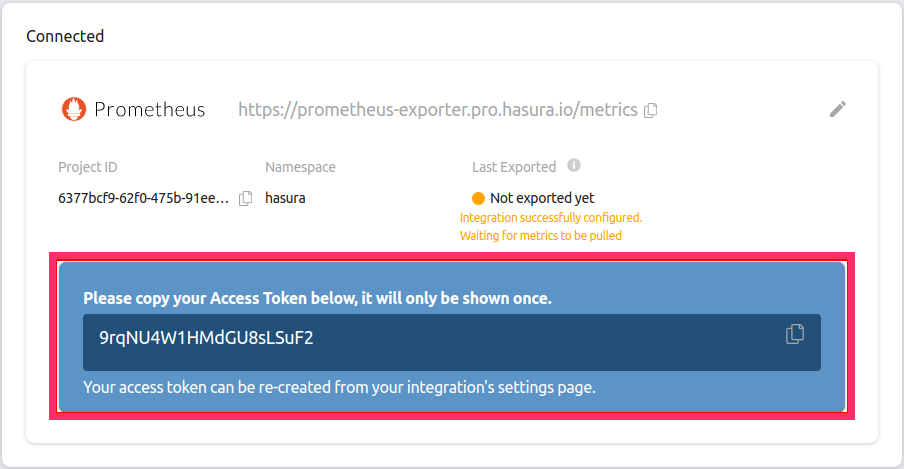
The token can be re-generated from the Configuration Panel of the Integration. This action is permanent and cannot be reversed.
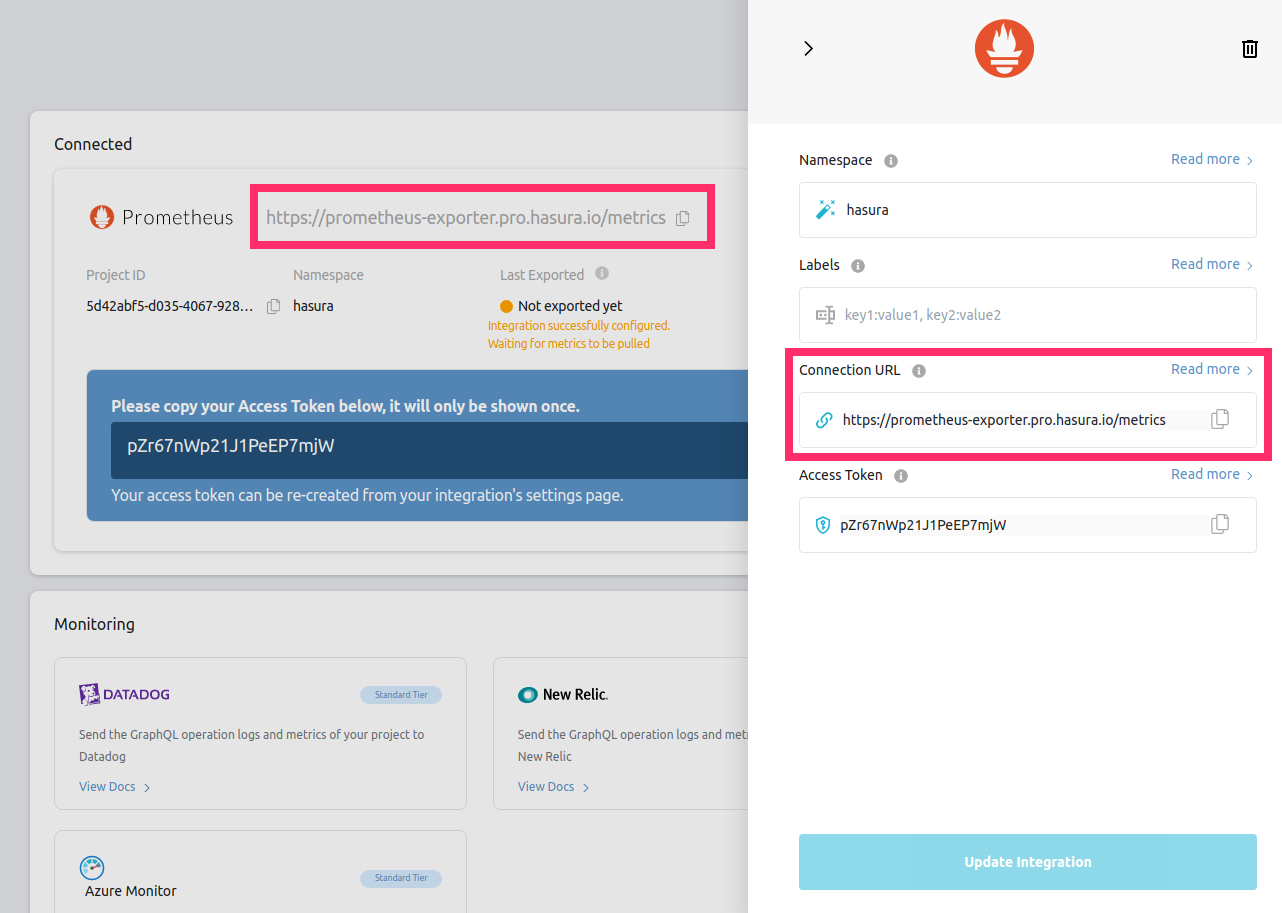
Connection URL
This is the secured webhook URL which exposes the Project Metrics in the prometheus compatible format. It has 3 parts
namely scheme, host name and metrics_path. For example, if the connection URL is
https://prometheus-exporter.pro.hasura.io/metrics, then the scheme is https, host name (This includes sub-domains as
well) is prometheus-exporter.pro.hasura.io and metrics_path is /metrics.
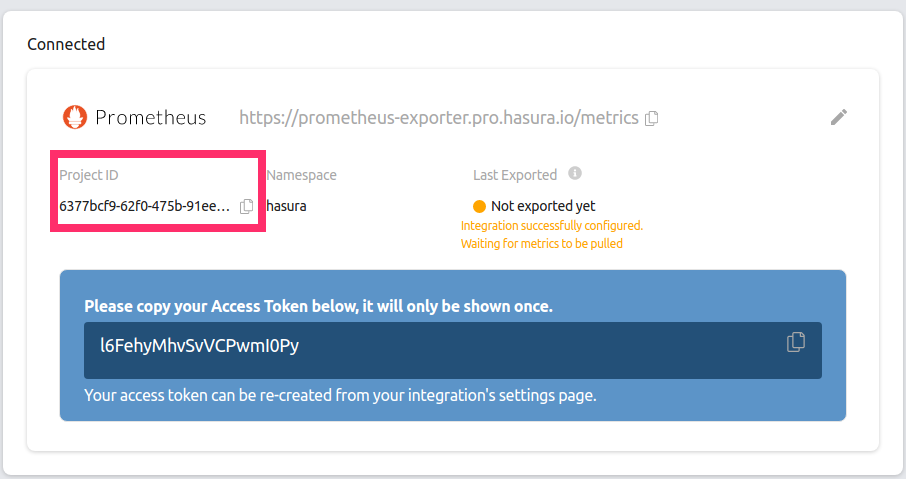
Project ID
The Project ID is used as the Username for the Basic Authentication by the Prometheus agent.
The following YAML template can be used as the config file to establish connectivity with the exposed Integration.
global:
  scrape_interval: 60s
scrape_configs:
  - job_name: 'hasura_prometheus_exporter'
    scrape_interval: 60s ## Recommended scrape interval is 60s
    metrics_path: '/metrics' ## Replace with metrics Path of the connection URL
    scheme: 'https' ## Replace with the scheme of the connection URL
    basic_auth:
      username: 'd01c60e1-1b11-564d-bb09-0a39e3e41b05' ## Replace with project ID
      password: 'IrhO3GlR8oXTfsdfdsNs8Nj' ## Replace with Access Token
    static_configs:
      - targets: ['prometheus-exporter.pro.hasura.io'] ## Replace with the host name of the connection URL
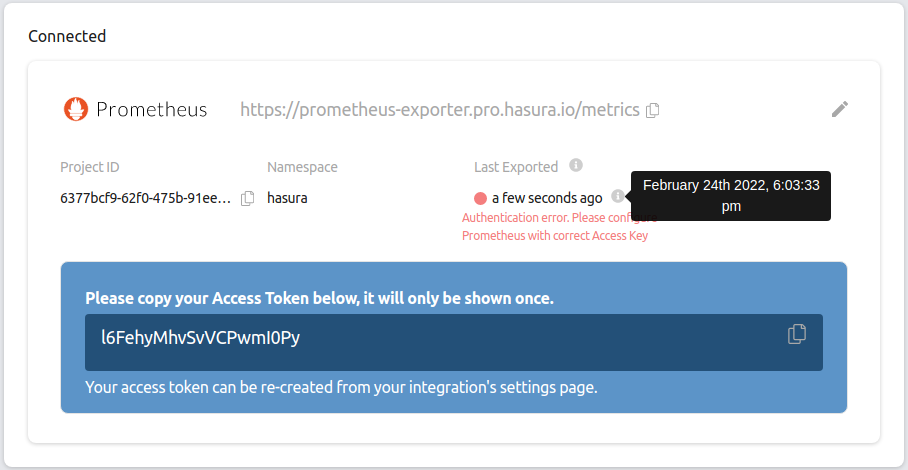
Checking the status of the integration
The green/red dot signifies the status of the integration. Green signifies successful exporting of metrics to
Prometheus. When metrics are successfully exported, Last Exported is continuously updated, indicating the timestamp of
the last metric successfully exported to your Prometheus Instance.
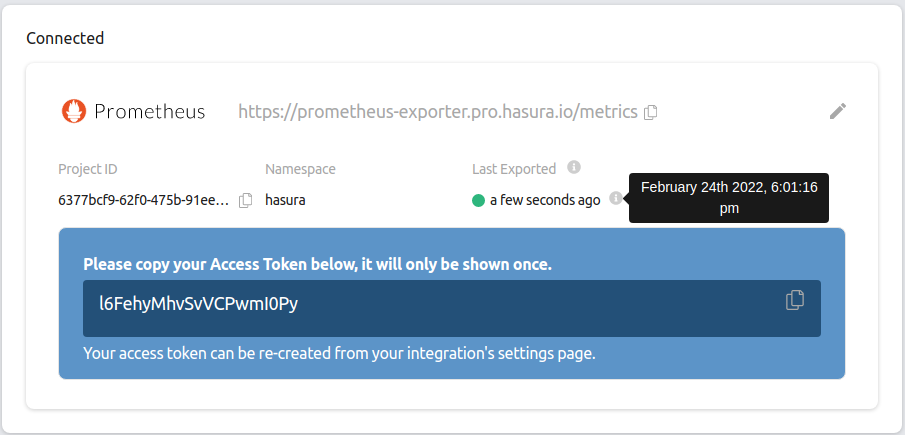
In case there is an error while exporting metrics to Prometheus, the dot is red and the error message is displayed right below it.
Metrics details
The integration exports the following five metrics to your Prometheus Instance:
| Metric Exported | Metric Name in Prometheus |
|---|---|
| Average number of requests | average_requests_per_minute |
| Average request execution time | average_execution_time |
| Success rate of requests | success_rate |
| Active subscriptions | active_subscriptions |
| Number of websockets open | websockets_open |
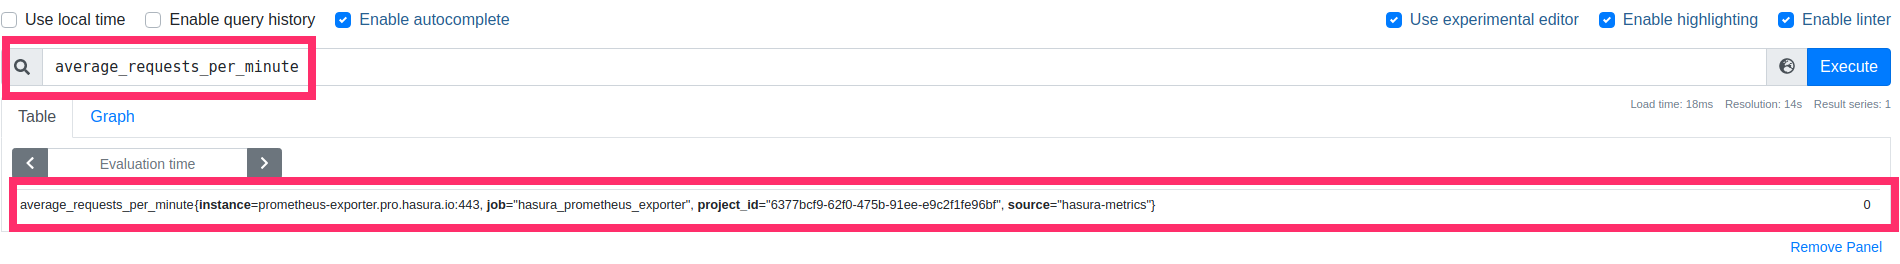
If average_requests_per_minute is 0 (Which means no incoming requests in the Last one minute),
average_execution_time is reported as 0 and success_rate is reported as 1 to avoid NaN values in Prometheus.
If Namespace and Labels are configured (Optional), the format of the metric identifier is
namespace_metricName{key1=value1, key2=value2}
View metrics
The metrics can be queried from the Prometheus Dashboard (or using tools like Grafana)