Monitoring Your Hasura Cloud Project
Introduction
Hasura Cloud now offers a new built-in observability feature, accessible from your project dashboard, allowing you to monitor key performance metrics of your Hasura GraphQL API. This feature is designed to help you track and optimize the performance of your project in real-time.
Accessing the Monitoring Dashboard
To view the observability data for your project:
Navigate to Your Project: From the Hasura Cloud dashboard, select the project for which you want to view the monitoring data.
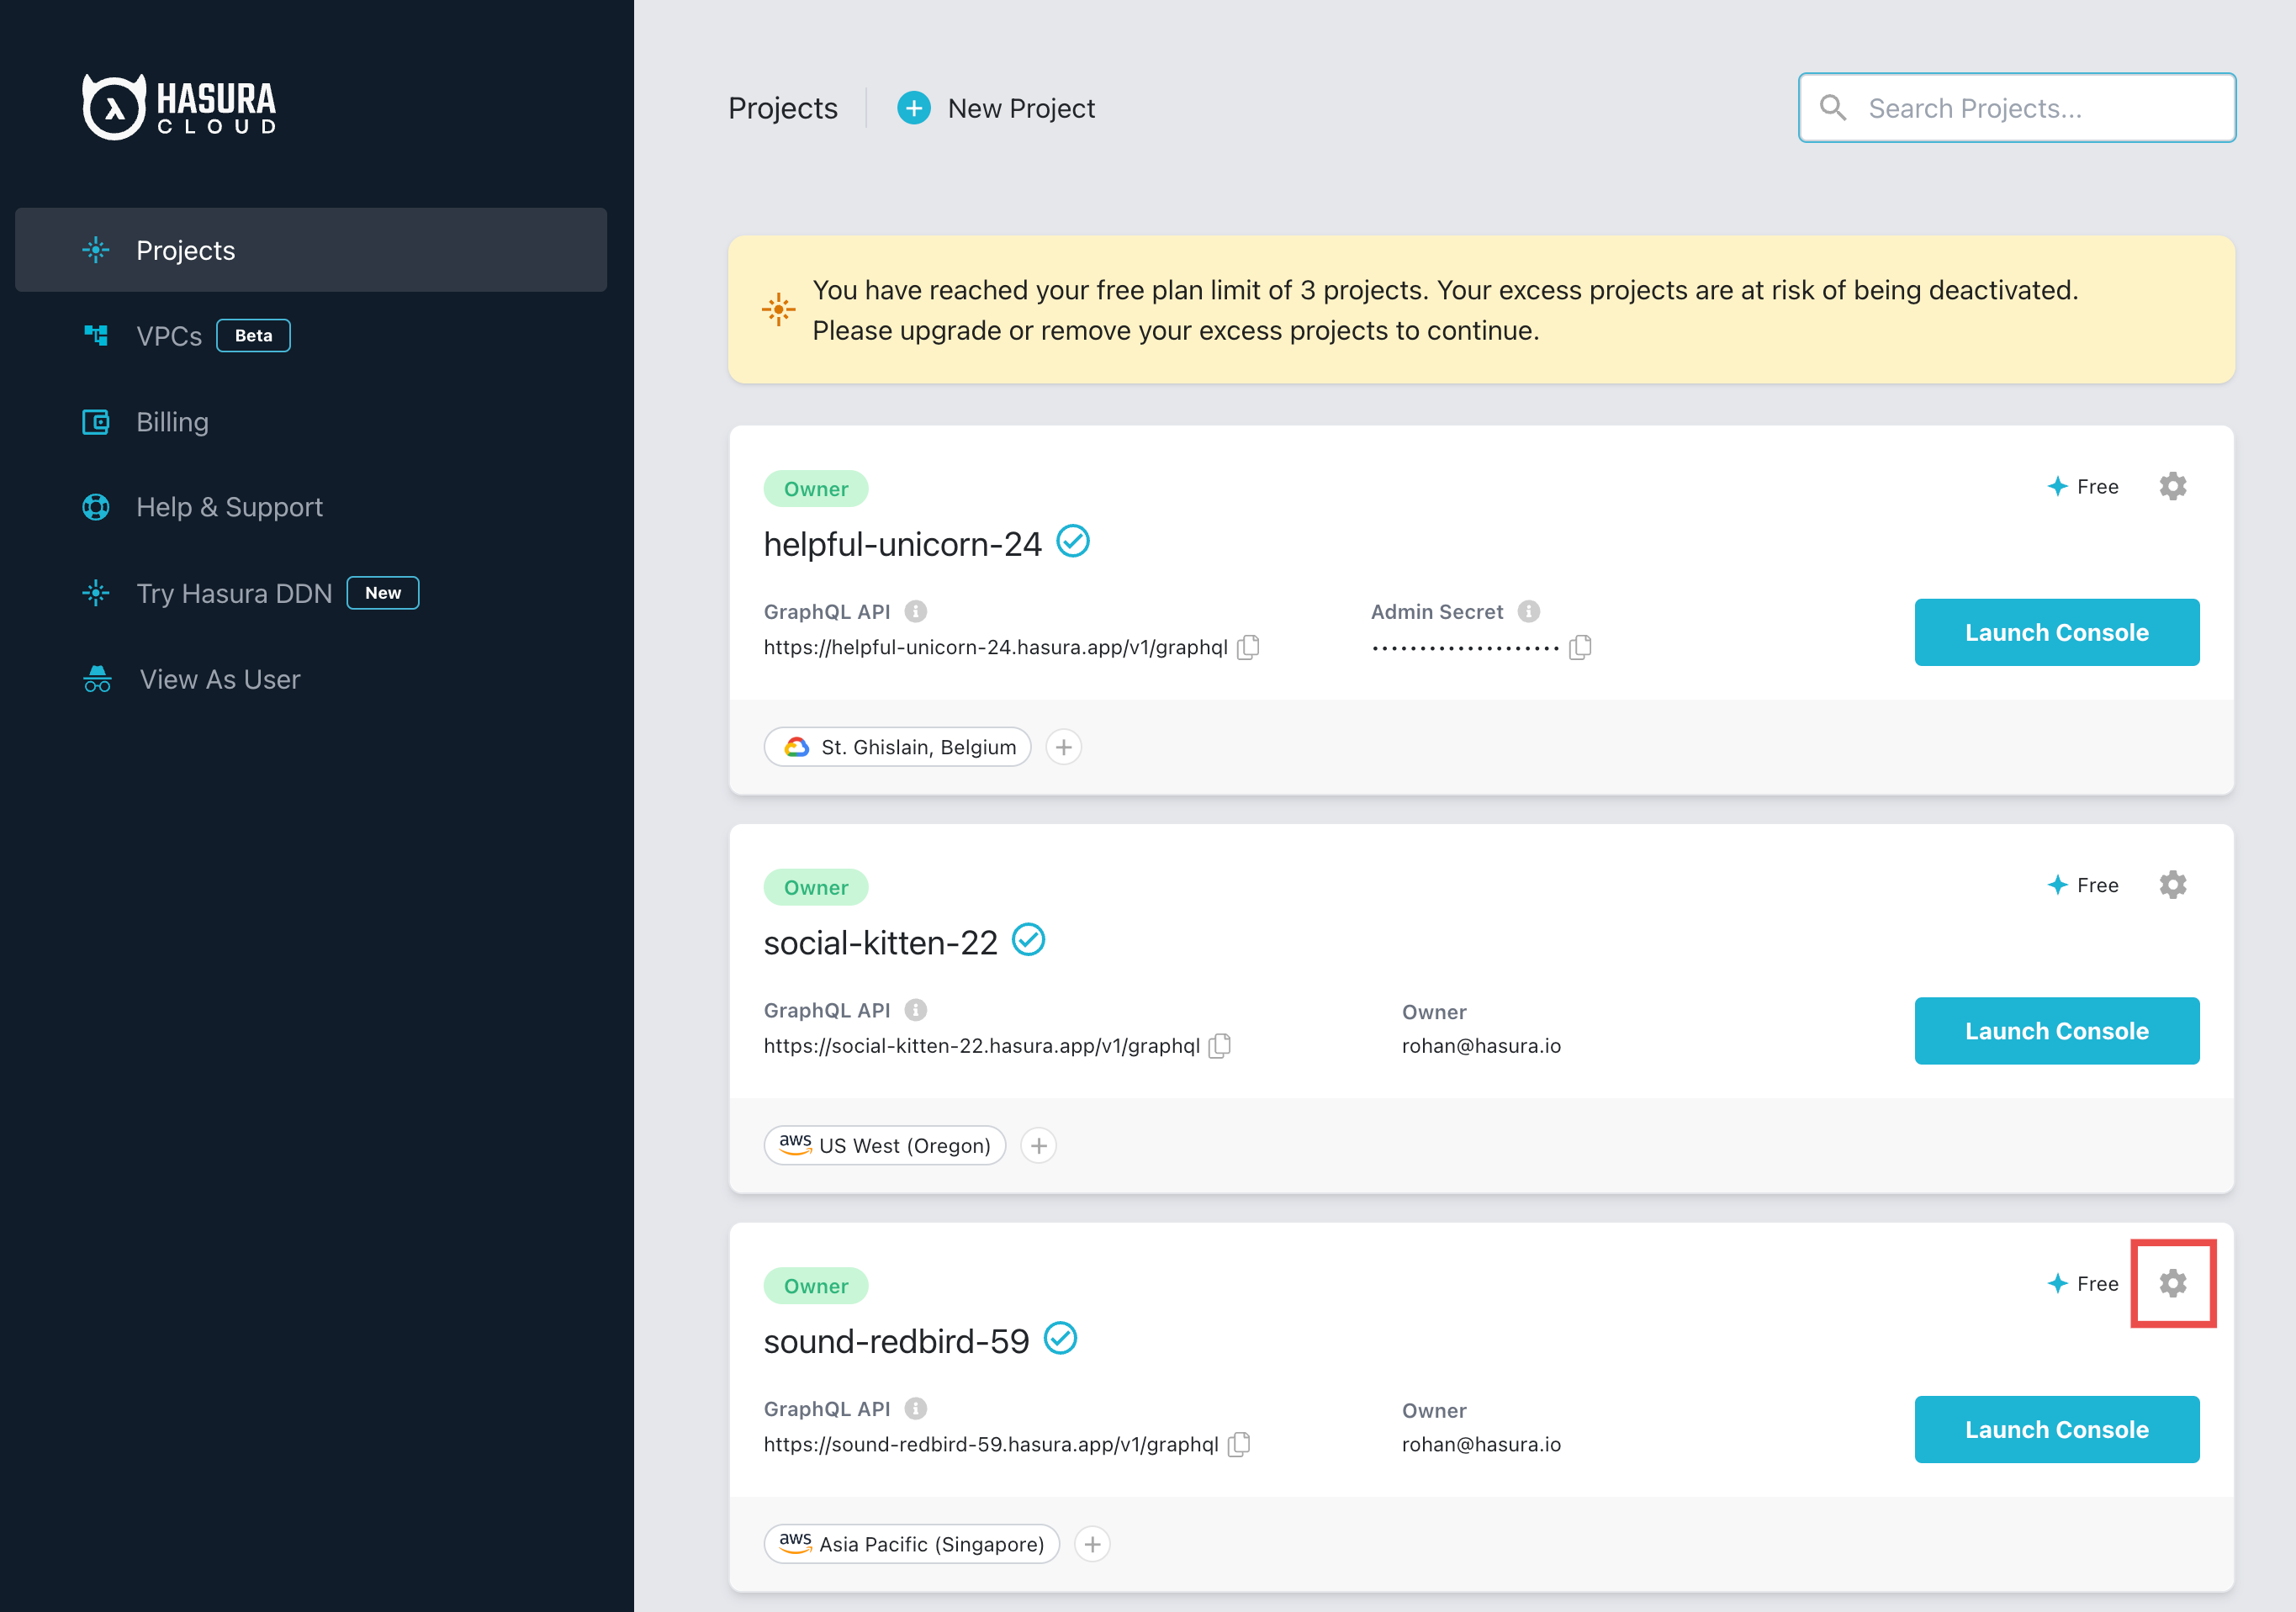
Monitoring Tab: On the project page, locate the Monitoring tab in the sidebar. Click on it to view the detailed performance metrics.
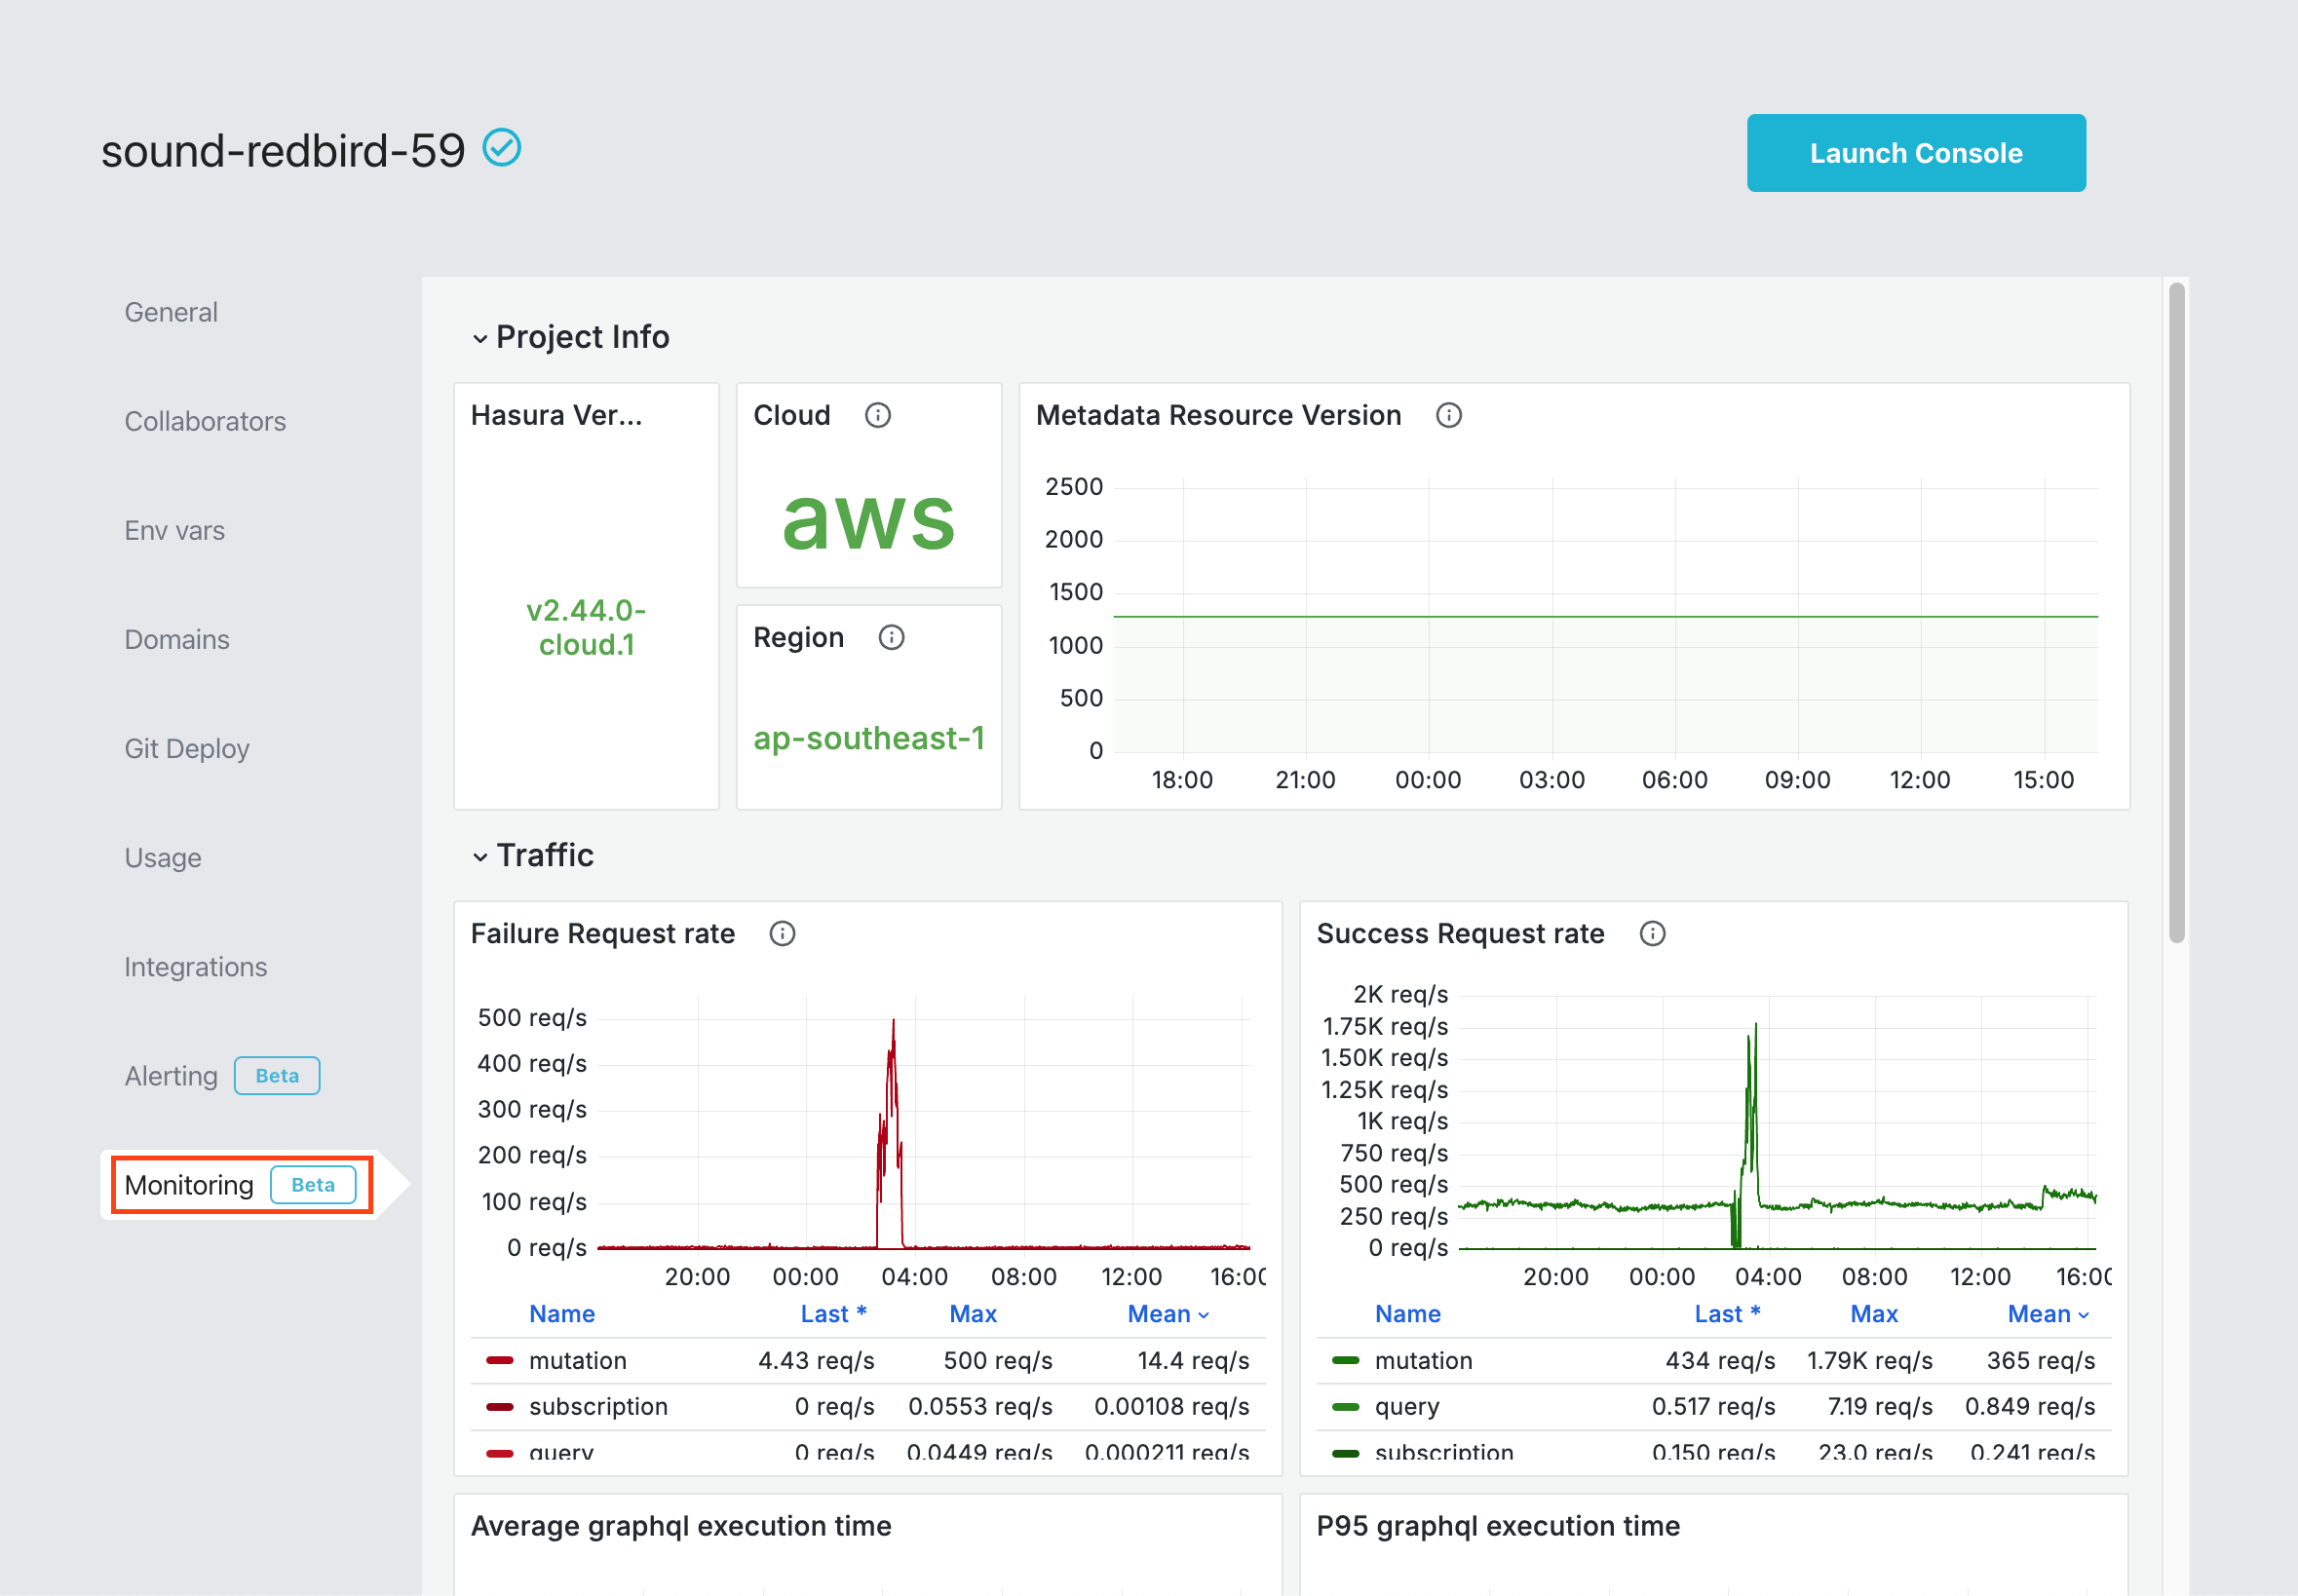
Alternatively you can click on Metrics URL from the project page to view the metrics in Grafana.
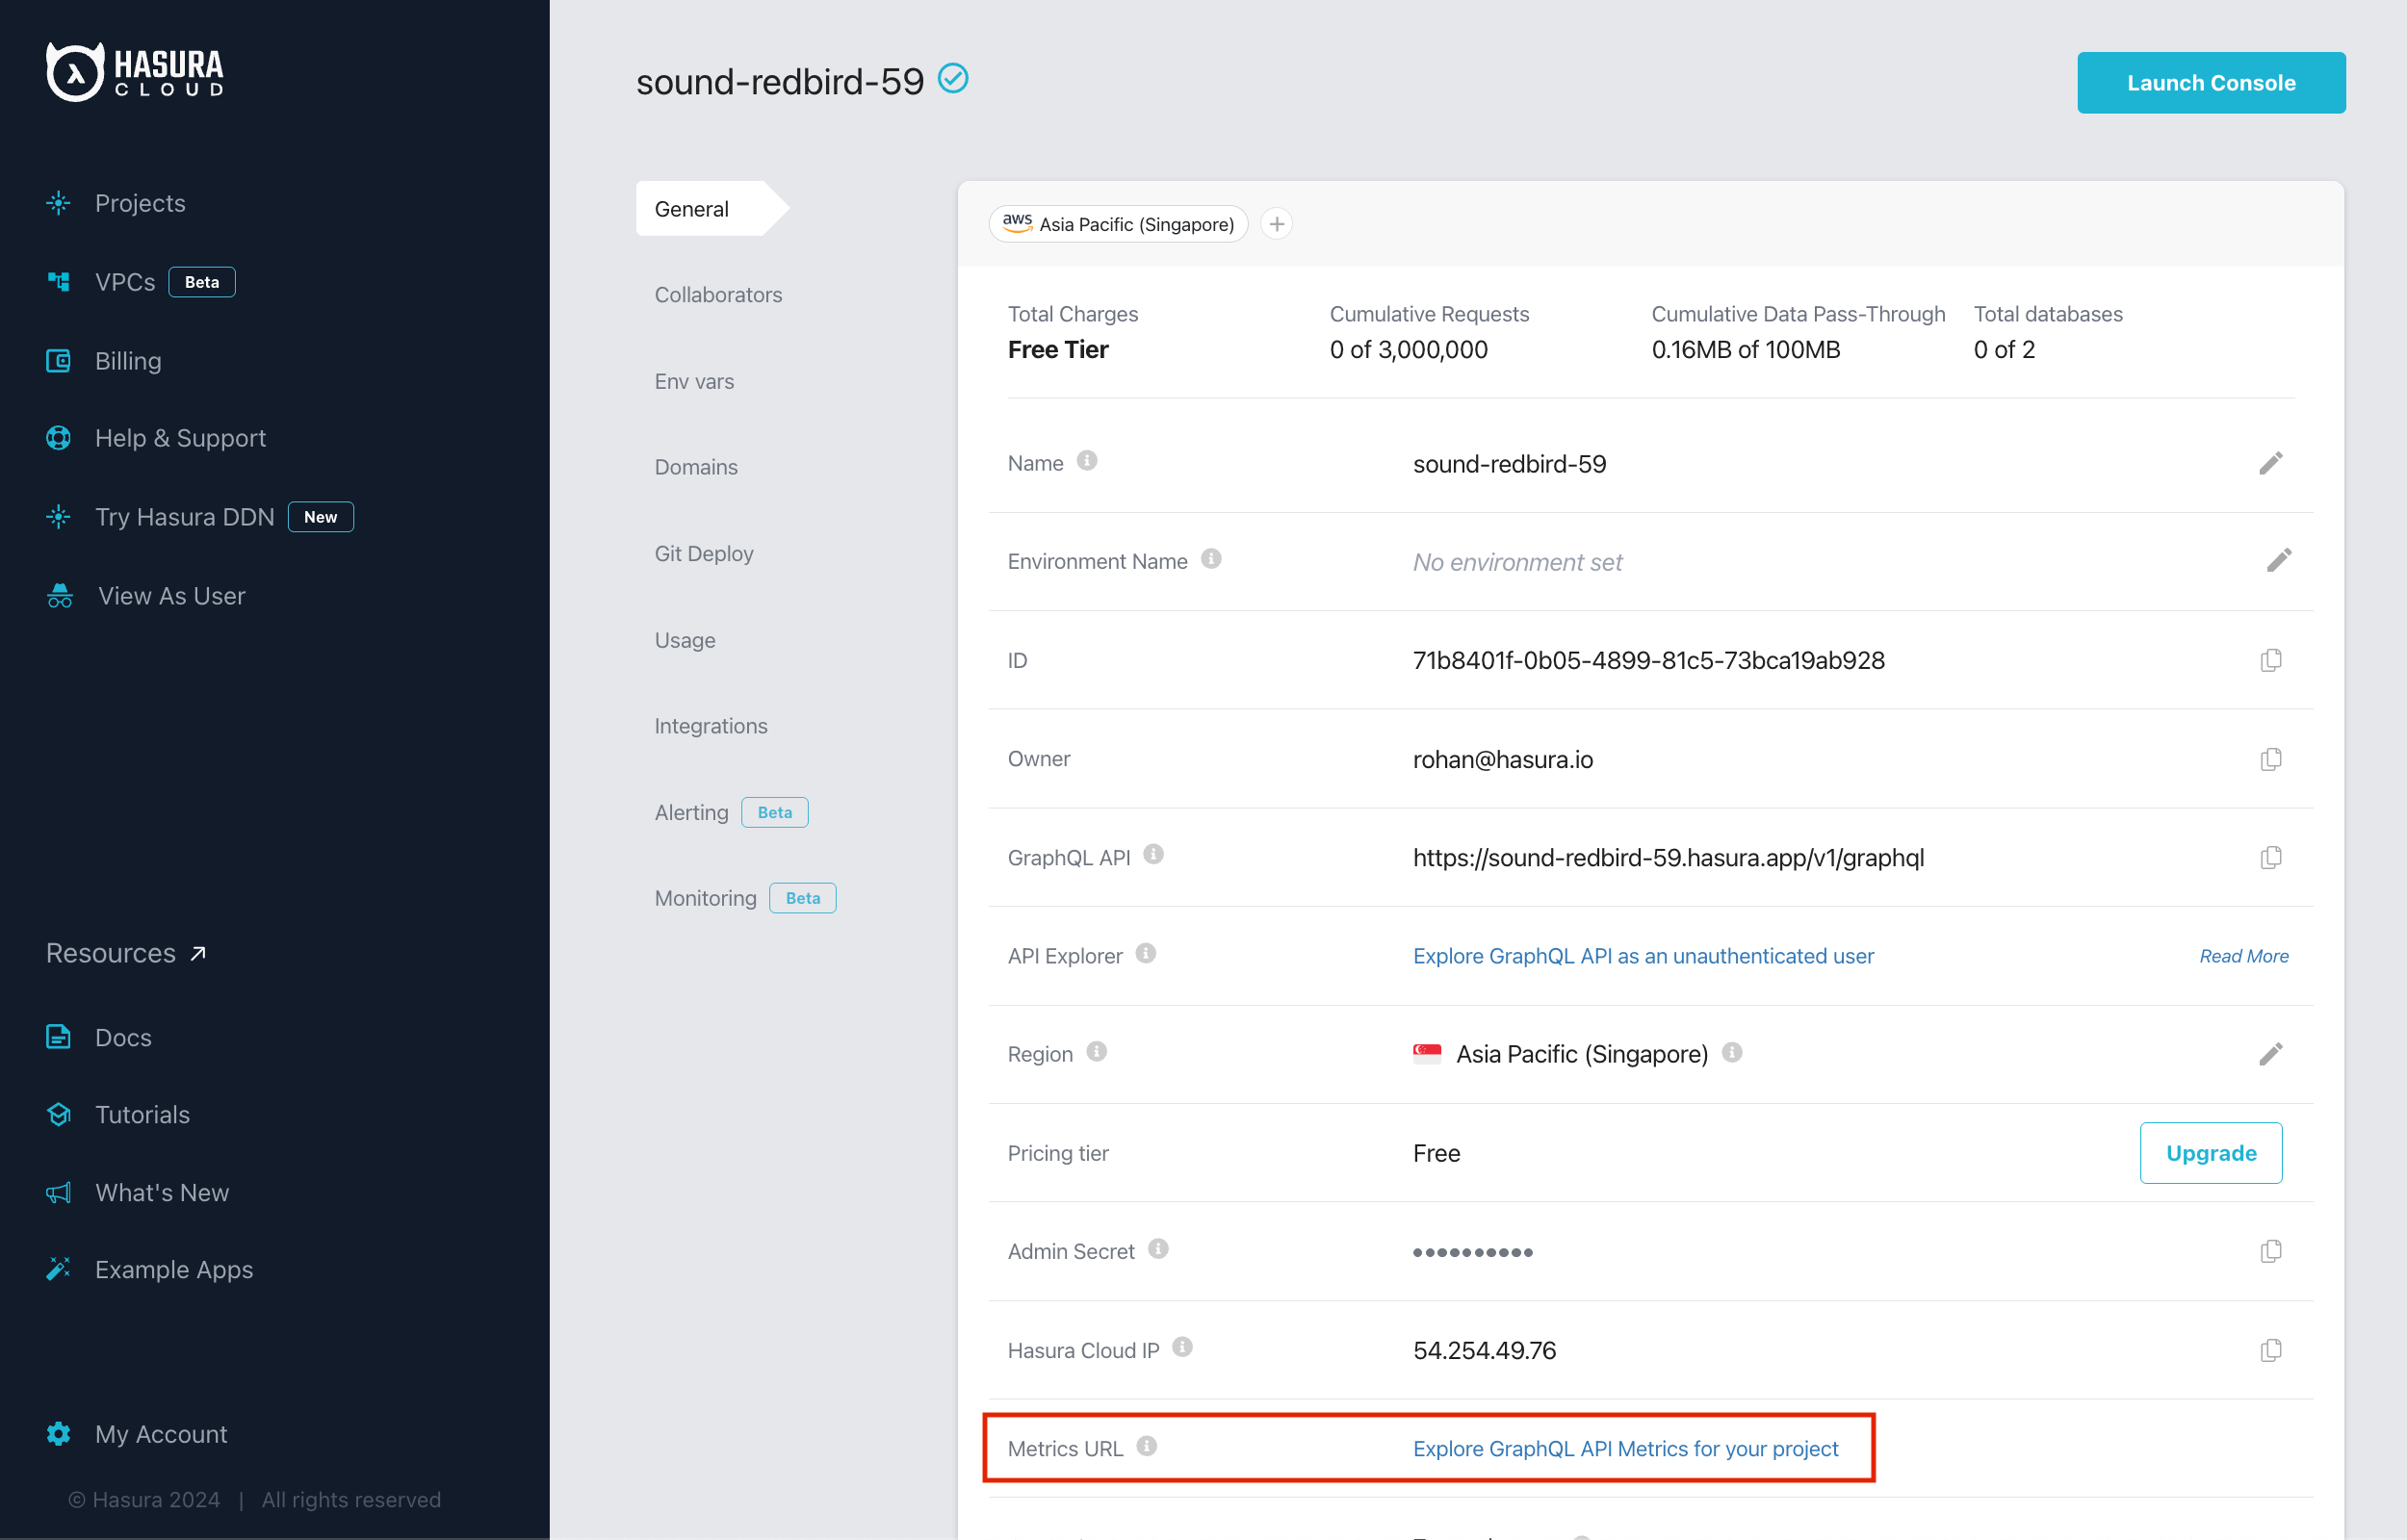
Available metrics
Once inside the Monitoring tab or Grafana, you can view the following metrics:
Project Info: Displays the project version, cloud region, metadata version, etc.

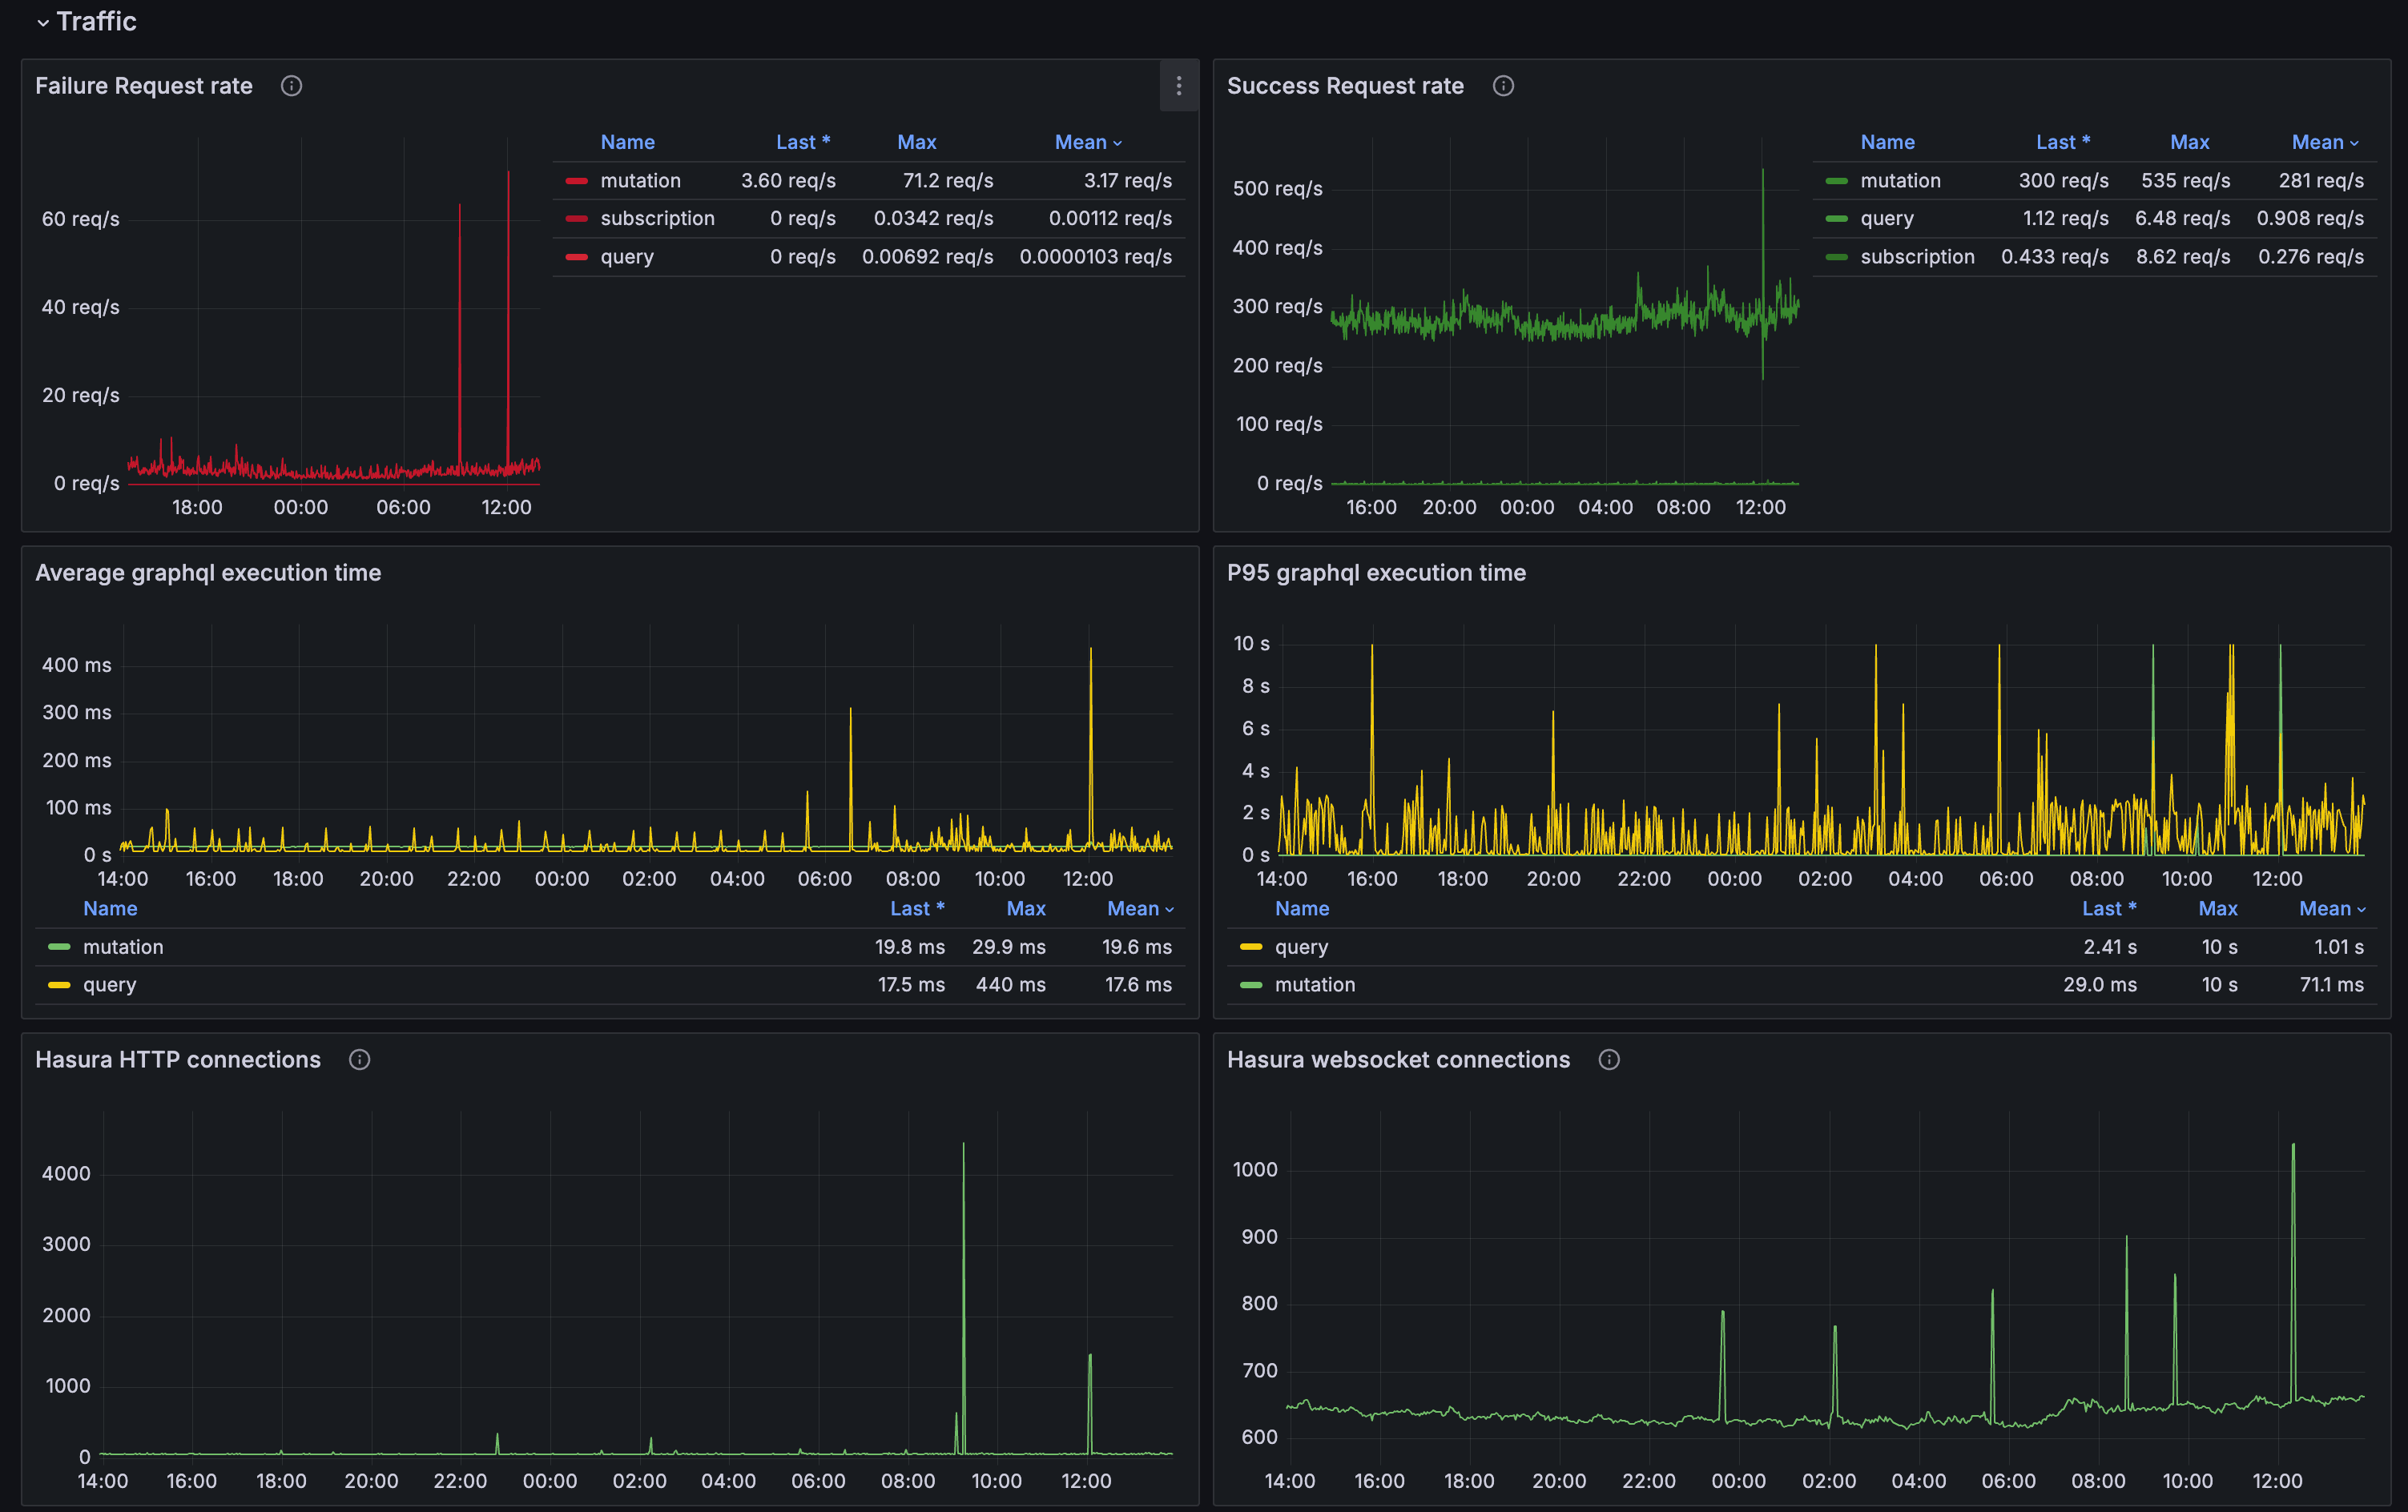
Traffic overview: Displays the total number of requests, average response time, error rate, and other relevant details.
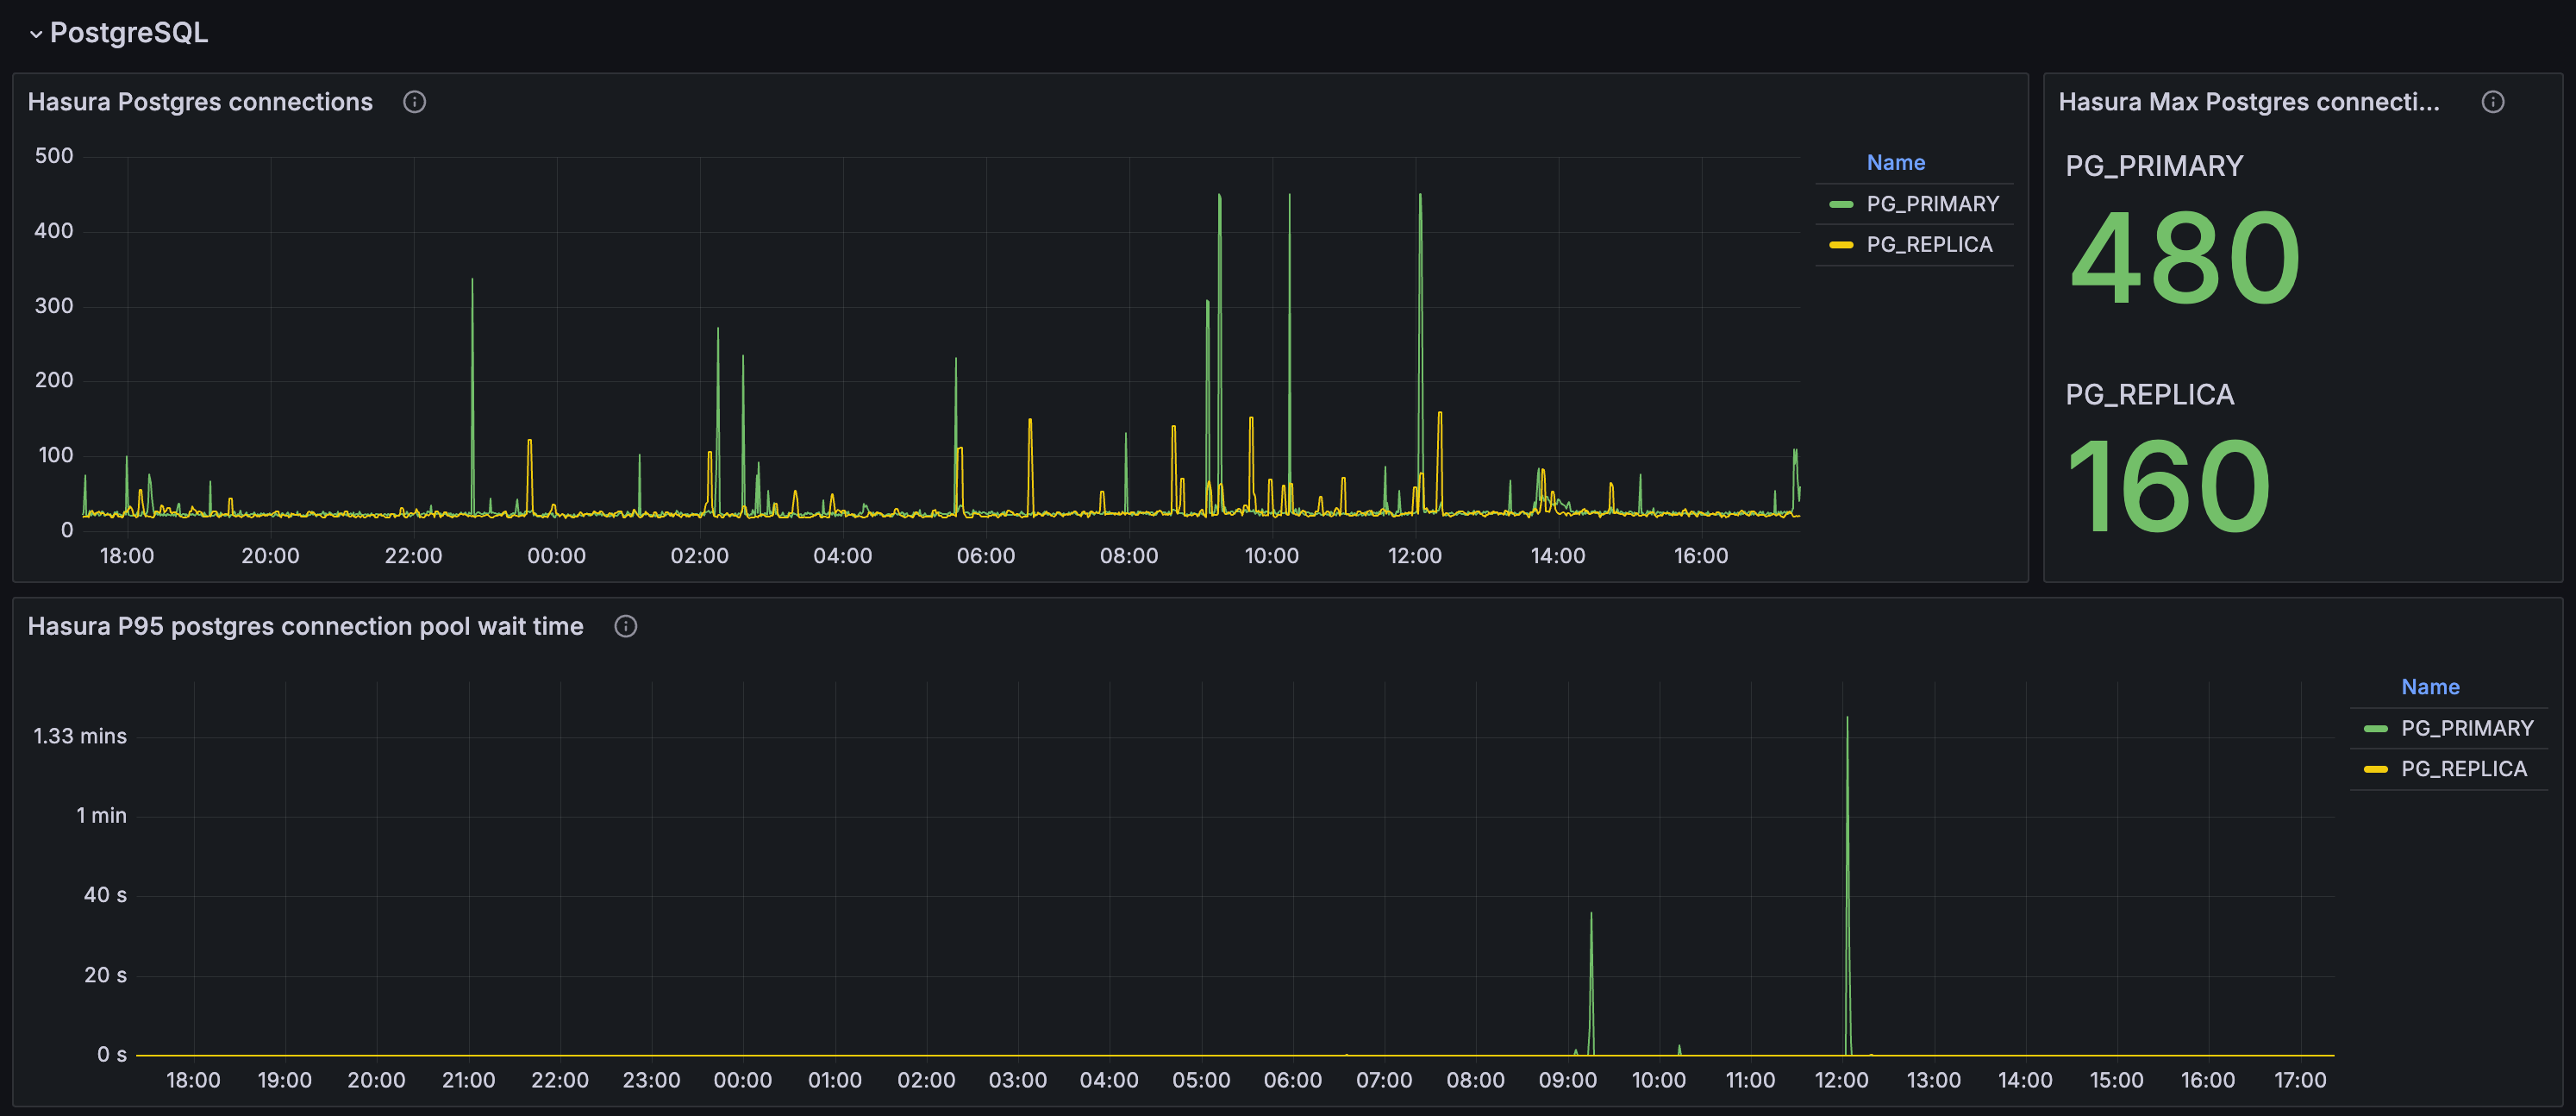
PostgreSQL Metrics: Displays the performance metrics of the PostgreSQL database, including the number of active connections, connection pool latency, etc.
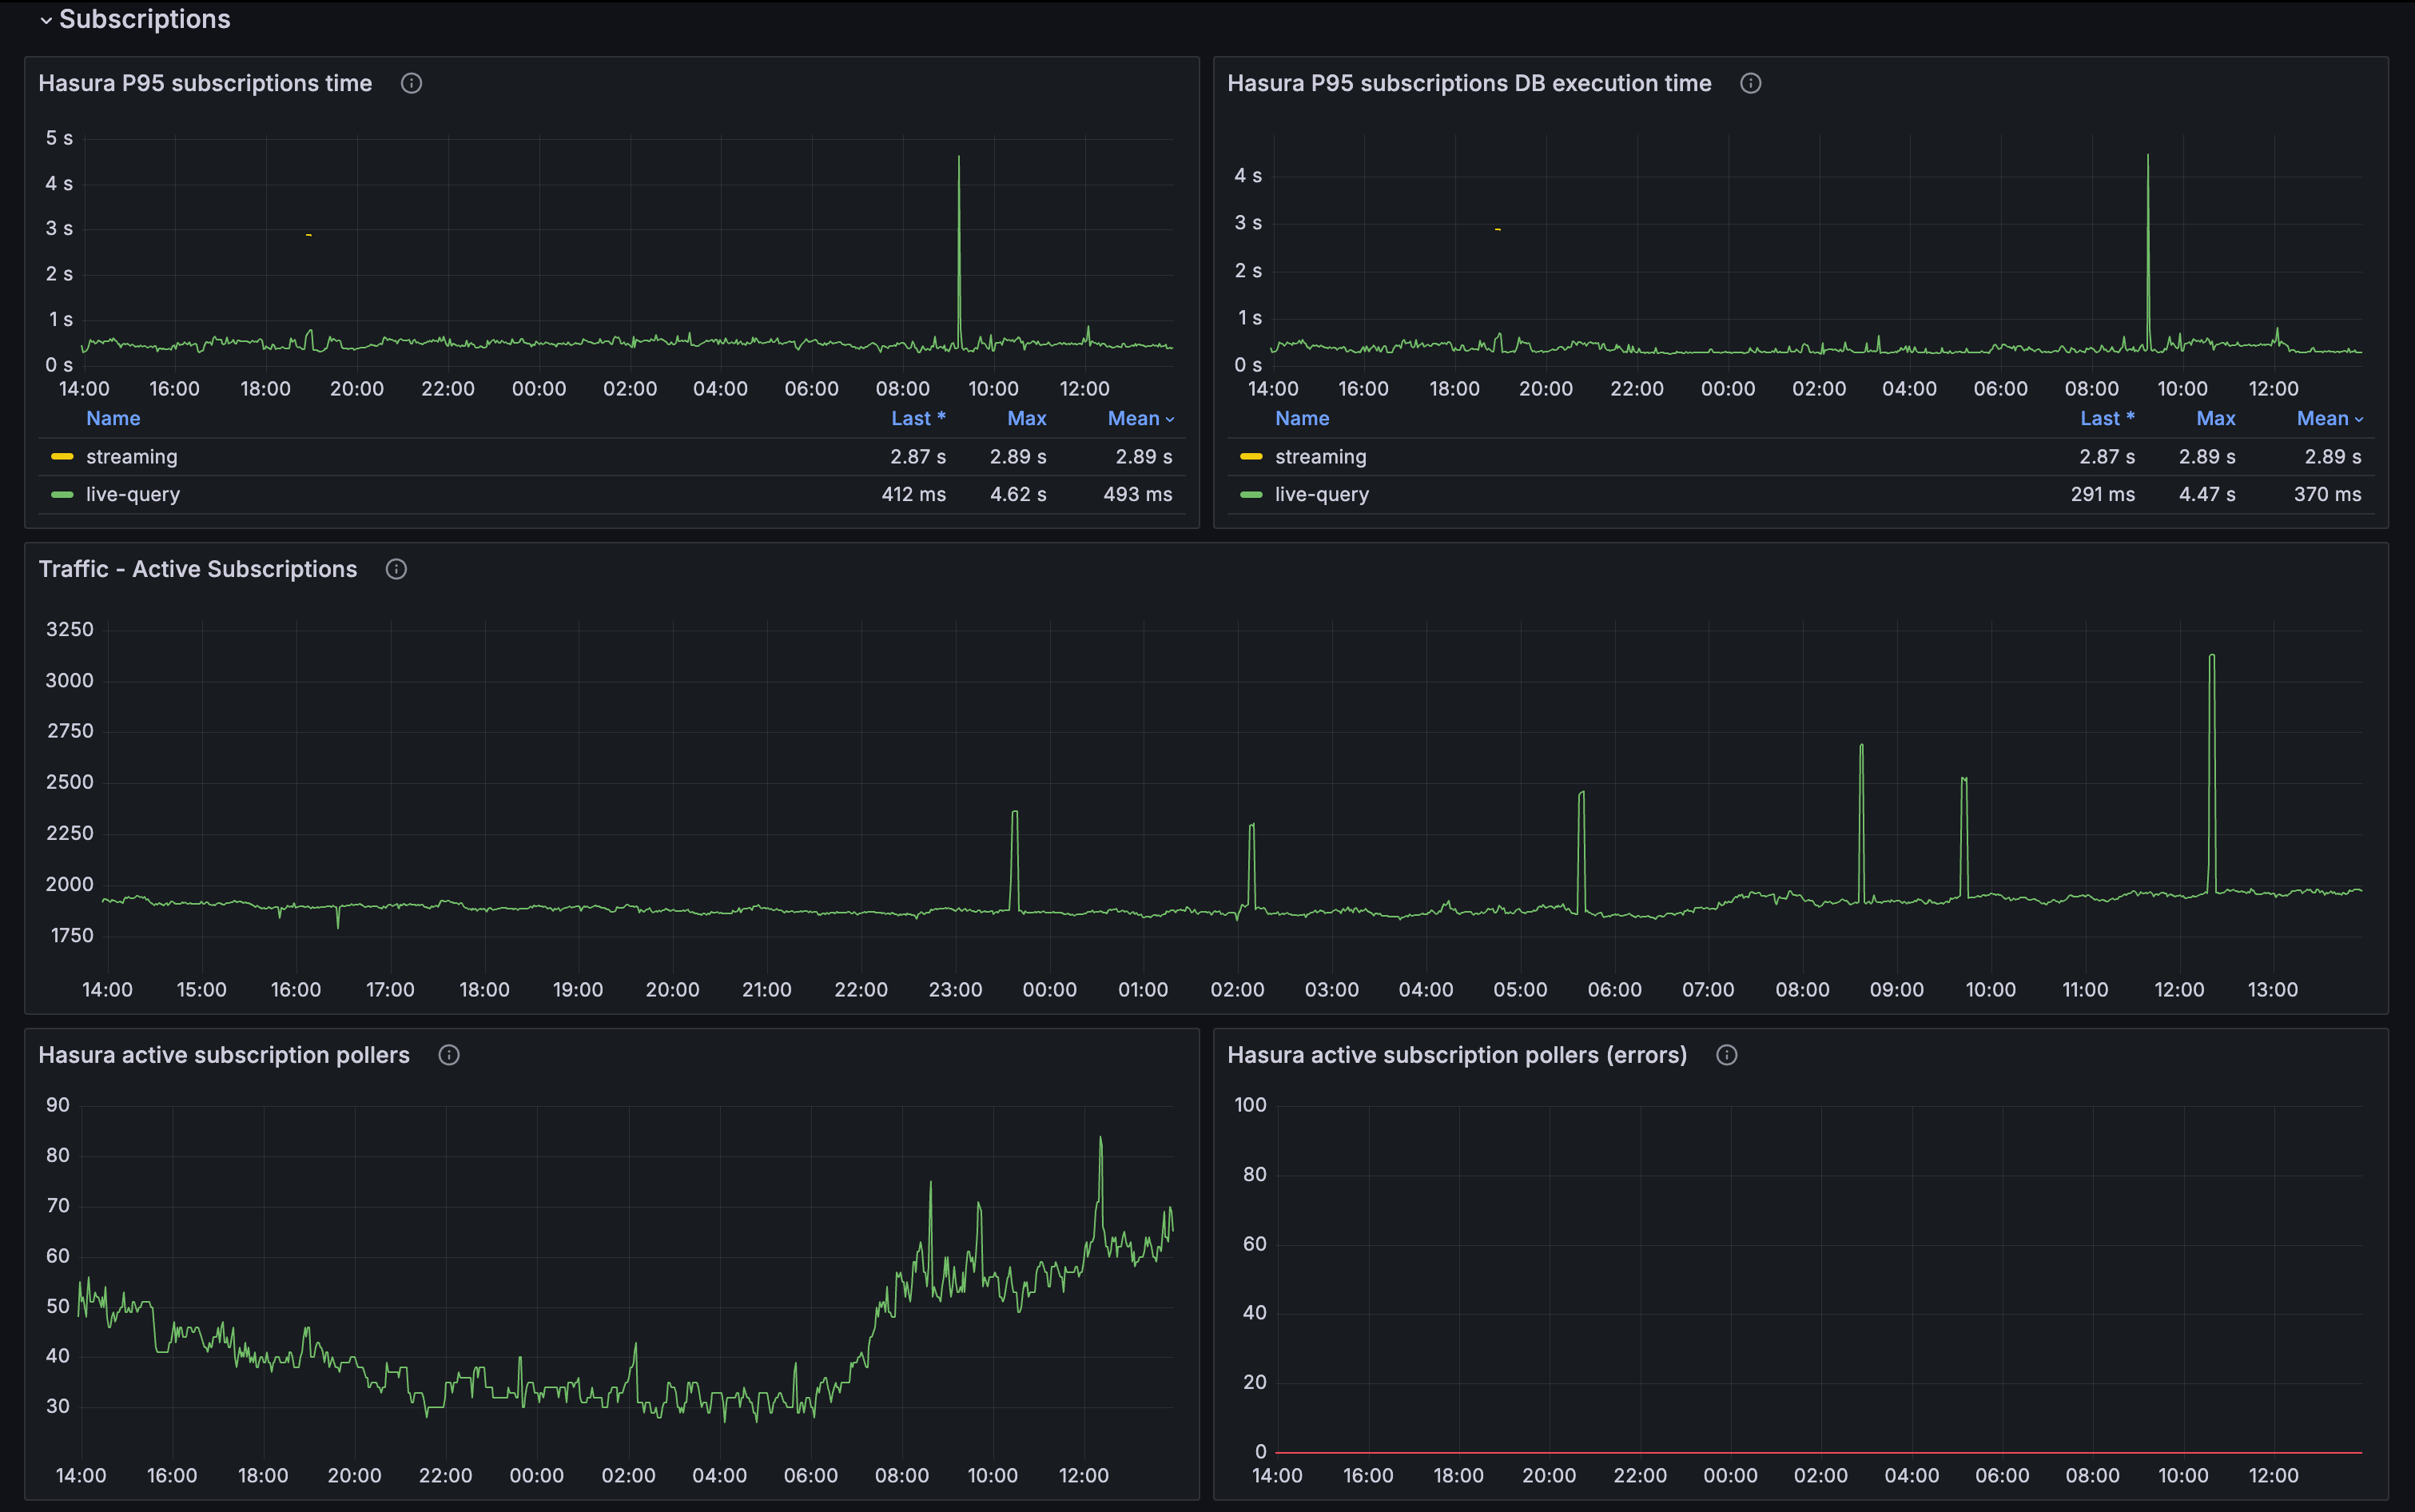
Subscription Metrics: Displays the performance metrics of the GraphQL subscriptions, including the number of active subscriptions, subscription latency, etc.
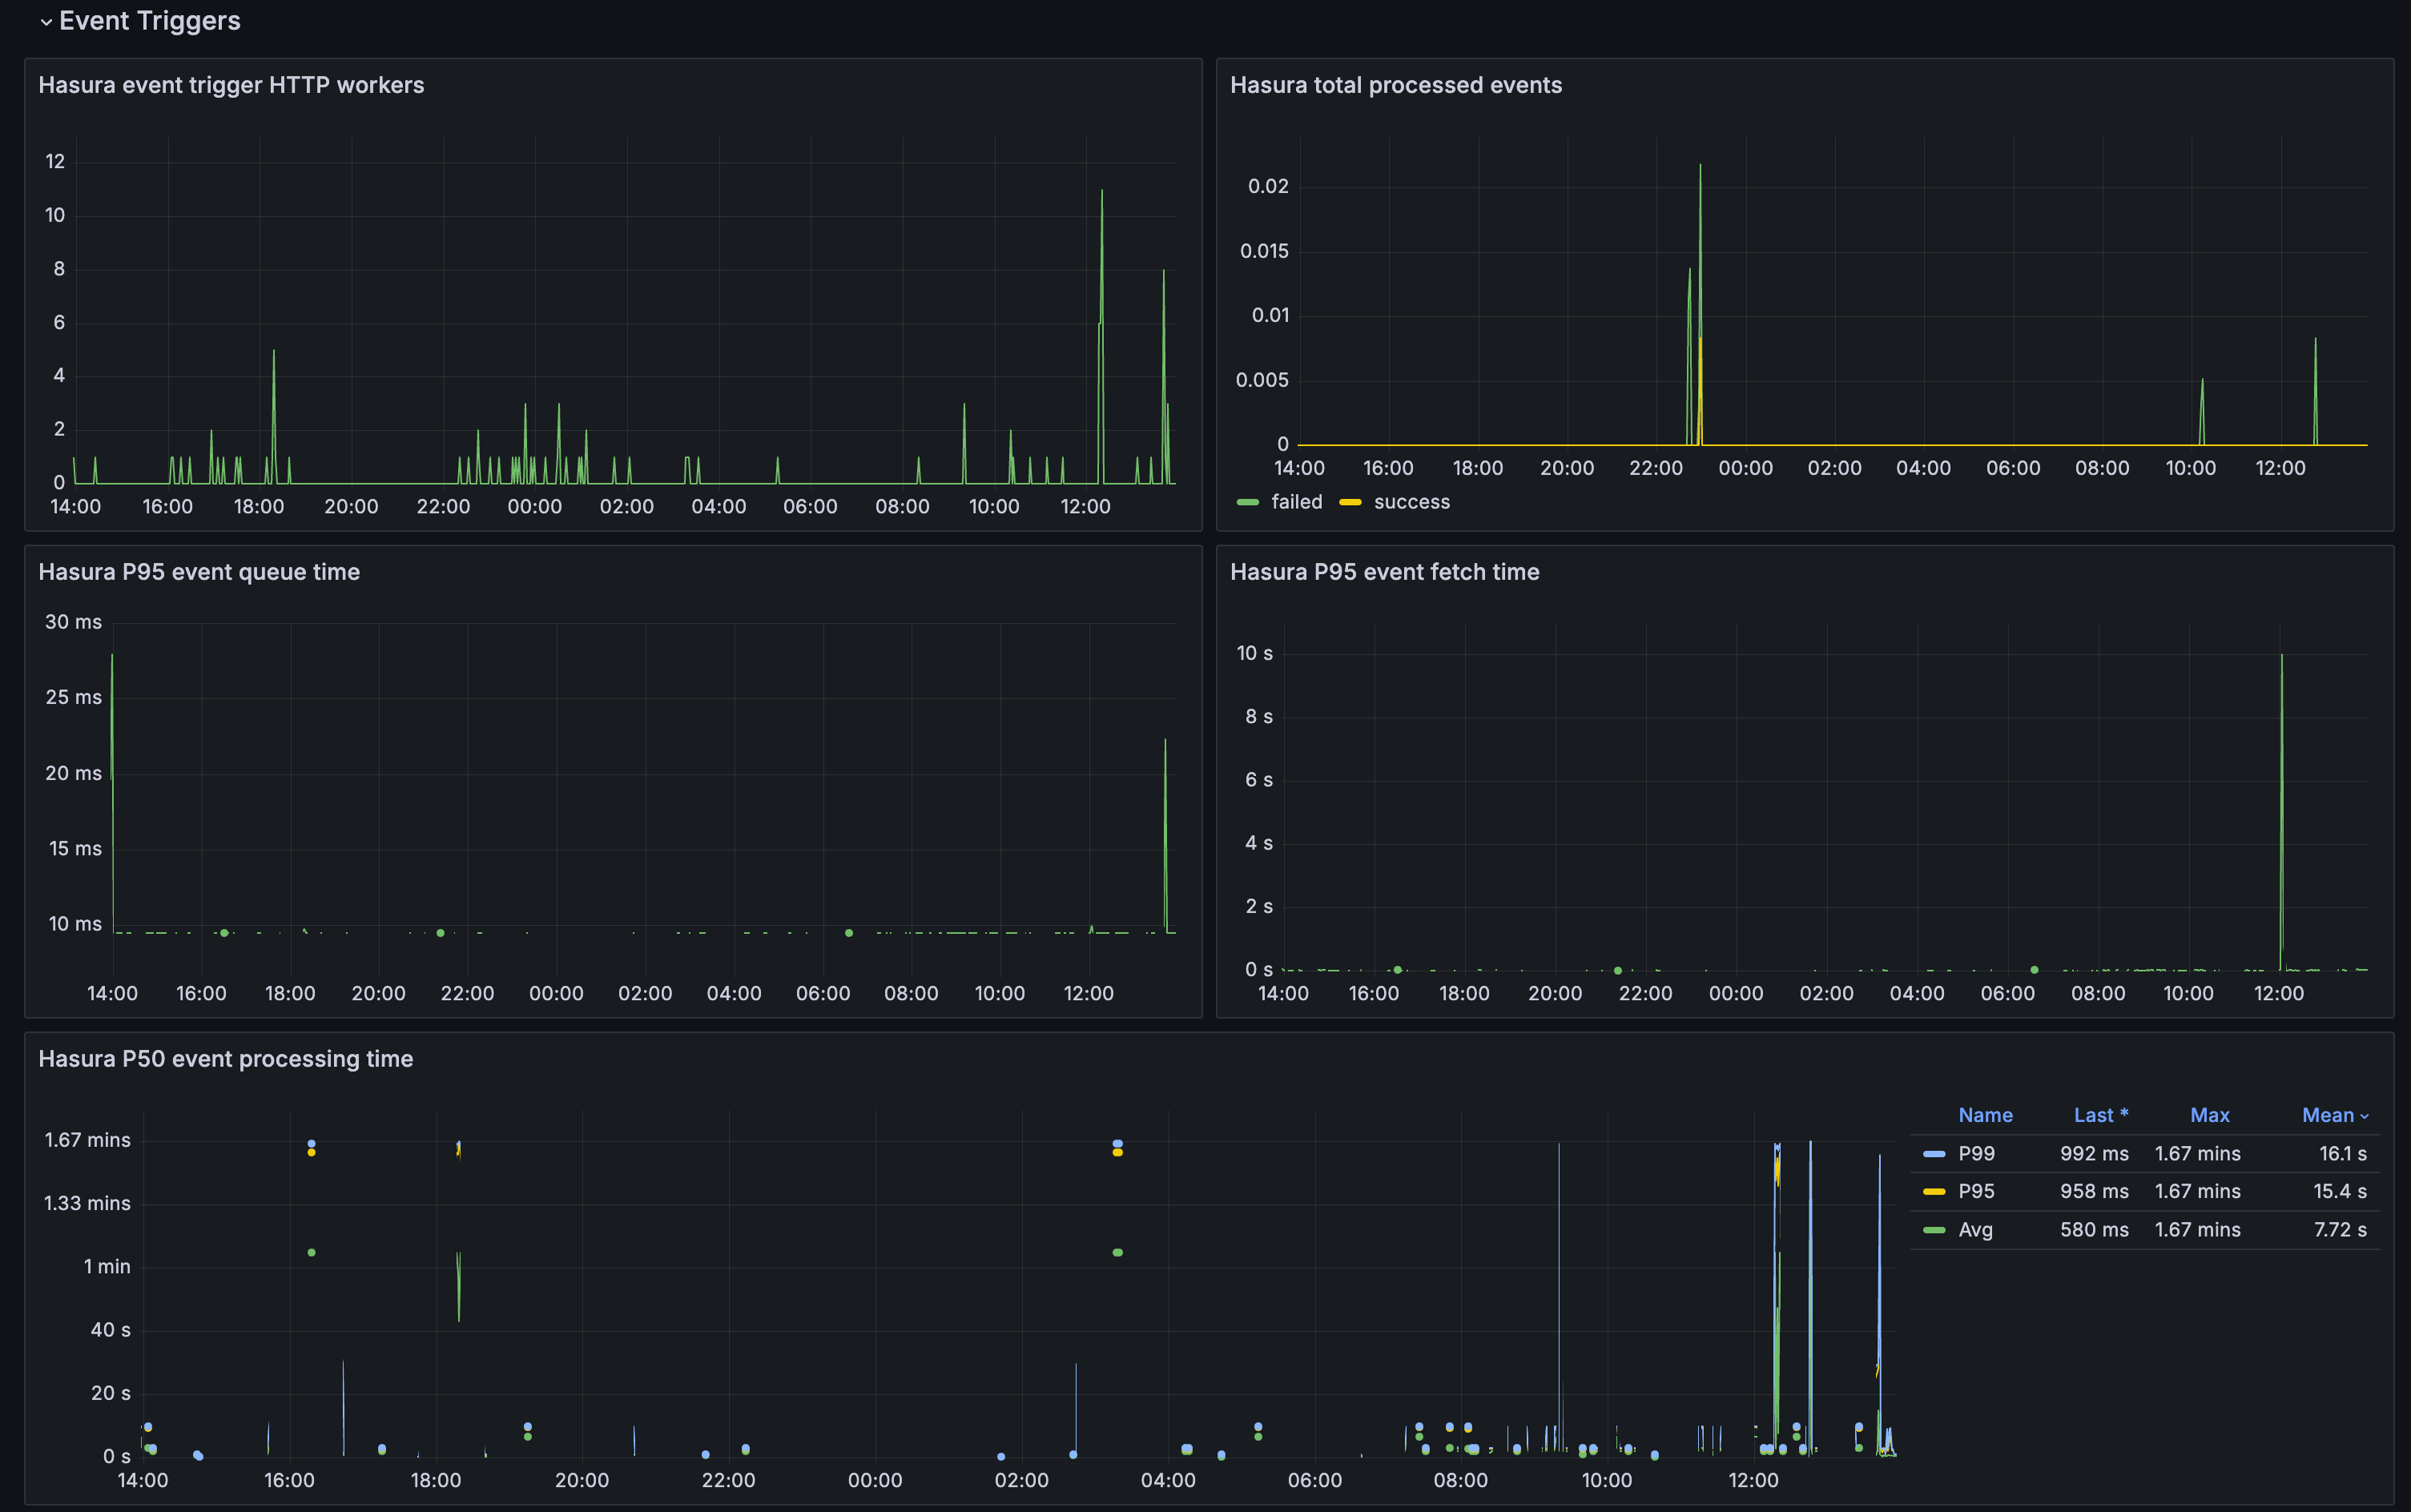
Event trigger Metrics: Displays the performance metrics of the event triggers, including the number of event trigger http workers, events processing rate, latency, etc.
Future enhancements
This monitoring feature is in beta, and we are continuously working on expanding its capabilities. Stay tuned for updates!
Let us know if you’d like any adjustments or additional details.