Azure Monitor Integration on Hasura Cloud
Introduction
Hasura Cloud observability integrations are deprecated in favour of using OpenTelemetry exporter to get advanced traces, metrics and logs.
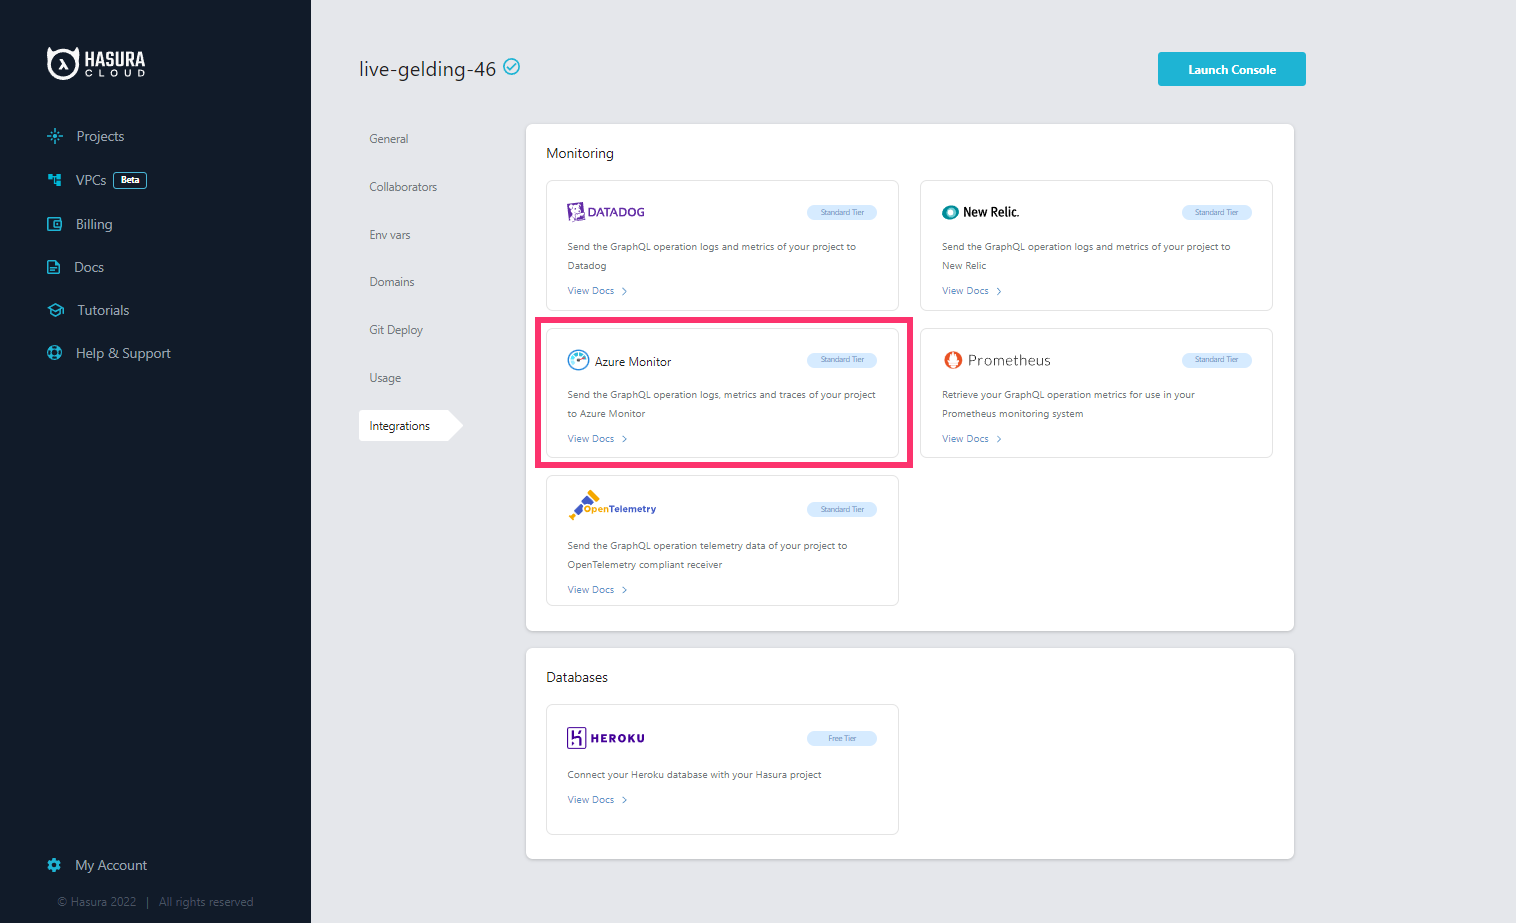
You can export metrics, operation logs and traces of your Hasura Cloud project to Azure Monitor. This can be configured on the integrations tab on the project's setting page.
For Hasura Cloud projects, the Azure Monitor Integration is only available on the Standard (pay-as-you-go) tier and
above.
Pre-requisites
Create a Service Principal in Azure.
From the
Overviewtab of the created Service principal, retrieveApplication (client) ID(Referred asActive Directory Client IDin this context) andDirectory (tenant) ID(Referred asActive Directory Tenant IDin this context)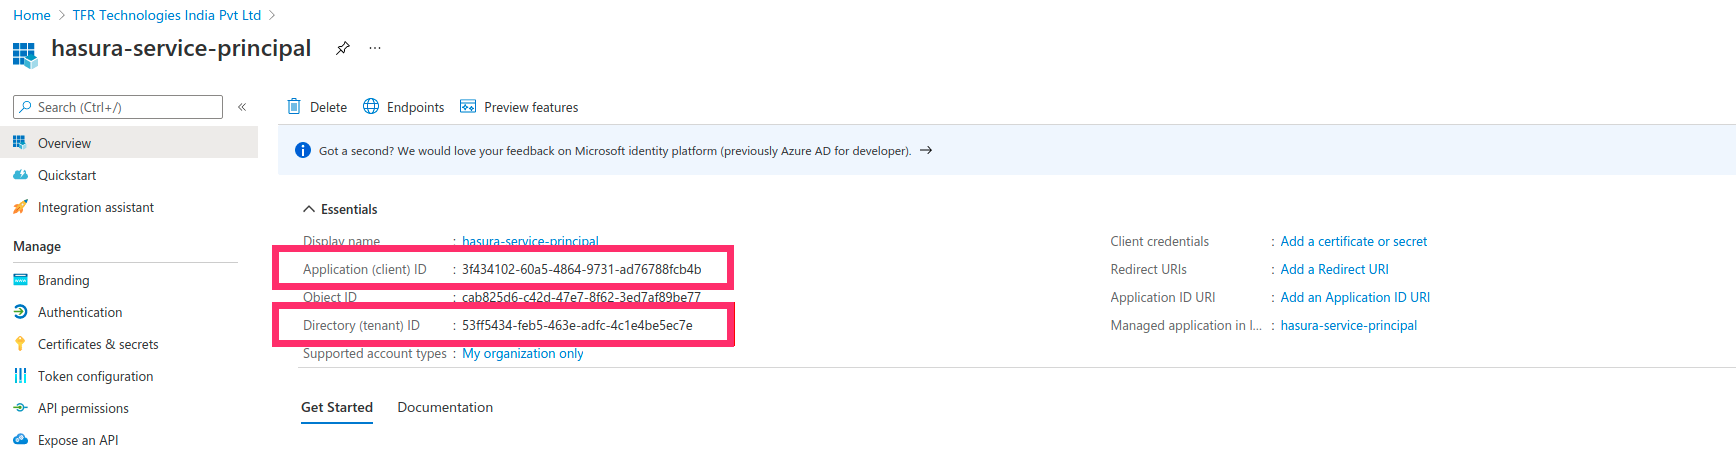
From the
Certificates & secretstab of the created service principal, Create a client secret by clickingNew client secret. Add a suitable description and expiry period for the secret and clickAdd. Copy the value of the created secret (Referred to asActive Directory Client Secretin this context)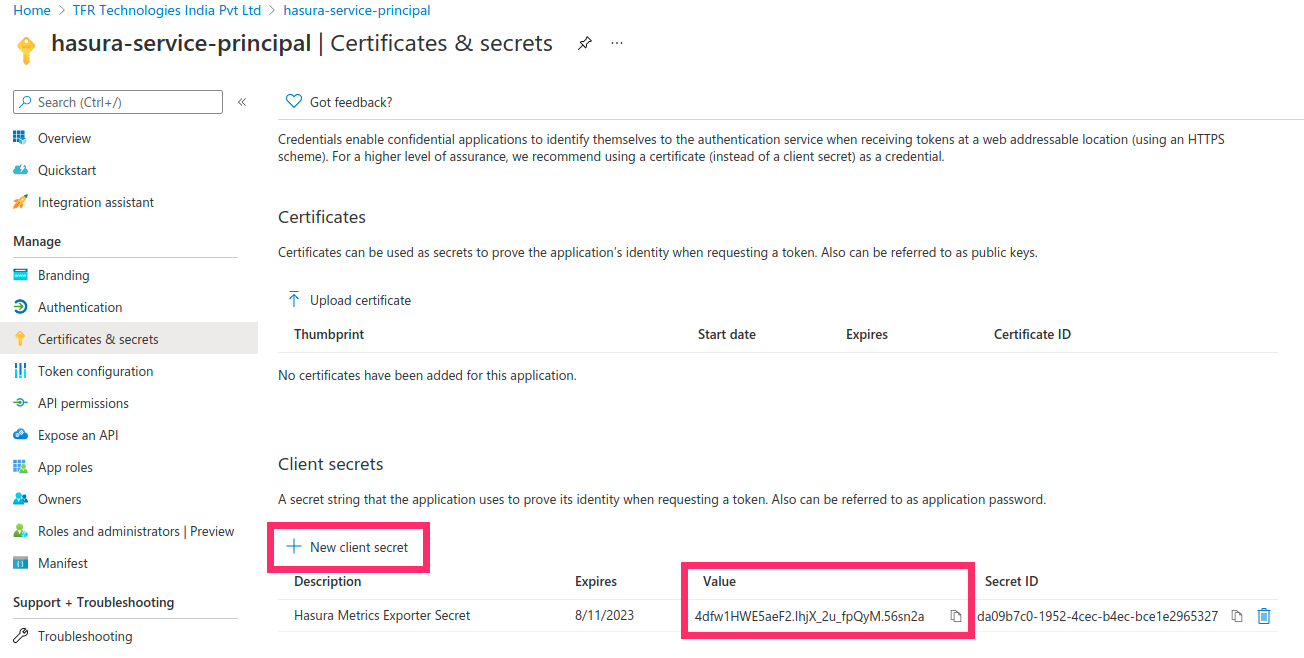
Create a Log Analytics Workspace in Azure.
From the
Agents managementtab of the created log analytics workspace, retrieveWorkspace IDandPrimary Key(Referred asShared Keyin this context).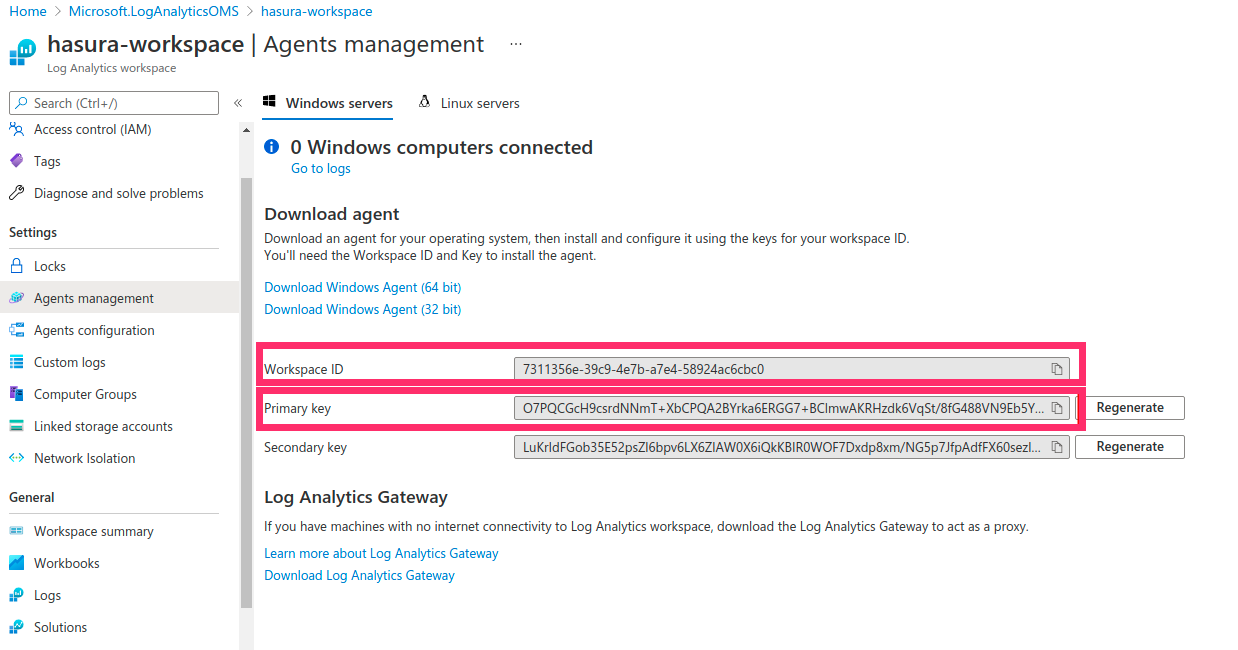
From the
Propertiestab of the created log analytics workspace, retrieveResource IDandLocation(Referred to asRegionin this context)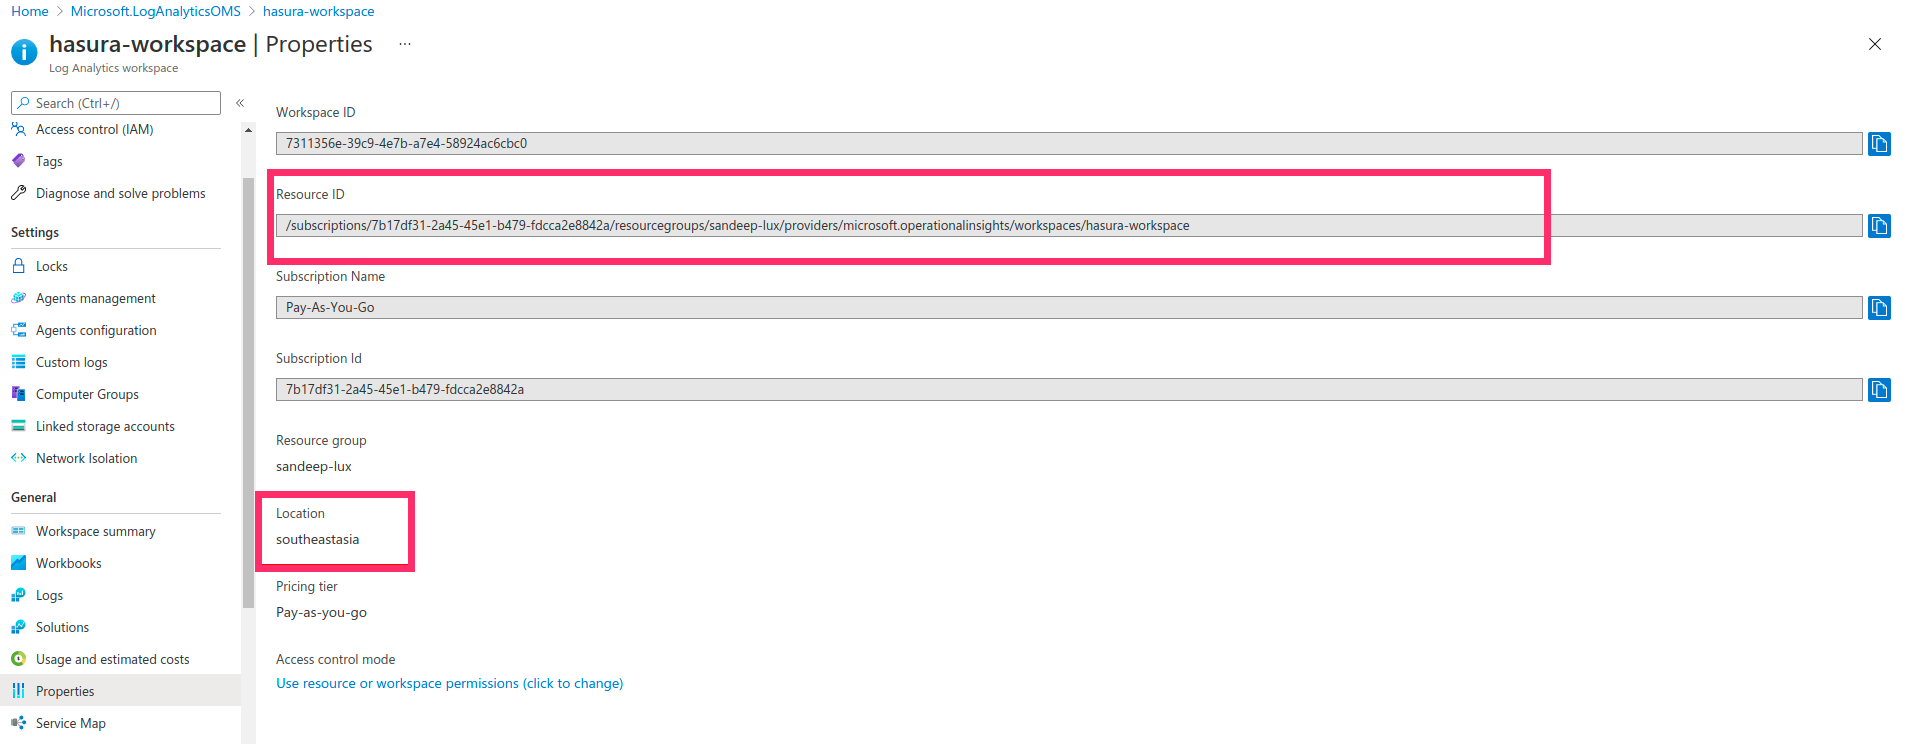
Assign the Role
Monitoring Metrics Publisherto the Service principal against the Log analytics workspace. From theAccess control (IAM)tab of the created log analytics workspace, Click onAddand selectAdd role assignment. In the Add role assignment panel, Select the Role asMonitoring Metrics Publisherand select the created service principal for role assignment and clickSave.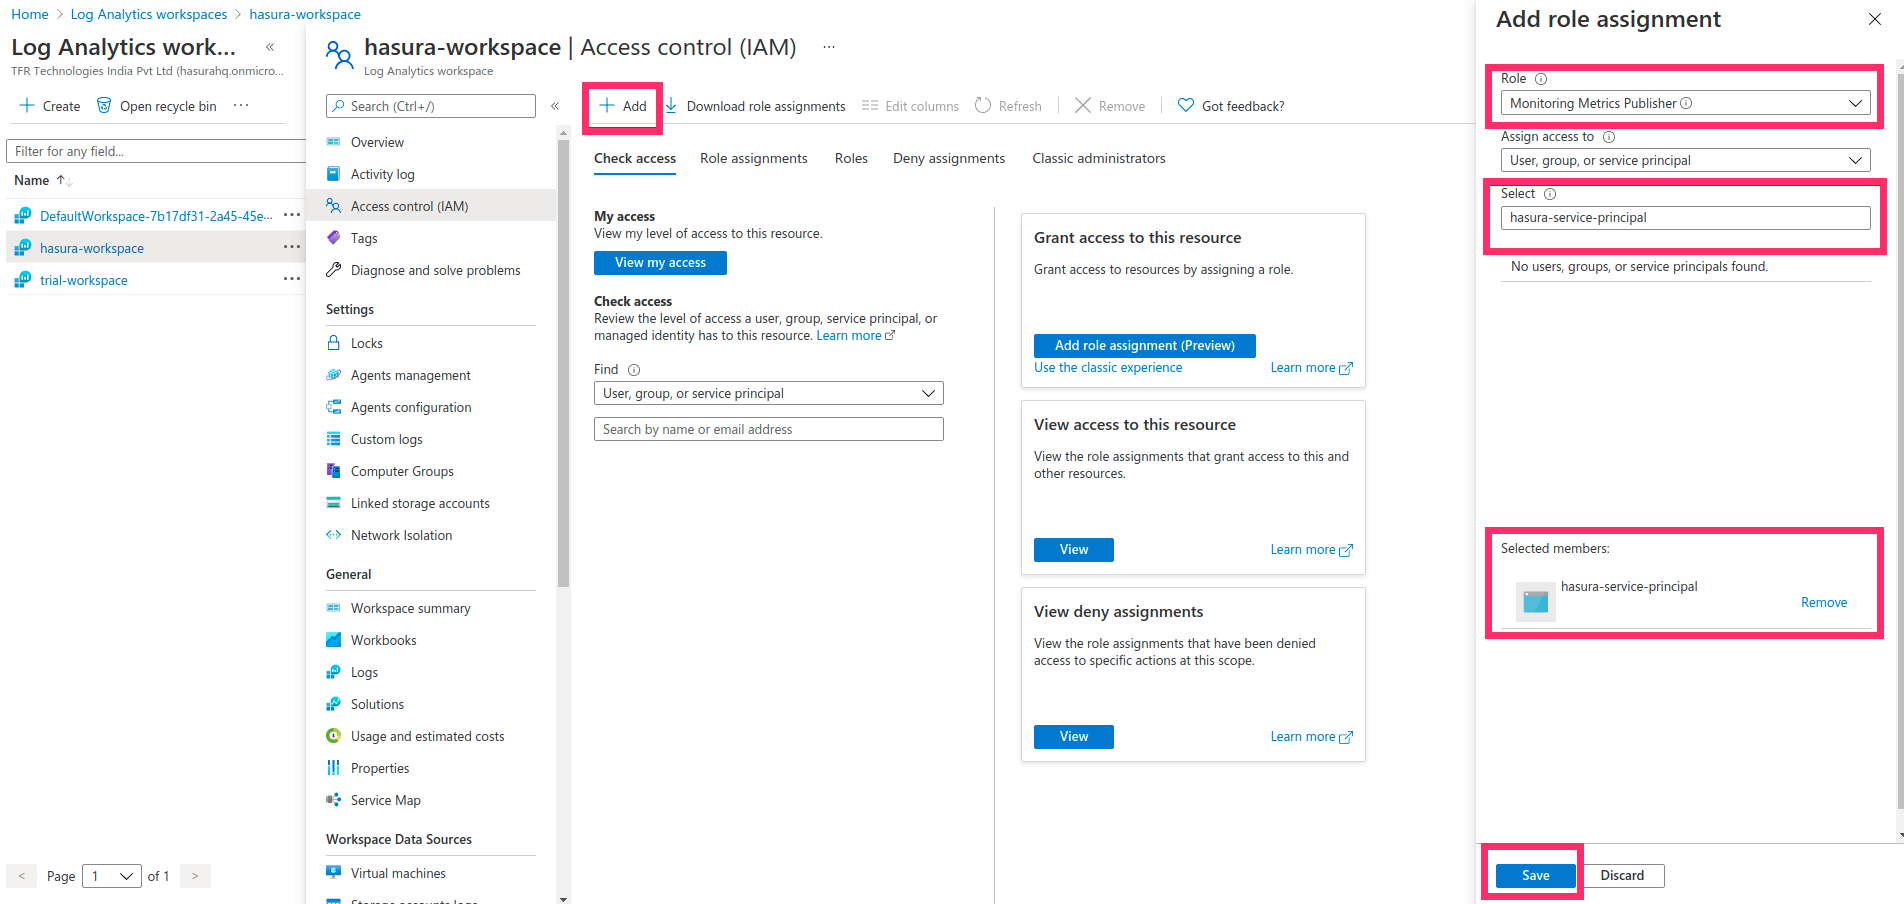
Create an Application Insights resource in Azure.
From the
Overviewtab of the created Application Insights resource, retrieveInstrumentation Key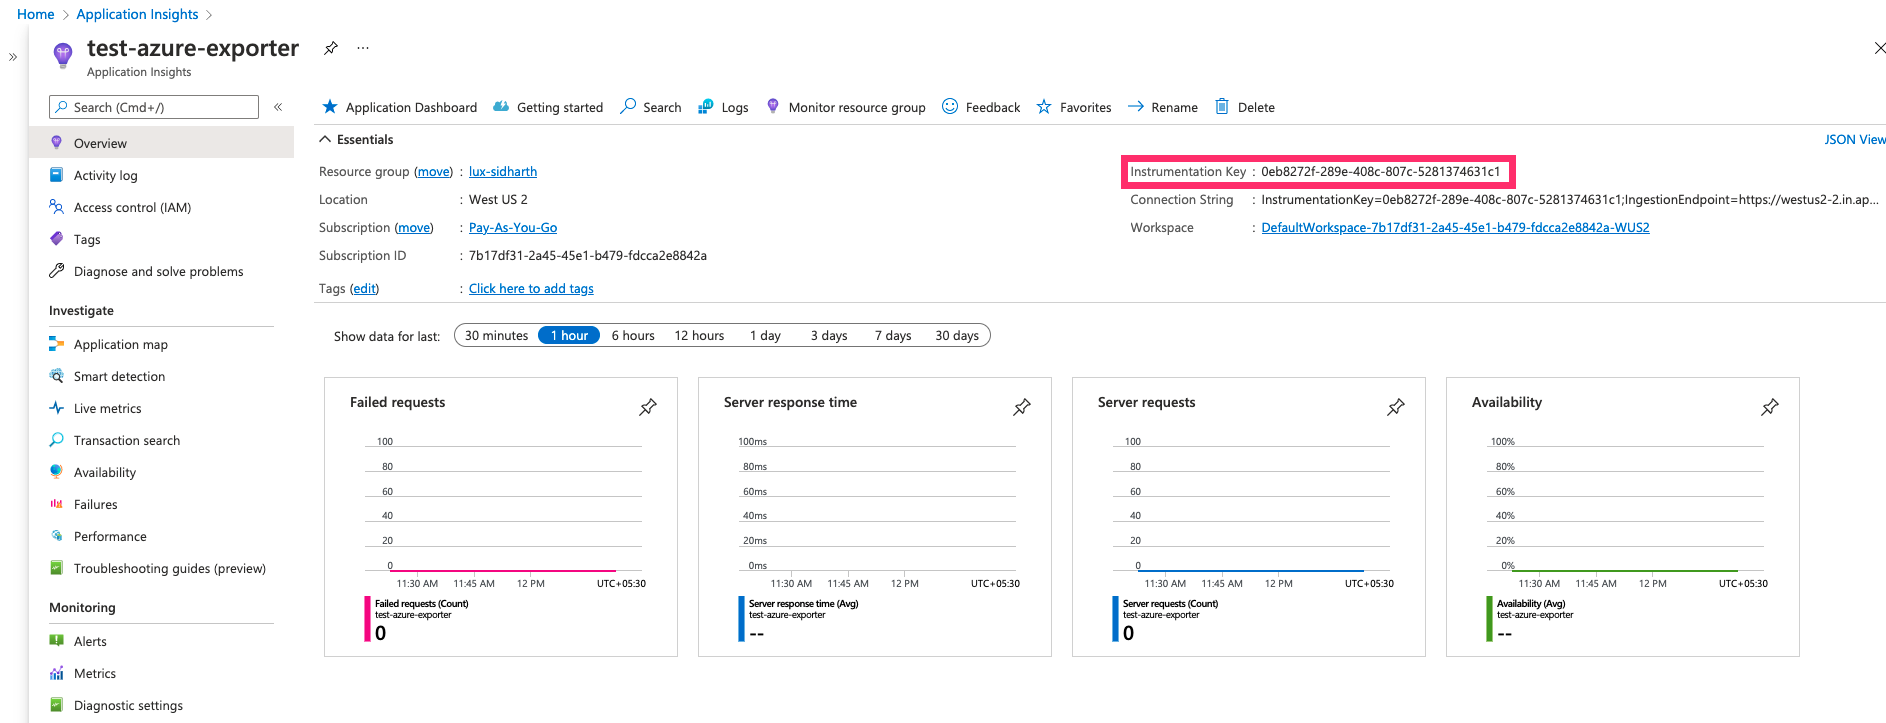
Configure Azure Monitor integration
On the Project settings page, navigate to Integrations > Azure Monitor.
Enter the values of config parameters obtained from the steps in pre-requisites in the Azure monitor integration form. In addition to the above parameters, the following fields are also needed:
| Field | Description |
|---|---|
| Namespace | Namespaces are a way to categorize or group similar metrics together. |
| Log type | The record type of the log that is being submitted. It can contain only letters, numbers, and the underscore (_) character, and it can't exceed 100 characters. |
| Custom Attributes (Optional) | Custom Attributes associated with your logs. A default source tag hasura-logs is added to all exported logs. |
After adding appropriate values in the Azure monitor Integration panel, click Connect Integration.
Checking the status of the integration
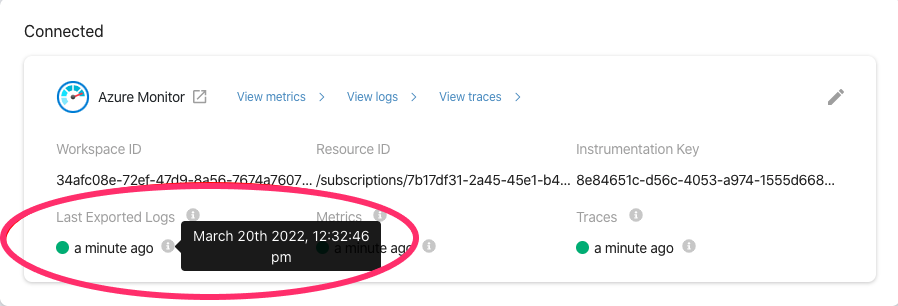
The green/red dot signifies the status of the integration. For each of the telemetry types (logs, metrics, traces) green
signifies successful exporting of the telemetry to Azure monitor. Last Exported is continuously updated, indicating
the timestamp of the last telemetry (log, metric, trace) successfully exported to your Azure monitor dashboard.
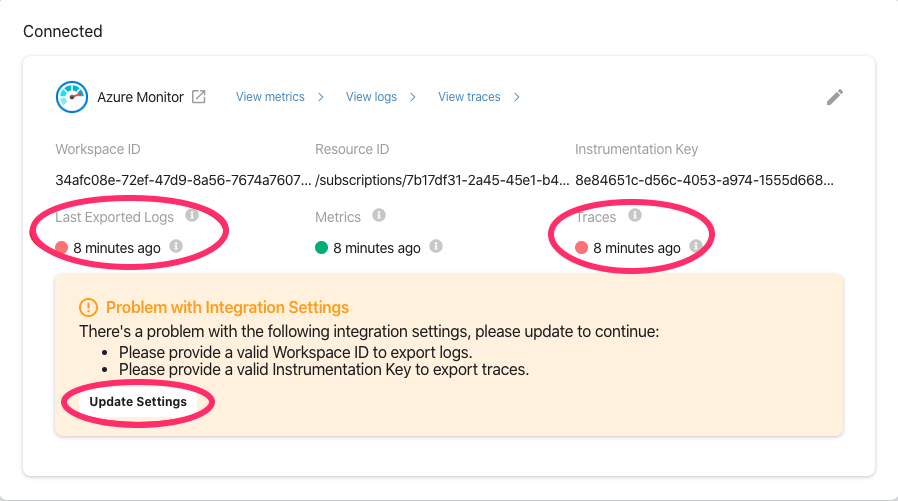
In case of error while exporting any of telemetries(logs, metrics, traces) to Azure monitor, the dot becomes red and the
error messages/instructions are displayed. Click Update Settings button to update the config parameters.
View metrics
The integration exports the following five metrics to Azure monitor:
| Metric Exported | Metric Name in Azure monitor |
|---|---|
| Average number of requests | average_requests_per_minute |
| Average request execution time | average_execution_time |
| Success rate of requests | success_rate |
| Active subscriptions | active_subscriptions |
| Number of websockets open | websockets_open |
Non-zero values of all the above metrics are exported over a minute time interval.
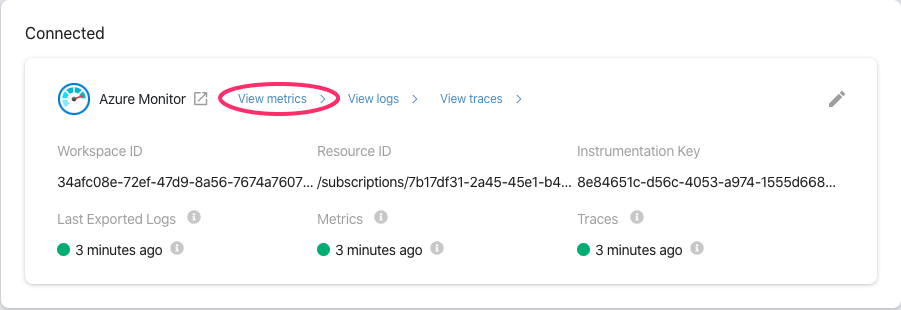
To navigate to
Azure monitor metrics dashboard
,click View Metrics.
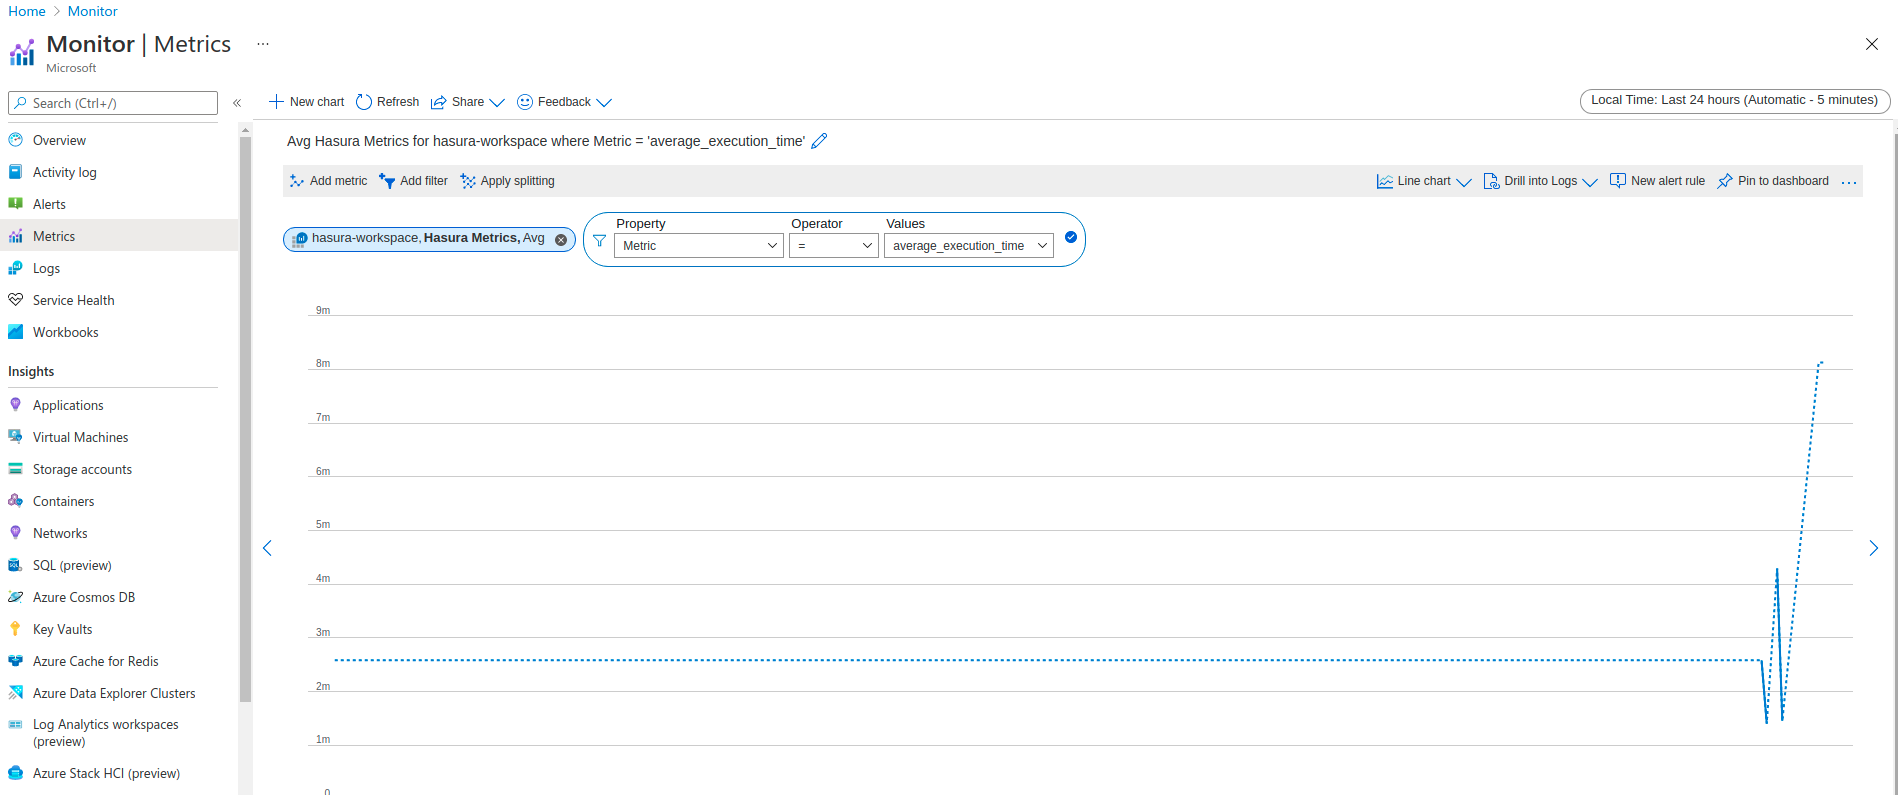
From the Select a scope panel, expand the resource group which contains the Log analytics workspace and select it
and click Apply. In the filter menu, select the correct namespace and Add filter to view the individual metric.
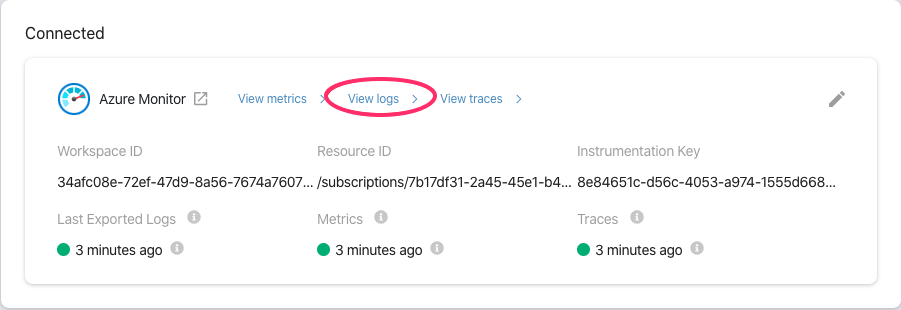
View logs
To navigate to
Azure monitor logs dashboard,
click View Logs.
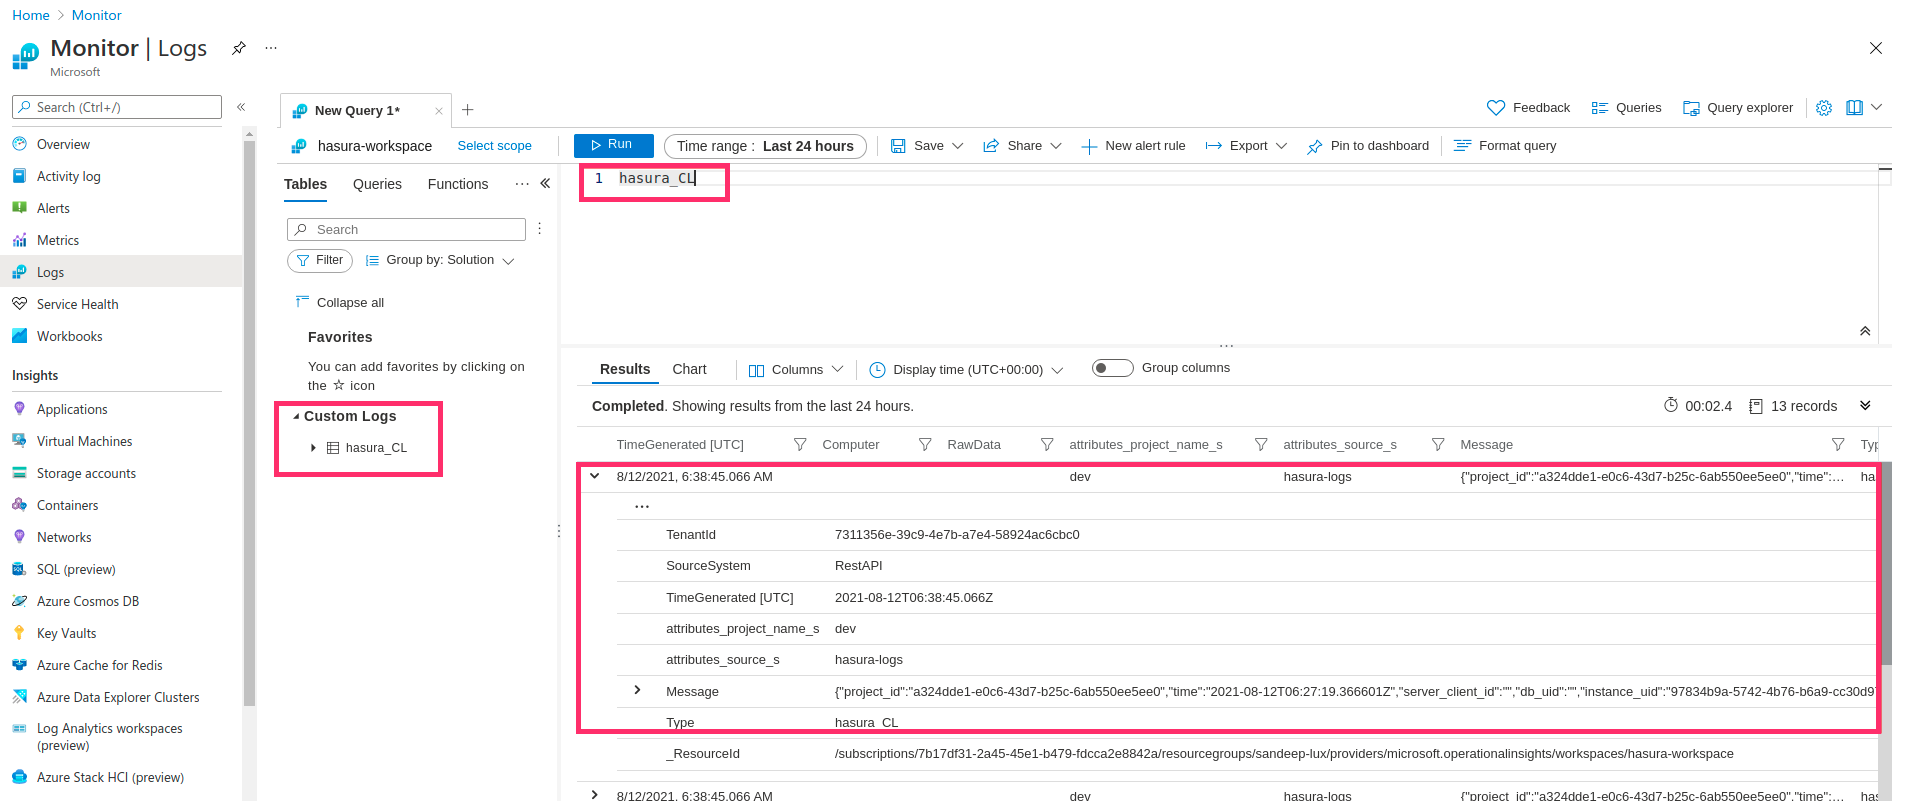
From the Select a scope panel, expand the resource group which contains the Log analytics workspace and select it
and click Apply. The logs can be filtered using Log type. Use {YOUR_LOG_TYPE}_CL search parameter to filter the
logs. Custom log types are displayed in the left of the Query panel.
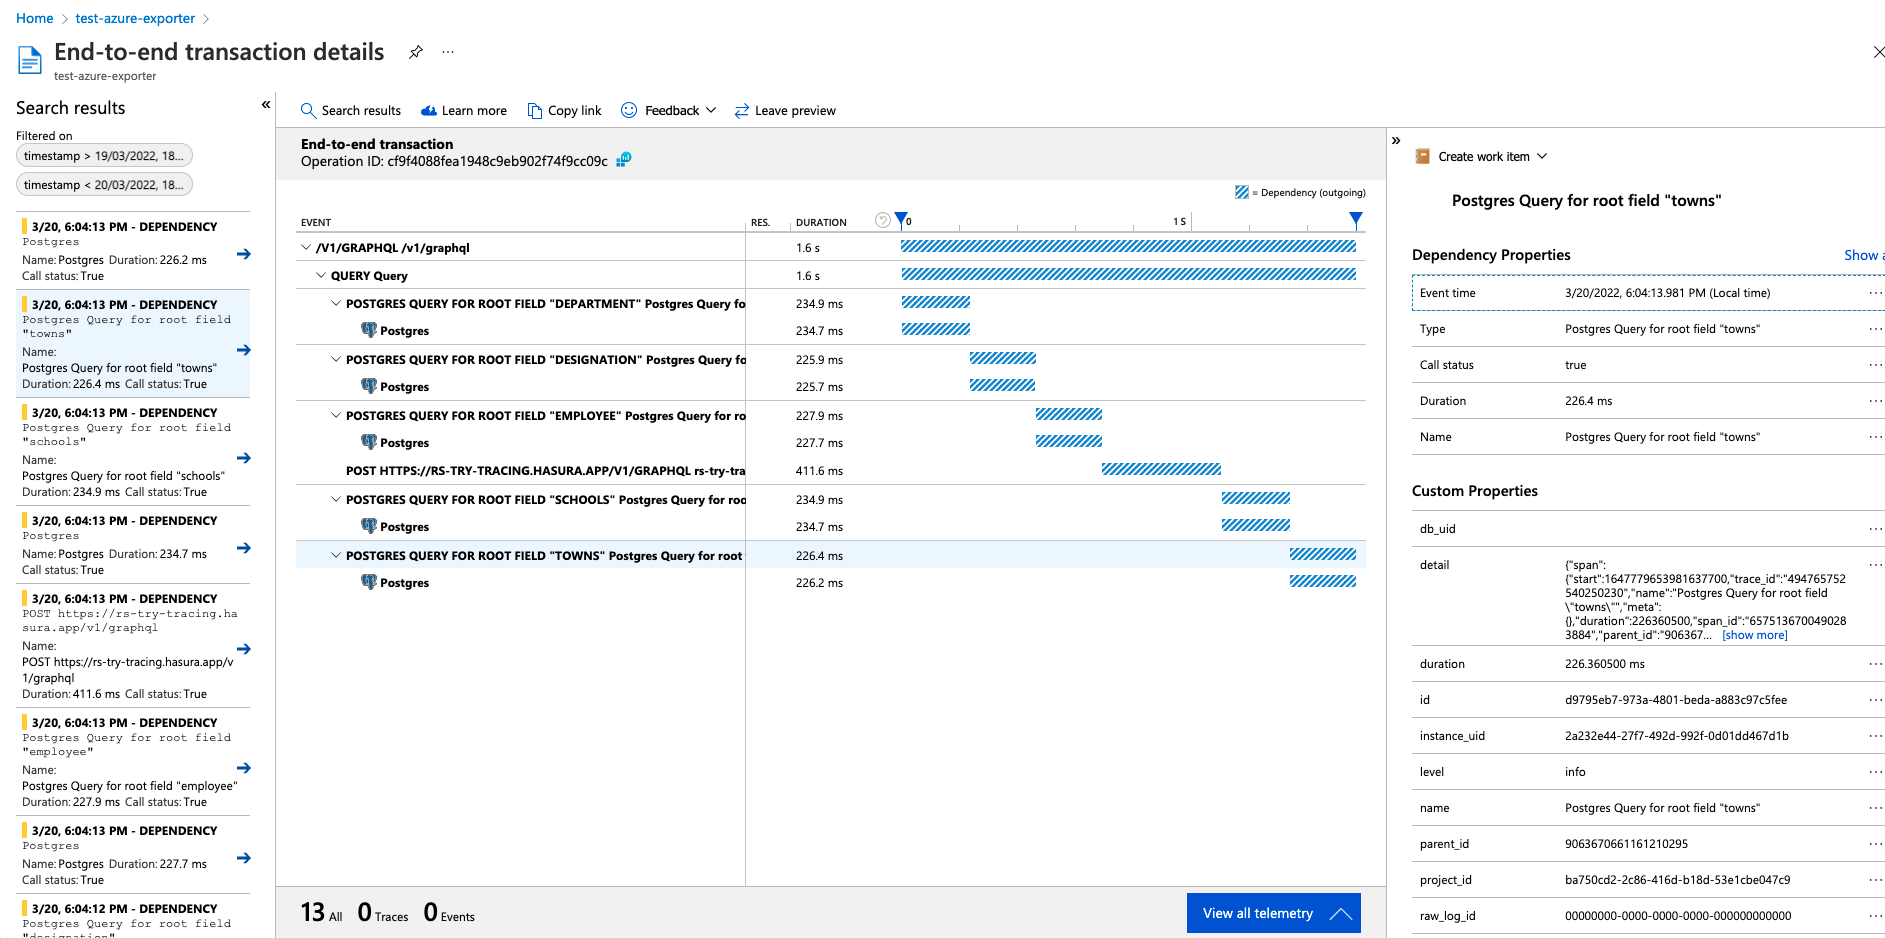
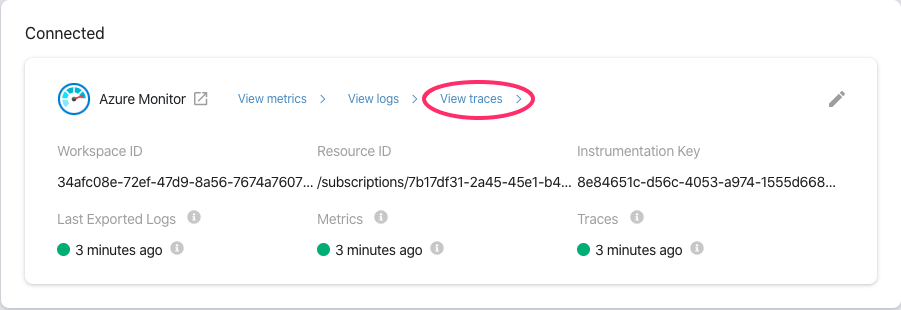
View traces
To navigate to
Azure monitor traces dashboard,
click View traces.
Select the appropriate Application Insights and click Transaction search. The traces can be filtered using Trace
and Dependency Event types. Clicking any of the Dependency result shows the End-to-end transaction details for the
corresponding trace.