Integrate Prometheus with Hasura EE and build a Grafana Dashboard
Introduction
This guide will help you set up a basic observability dashboard for Hasura using Prometheus and Grafana. We have two approaches depending on your use case:
- Self-hosted: If you are running Prometheus and Grafana on your own infrastructure, follow the self-hosted installation instructions.
- Containerized: If you are running Prometheus and Grafana in a containerized environment, follow the containerized installation instructions.
Step 1: Enable metrics endpoint
By default, the Prometheus metrics endpoint is disabled. To enable Prometheus metrics, configure the environment variable below:
HASURA_GRAPHQL_ENABLED_APIS=metadata,graphql,config,metrics
Secure the Prometheus metrics endpoint with a secret:
HASURA_GRAPHQL_METRICS_SECRET=<secret>
curl 'http://127.0.0.1:8080/v1/metrics' -H 'Authorization: Bearer <secret>'
The metrics endpoint should be configured with a secret to prevent misuse and should not be exposed over the internet.
Starting in v2.26.0, Hasura GraphQL Engine exposes metrics with high-cardinality labels by default.
You can disable the cardinality of labels for metrics if you are experiencing high memory usage, which can be due to a large number of labels in the metrics (typically more than 10000).
Option 1: Self-hosted installation
Step 2: Install and configure Prometheus
Step 2.1: Set up the environment
You will need to create a Prometheus user and group, and a directory for Prometheus to store its data. You will also need to create a directory for Prometheus to store its configuration files.
This section is written based on an Ubuntu/Debian installation environment. The following commands will help you prepare your environment:
sudo groupadd -system prometheus
sudo useradd -s /sbin/nologin -system -g prometheus prometheus
sudo mkdir /var/lib/prometheus
for i in rules rules.d files_sd; do sudo mkdir -p /etc/prometheus/${i}; done
Step 2.2: Install Prometheus
The following set of commands will help you download and install Prometheus:
sudo apt update
sudo apt -y install wget curl
mkdir -p /tmp/prometheus && cd /tmp/prometheus
curl -s https://api.github.com/repos/prometheus/prometheus/releases/latest |
grep browser_download_url | grep linux-amd64 | cut -d '"' -f 4 | wget -qi -
tar xvf prometheus*.tar.gz
cd prometheus*/
sudo mv prometheus promtool /usr/local/bin/
You can check to see if Prometheus is installed correctly by running the following command:
prometheus --version
Step 2.3: Connect Prometheus to Hasura
To connect Prometheus to Hasura, you will need to create a configuration file for Prometheus. The following commands will help you do this:
sudo cp -rpf prometheus.yml /etc/prometheus/prometheus.yml sudo mv consoles/ console_libraries/ /etc/prometheus/
Then, you'll need to edit the Prometheus configuration file (/etc/prometheus/prometheus.yml) to include the changes
listed below:
# my global config
global:
  scrape_interval: 15s
  evaluation_interval: 15s

# scrape_timeout is set to the global default (10s).

# Alertmanager configuration
alerting:
  alertmanagers:
    - static_configs:
        - targets:
            # - alertmanager:9093

# Load rules once and periodically evaluate them according to the global ’evaluation_interval ’.
rule_files:
  # - "first_rules.yml"
  # - "second_rules.yml"

# A scrape configuration containing exactly one endpoint to scrape:
# Here it’s Prometheus itself.
scrape_configs:
  # The job name is added as a label ‘job=<job_name>‘ to any timeseries scraped from this config.
  - job_name: 'prometheus'
    # metrics_path defaults to ’/metrics ’
    # scheme defaults to ’http ’.
    static_configs:
      - targets: ['localhost:9090']
  - job_name: 'graphQL'
    metrics_path: 'v1/metrics'
    # metrics_path defaults to ’/metrics ’
    # scheme defaults to ’http ’.
    static_configs:
      - targets: ['hasura_deployment_url:8080']
Step 2.4: Set firewall rules
If you are using a firewall, you will need to set the following rules:
sudo ufw allow 9090/tcp
Step 2.5: Set up a password for Prometheus web access
To set up a password for Prometheus web access, you will need to create a hashed password. First, we'll create the YAML
file which will store the password. Inside /etc/prometheus/, run the following:
sudo touch web.yml
Then, we'll install bcrypt:
sudo apt install python3-bcrypt -y
Then, we'll create a hashed password via a Python script called genpass.py which we can store anywhere:
import getpass
import bcrypt

password = getpass.getpass("password: ")
hashed_password = bcrypt.hashpw(password.encode("utf-8"), bcrypt.gensalt())
print(hashed_password.decode())
You can then run the script, using the command below, and enter your password when prompted:
python3 gen-pass.py
The output will be a hashed password. Copy this password and paste it into the web.yml file, as shown below:
basic_auth_users:
  admin: ’your new hashed value ’
To check yourself, use promtool to check the configuration file:
promtool check web-config /etc/prometheus/web.yml
Step 2.6: Restart Prometheus
To restart Prometheus, run the following command:
sudo systemctl restart prometheus
Then, test the password by running:
curl -u admin:<YOUR_PASSWORD> http://localhost:9090/metrics
You should see a response similar to the one below:
# HELP go_gc_duration_seconds A summary of the GC invocation durations.
# TYPE go_gc_duration_seconds summary
go_gc_duration_seconds{quantile="0"} 0
go_gc_duration_seconds{quantile="0.25"} 0
# etc...
Step 3: Install and configure Grafana
Step 3.1: Install Grafana
You can install Grafana by running the following commands:
wget -q -O - https://packages.grafana.com/gpg.key | sudo apt-key add -
sudo add-apt-repository "deb https://packages.grafana.com/oss/deb stable main" sudo apt update
sudo apt install grafana
sudo systemctl start grafana-server
sudo systemctl enable grafana-server
At this point, your Grafana server should be available at http://<YOUR_IP_ADDRESS>:3000 where you'll find the login
screen. The default username and password are both admin.
After logging in, you will be prompted to change the default password. Set your new password and login.
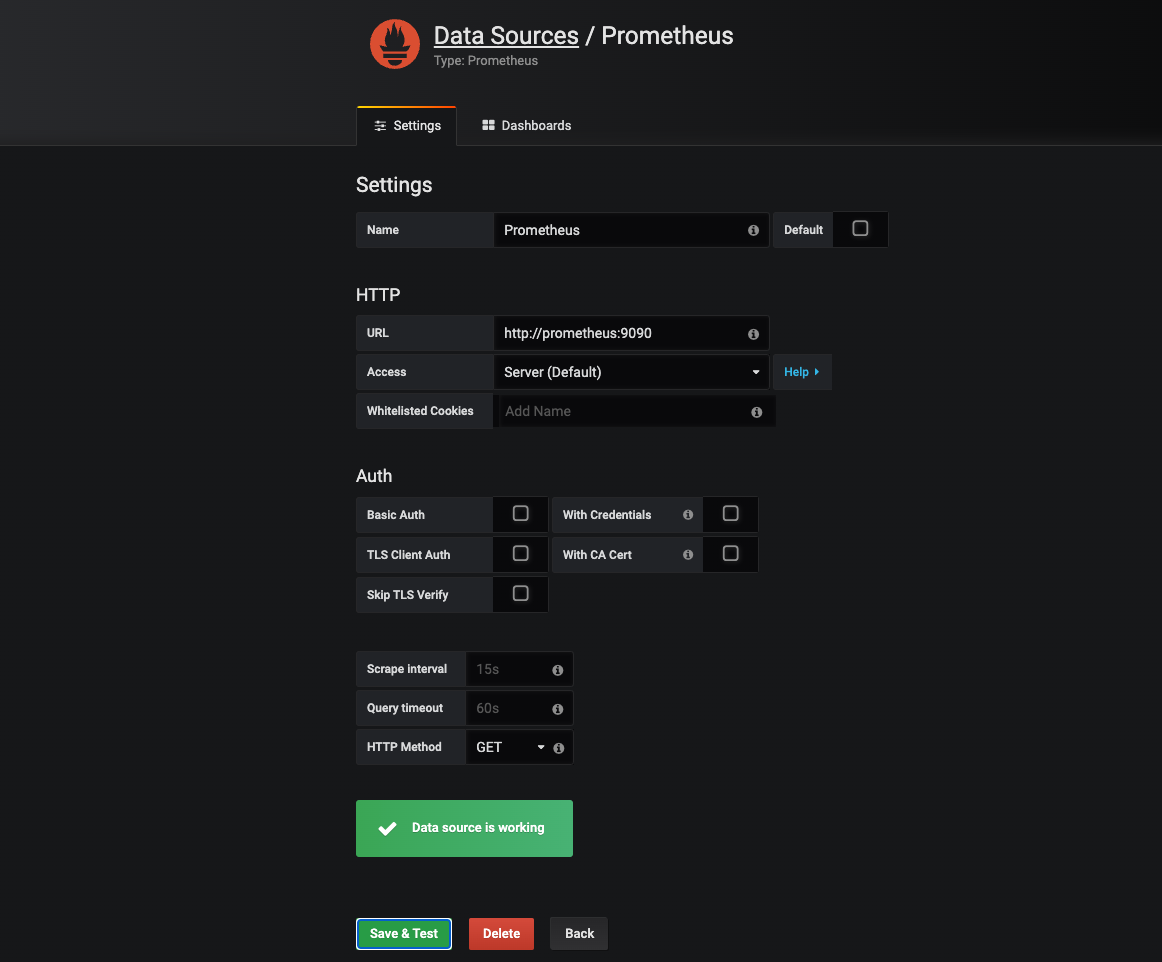
Step 3.2: Create a Prometheus data source
In Grafana, from the settings icon on the sidebar, open the Configuration menu and select Data Sources. Then, click
on Add data source and select Prometheus as the type.
Then, set the appropriate URL for your Prometheus server (e.g., http://localhost:9090) and click Save & Test. If
everything is working correctly, you should see a green Data source is working message.
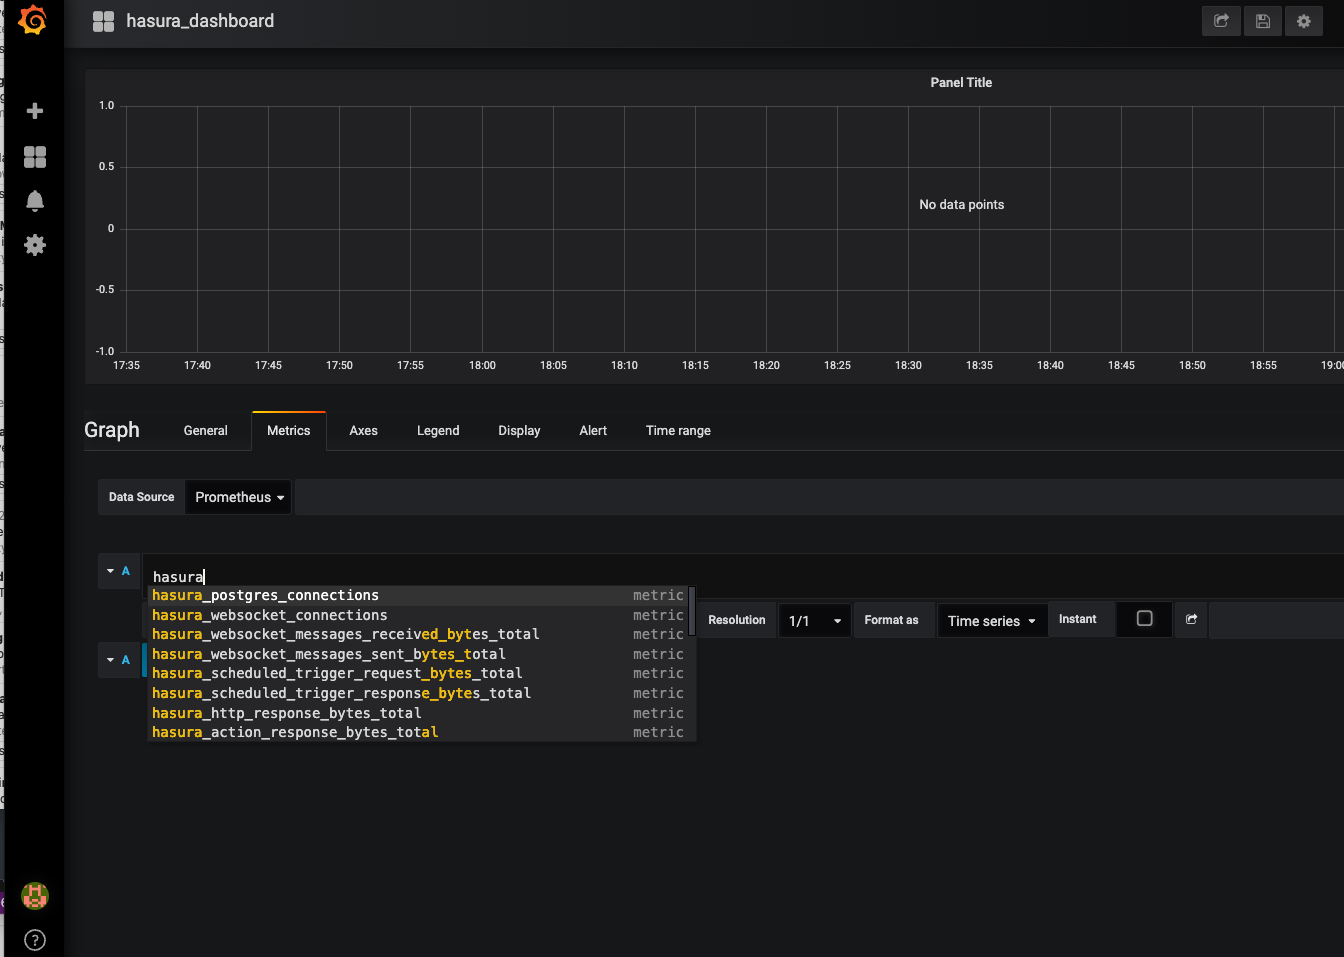
Step 3.3: Create a Prometheus graph
Click the graph title and select Edit. Then, select the Metrics tab and select your Prometheus data source. Then,
enter any Prometheus expression ino the Query field while using the Metric field to lookup metrics via autocomplete.
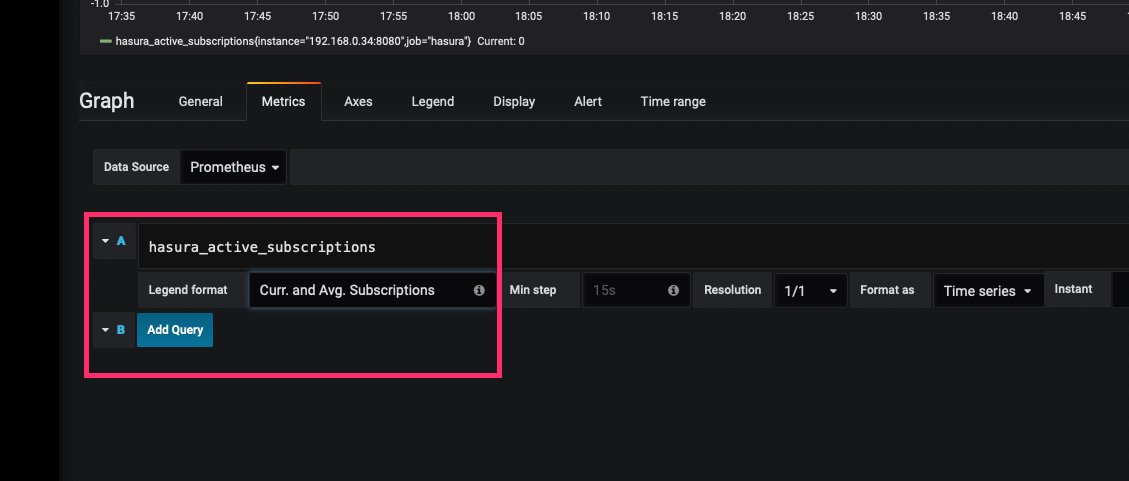
To format the legend names of time series, use the "Legend format" input. For example, to show only the method and
status labels of a returned query result, separated by a dash, you could use the legend format string
{{method}} - {{status}}.
Option 2: Containerized installation
Step 2: Install and configure Prometheus and Grafana
Step 2.1: Prepare the Prometheus configuration file
Create a file named prometheus.yml on your host with the following information:
# my global config
global:
  scrape_interval: 15s # Set the scrape interval to every 15 seconds. Default is every 1 minute.
  evaluation_interval: 15s # Evaluate rules every 15 seconds. The default is every 1 minute.
  # scrape_timeout is set to the global default (10s).

# Alertmanager configuration
alerting:
  alertmanagers:
    - static_configs:
        - targets:
          # - alertmanager:9093

# Load rules once and periodically evaluate them according to the global ’evaluation_interval ’.
rule_files:
  # - "first_rules.yml"
  # - "second_rules.yml"

# A scrape configuration containing exactly one endpoint to scrape:
# Here it’s Prometheus itself.
scrape_configs:
  - job_name: 'prometheus'
    static_configs:
      - targets: ['localhost:9090']
  - job_name: 'hasura'
    metrics_path: '/v1/metrics'
    static_configs:
      - targets: ['ip_address_of_hasura_installation:8080']
Step 2.2: Pull the Prometheus and Grafana Docker containers
For Prometheus, run the following command:
docker run -p 9090:9090 -v /path/to/your/local/prometheus.yml:/etc/ prometheus/prometheus.yml prom/prometheus
Then, for Grafana, run the following:
docker run -d -p 3000:3000 grafana/grafana-enterprise
Step 3: Configure Grafana
Step 3.1: Adding a Prometheus as a data source in Grafana
In Grafana, from the settings icon on the sidebar, open the Configuration menu and select Data Sources. Then, click
on Add data source and select Prometheus as the type.
Then, set the appropriate URL for your Prometheus server (e.g., http://localhost:9090) and click Save & Test. If
everything is working correctly, you should see a green Alerting supported message.
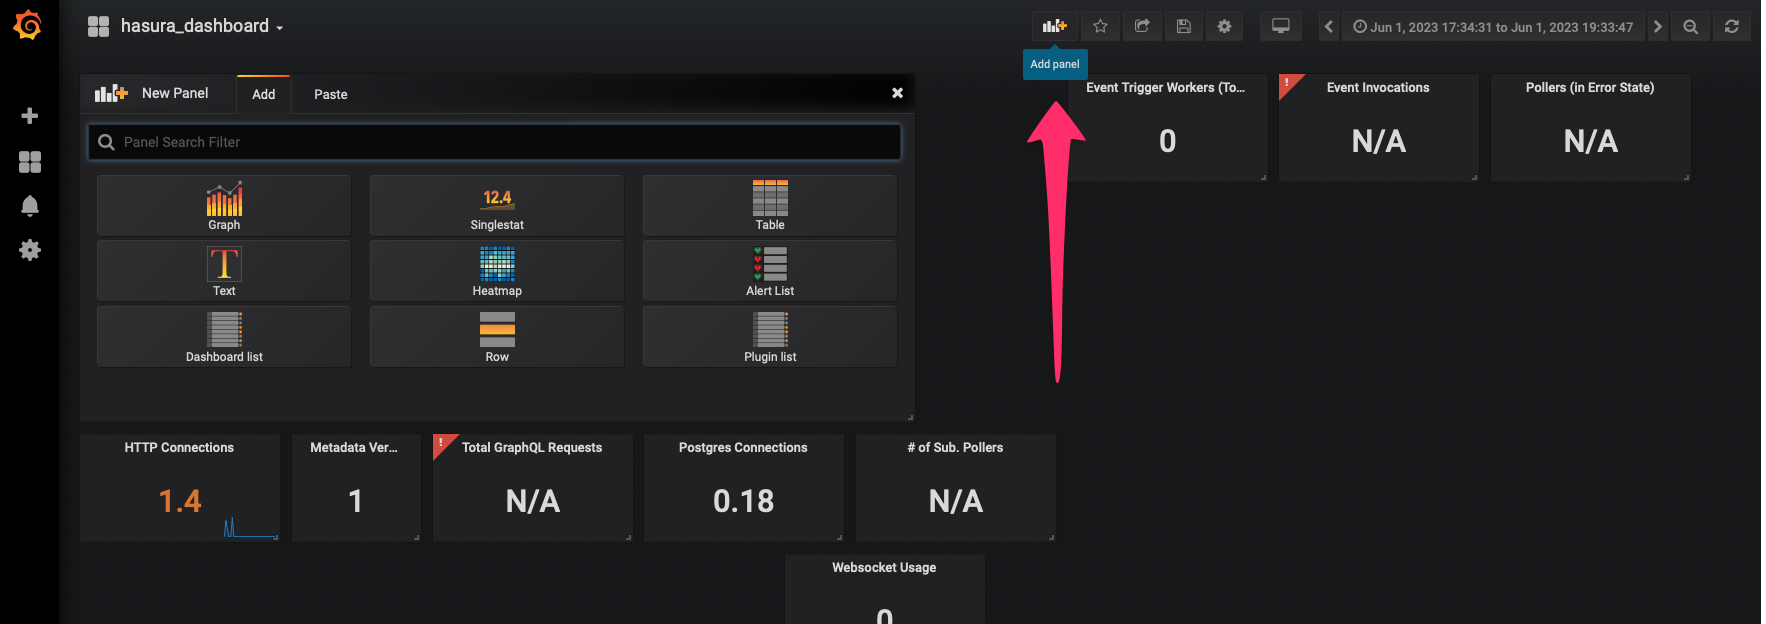
Step 3.2: Add Hasura metrics to the dashboard
Click on the Add Panel icon in the top-right corner of the Grafana dashboard. Then, select Add New Panel or
Add New Row.
Click on the Metric section and start typing, hasura — you should see a list of available Hasura metrics. Select the
metric you want to add to the dashboard.