Interact with your Supergraph
Overview
Interacting with your API should be a straightforward task, yet it often turns into a complex and frustrating process. Developers frequently find themselves switching between multiple tools to test queries, add headers, and trace requests. This fragmented approach not only slows down the workflow but also leads to inefficiencies in debugging. Without integrated tracing, identifying and resolving issues becomes time-consuming.
Moreover, the lack of real-time feedback means that any changes to the API or queries require manual verification, further slowing down development. Recognizing these pain points, Hasura DDN offers a comprehensive solution through its GraphiQL explorer, designed to simplify and accelerate the API interaction process.
With Hasura DDN, you can use our GraphiQL explorer to create and test queries directly within the console, providing:
- Schema Definition: See the entire GraphQL schema and documentation for all available queries and mutations.
- Integrated Query Testing: Test queries with headers and see real-time results, all in one place.
- Built-in Tracing: Instantly trace queries to identify performance bottlenecks and optimize efficiently.
- Streamlined Workflow: Save time and reduce context-switching by having everything you need in a single interface.
You can also use the console to visualize and monitor your API.
Step 1. Test your supergraph API
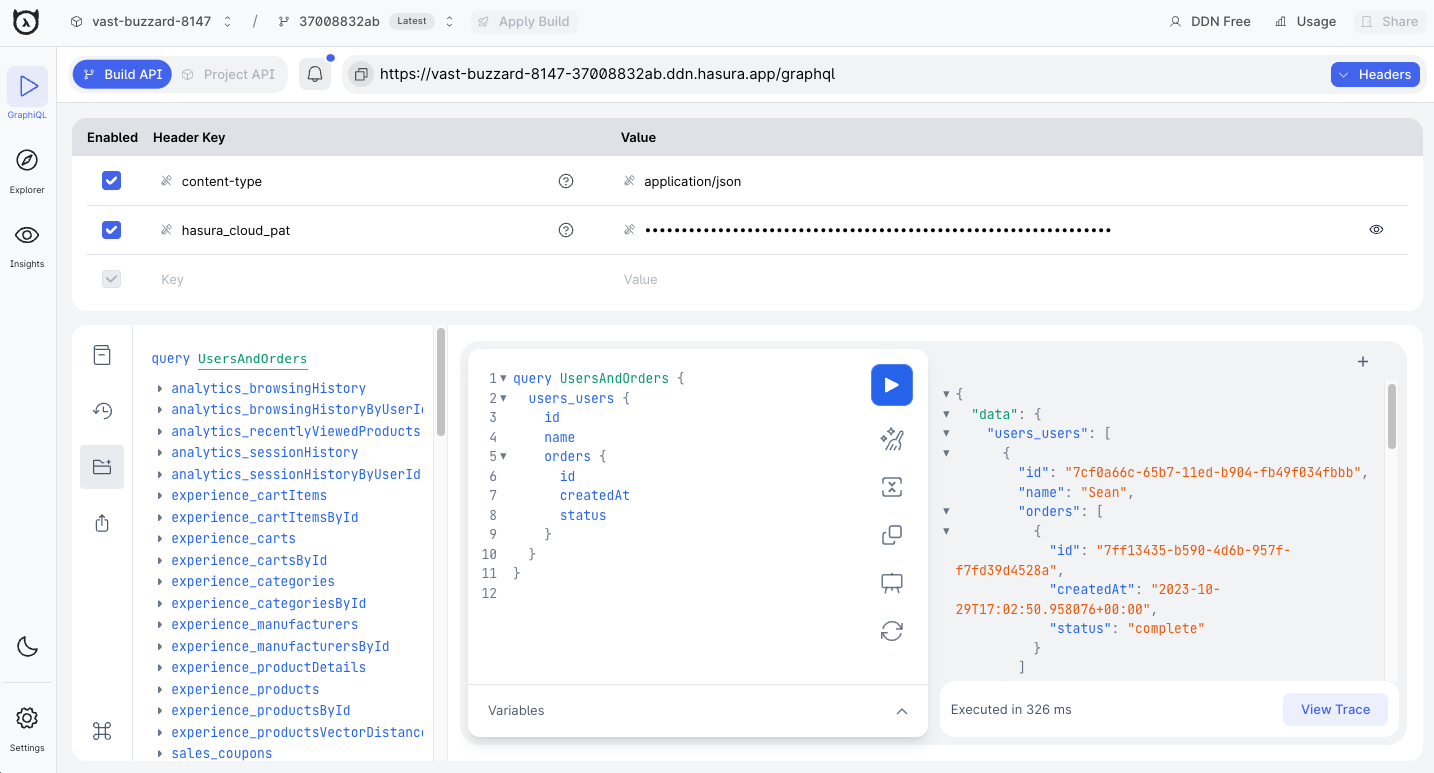
Start by making a query to test your supergraph API. Here’s a sample query you can use with our sample e-commerce application:
query UsersAndOrders {
  users_users {
    id
    name
    orders {
      id
      createdAt
      status
    }
  }
}

Use the request section on the left-hand side of the GraphiQL component to write your queries. If you're unsure what
to type next, press CTRL + SPACE to see available options. Add variables for dynamic queries using the Variables
section below the query. The response will appear on the right-hand side.
Automatically, Hasura DDN provides you with queries for unique, many, aggregation, and filtering!
Step 2. View query traces
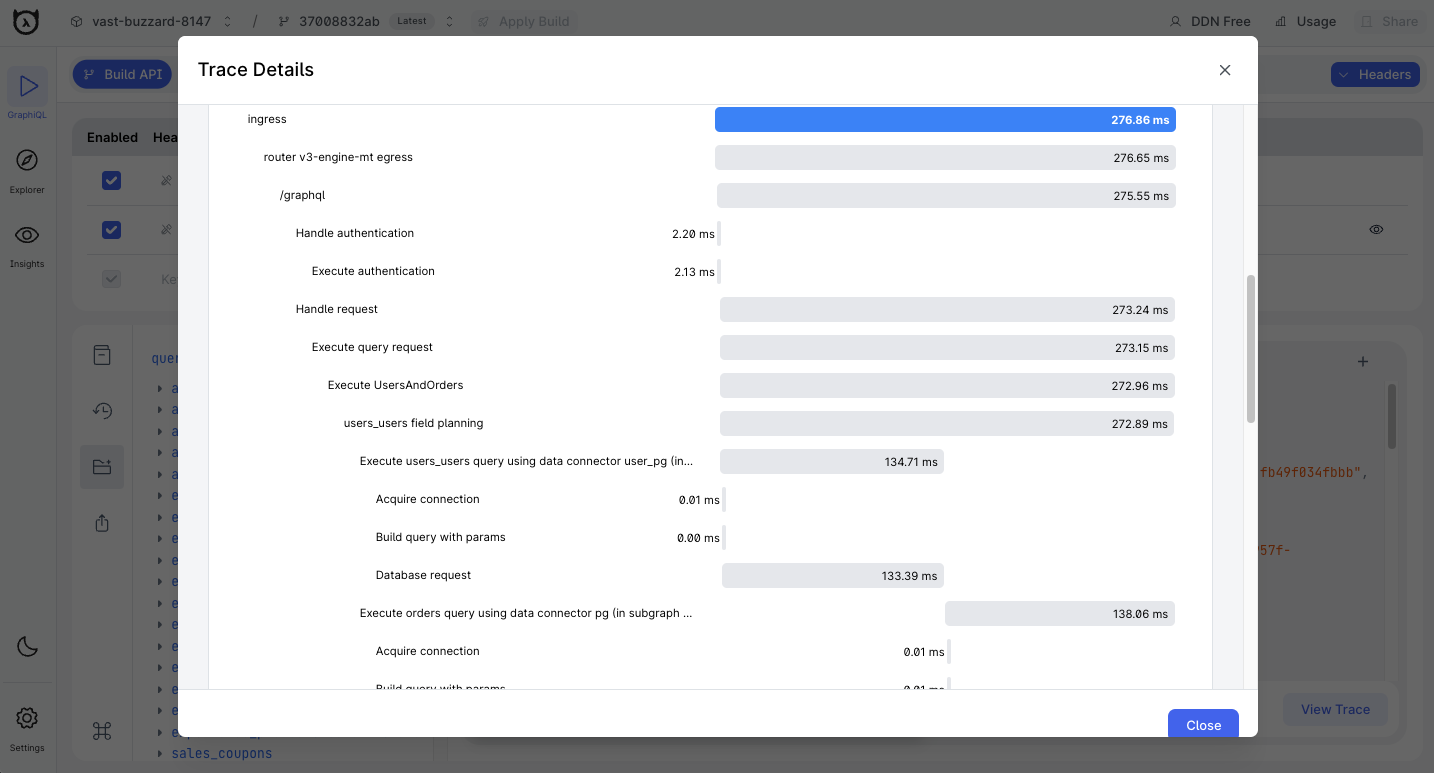
After testing your query, click the View Trace button in the bottom-right corner of the GraphiQL explorer to view the
trace. You'll see details like query execution steps, topology, and execution plan.

Step 3. Explore API schema and documentation
Navigate to the Schema tab to view your API's schema definition. Each query is prefixed by the subgraph's name and can
be clicked to generate a test query. Click the book icon to explore detailed API documentation.
Advanced features
Switch builds
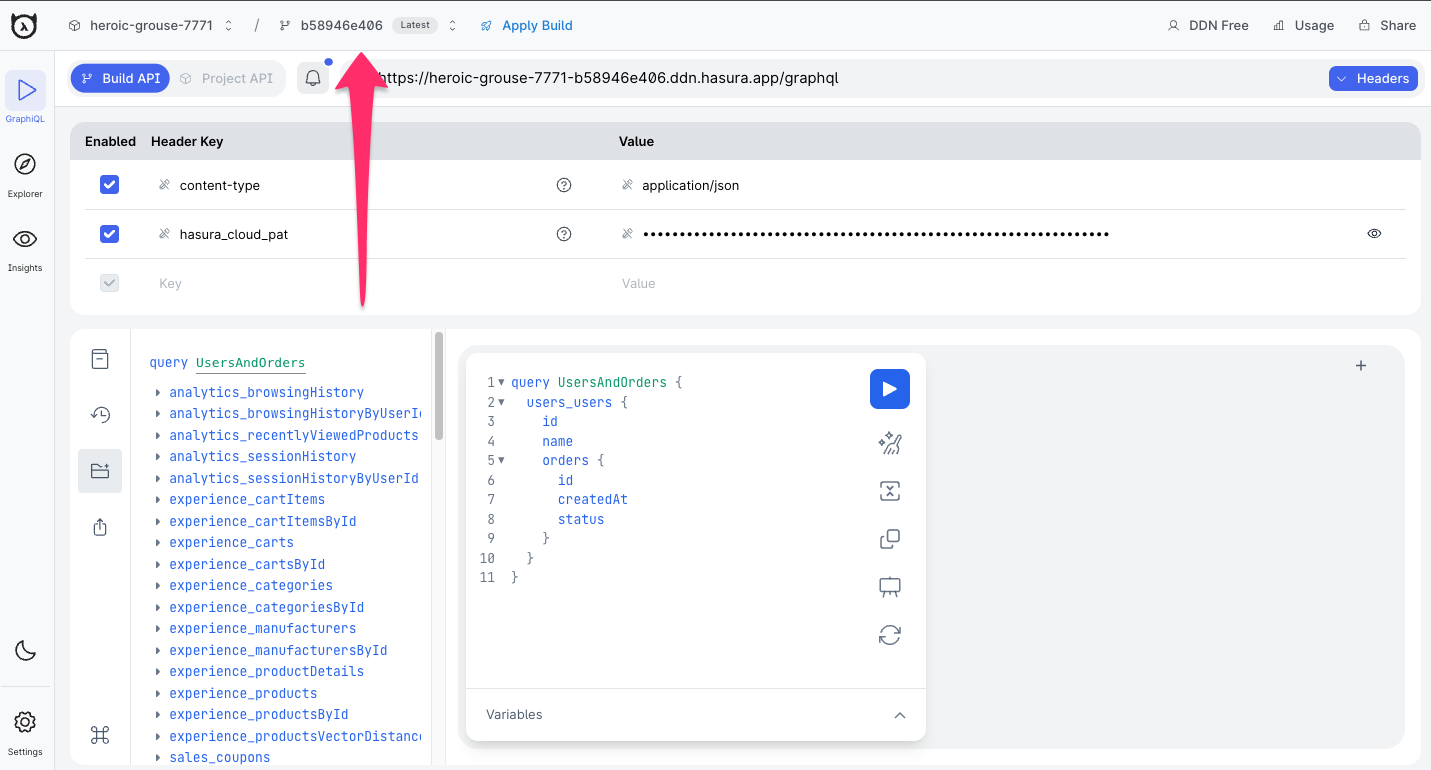
At the top of the GraphiQL page, switch between different builds of your API using the build manager. Hasura DDN's immutable builds system allows you to iteratively create and test your API. Apply a build via the console to serve your API's endpoint.

Add headers
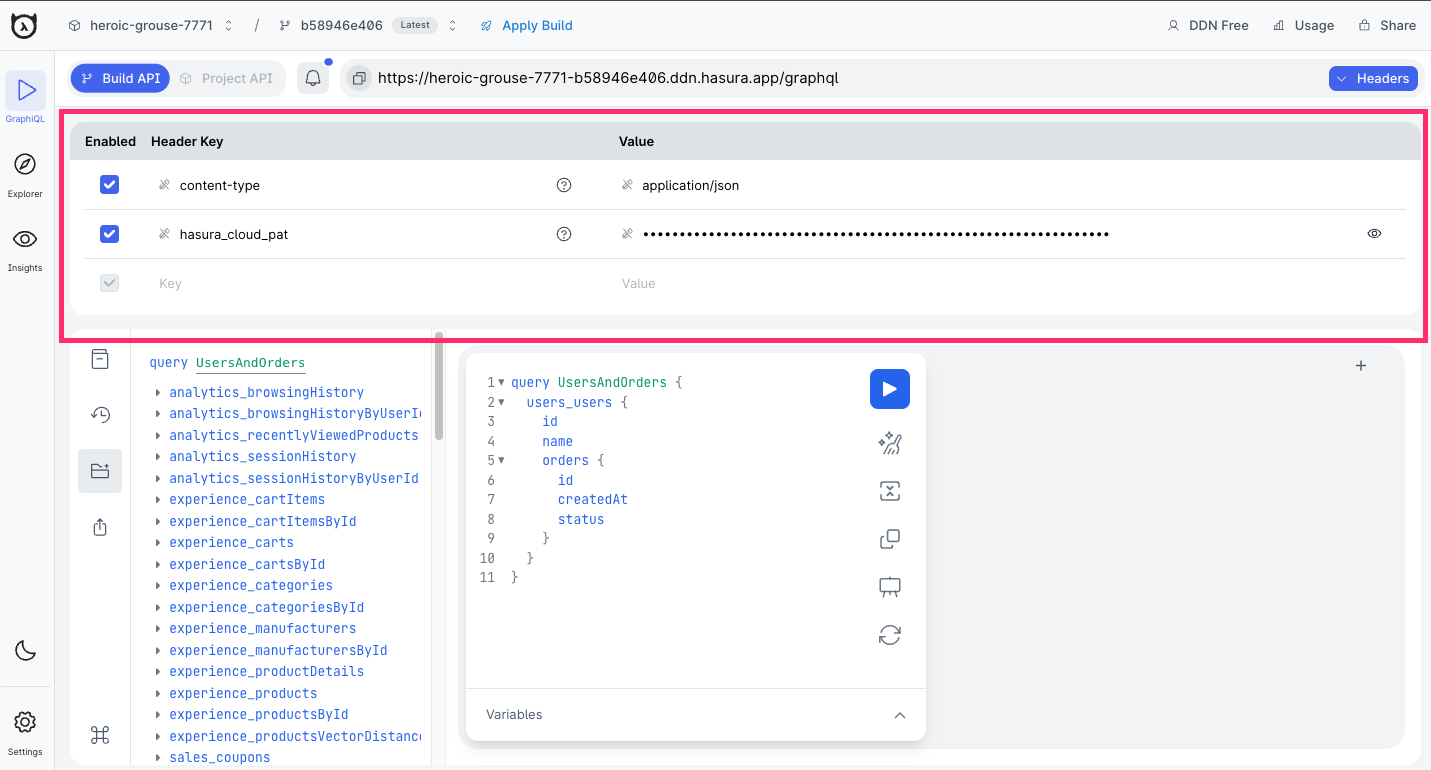
Use the header table below the build manager to add custom headers. By default, content-type and hasura_cloud_pat
are present. Add session variables (e.g., x-hasura-role) or authentication tokens (e.g., Bearer JWT) to test
permissions and relationships.

The API expects content-type to be present. Removing it will return an error.
Next steps
Now that you've tested your API, viewed traces, and explored the schema, learn how to monitor your API's performance.
