Metrics
Introduction
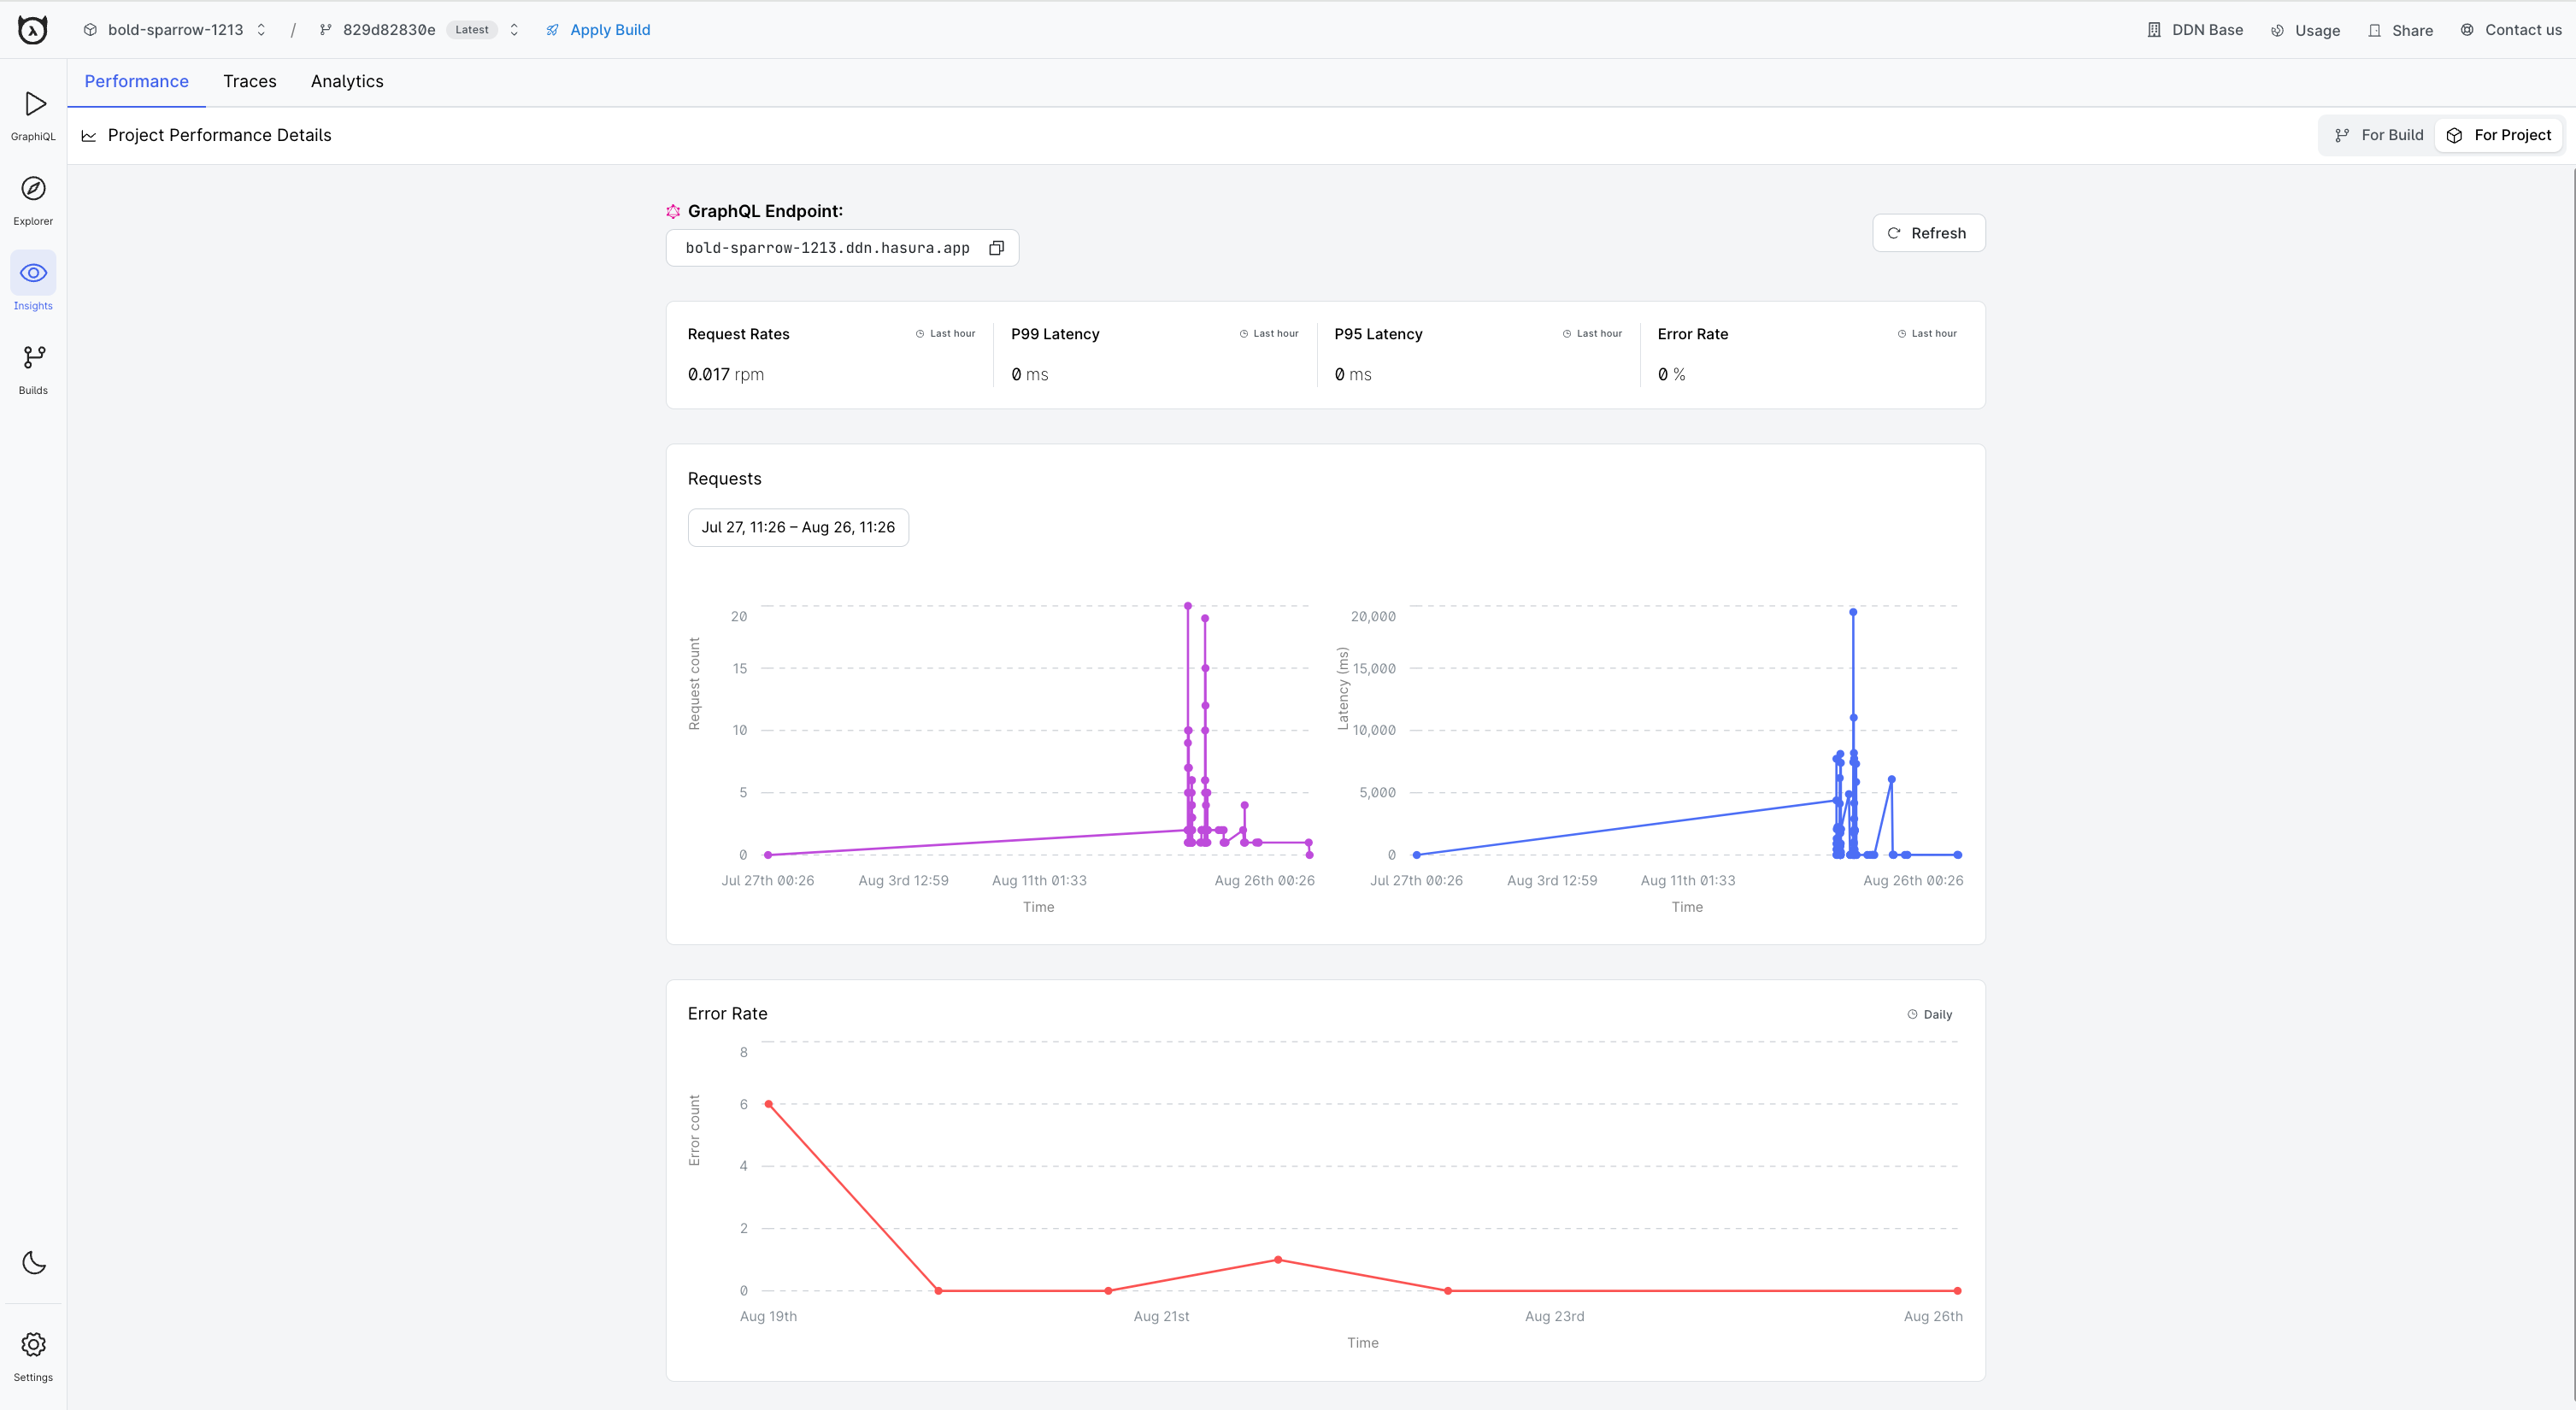
Hasura DDN ships with a set of metrics that help you monitor and debug performance of your GraphQL API. Simply head to
the Performance tab from Insights panel for a project's console, and you'll see performance metrics for all your API
requests.
From the performance page, metrics can be viewed for either an entire project or a single build.

Time-series metrics
Time-series metrics are a set of metrics that are collected over time. These metrics are useful for tracking the health of your GraphQL API and diagnosing potential failure points. These metrics can be filtered one day at a time and are retained for 30 days.
Request Rates
The number of requests to your GraphQL API per minute.
Request Latency
Request latency is the time taken to execute a request to your GraphQL API. The P99 (99th percentile) metric indicates that 99% of requests are completed within the recorded time whereas the P95 (95th percentile) metric indicates that 95% of requests are completed within the recorded time.
Error Rate
The percentage of requests to your GraphQL API that resulted in an error.
