Operation Analytics
Introduction
Operation-level analytics provide a broader view of how different operations (queries and mutations) are interacting with your models and commands. This helps in identifying usage patterns, most and least frequently accessed portions of your data graph. In turn helping optimize performance, manage resources better, and identify potential areas for improvement or scaling.
Operation analytics can be accessed via the Analytics tab within the Explorer panel for any specific model or
command, allowing users to view data for either the project API or of a particular build.
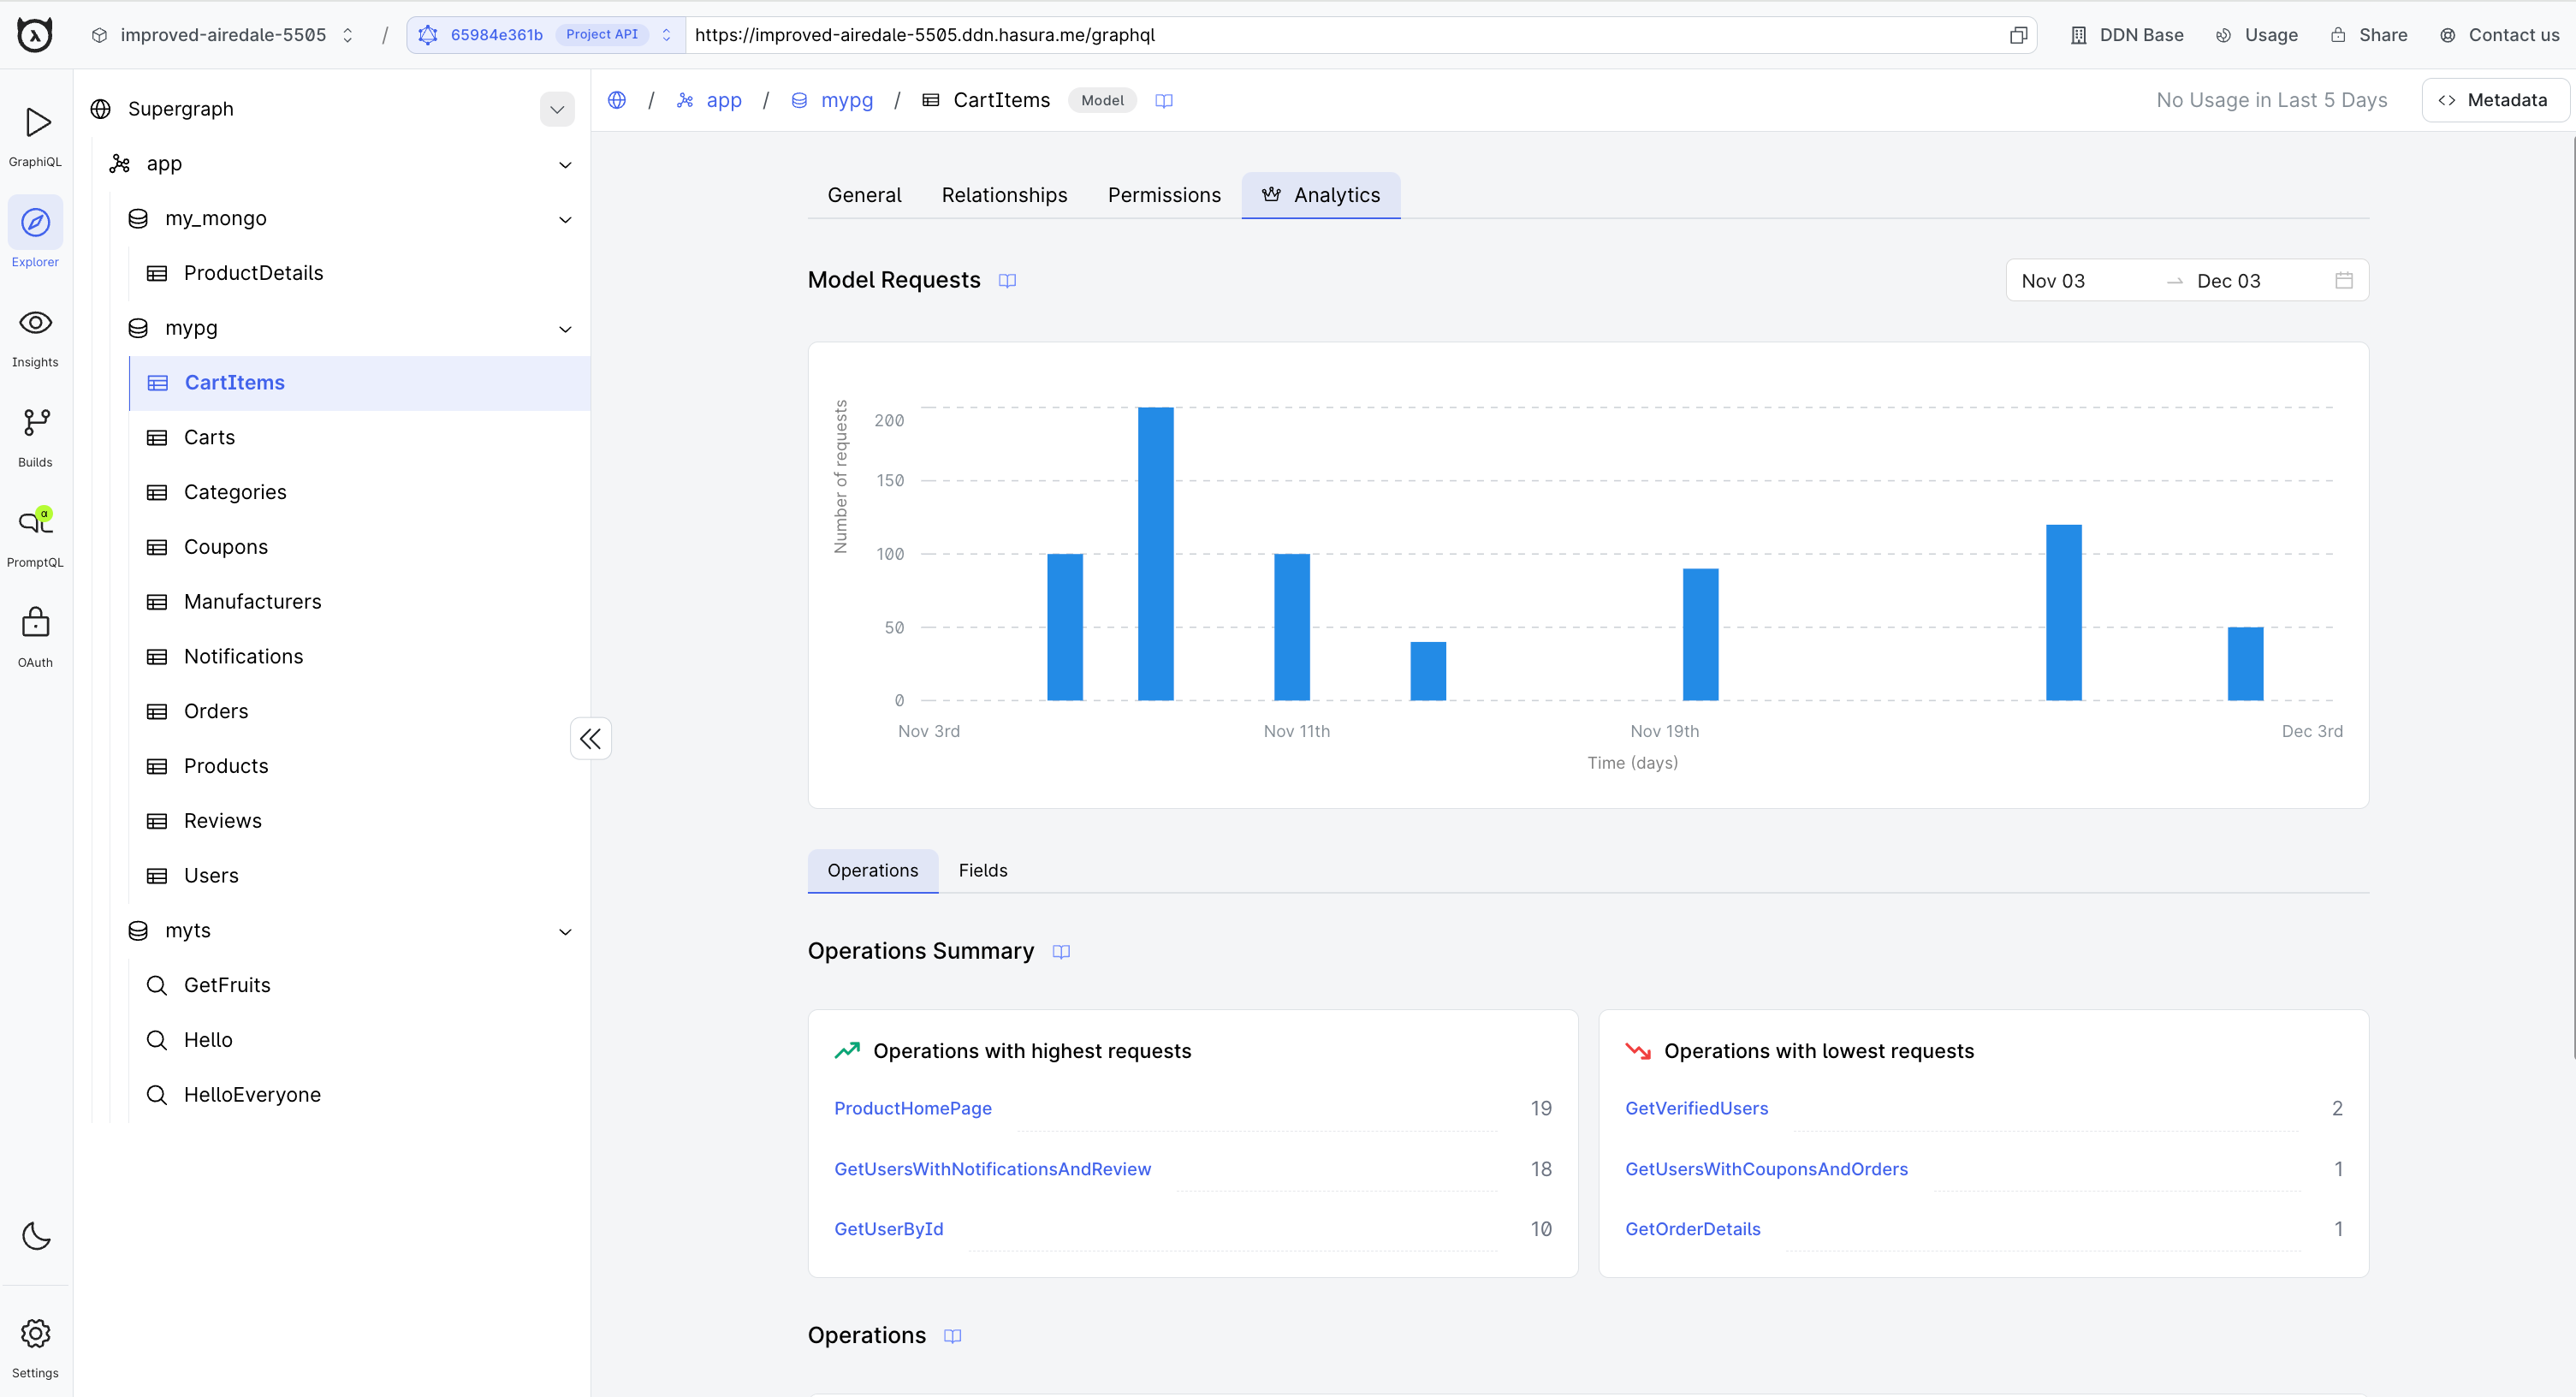
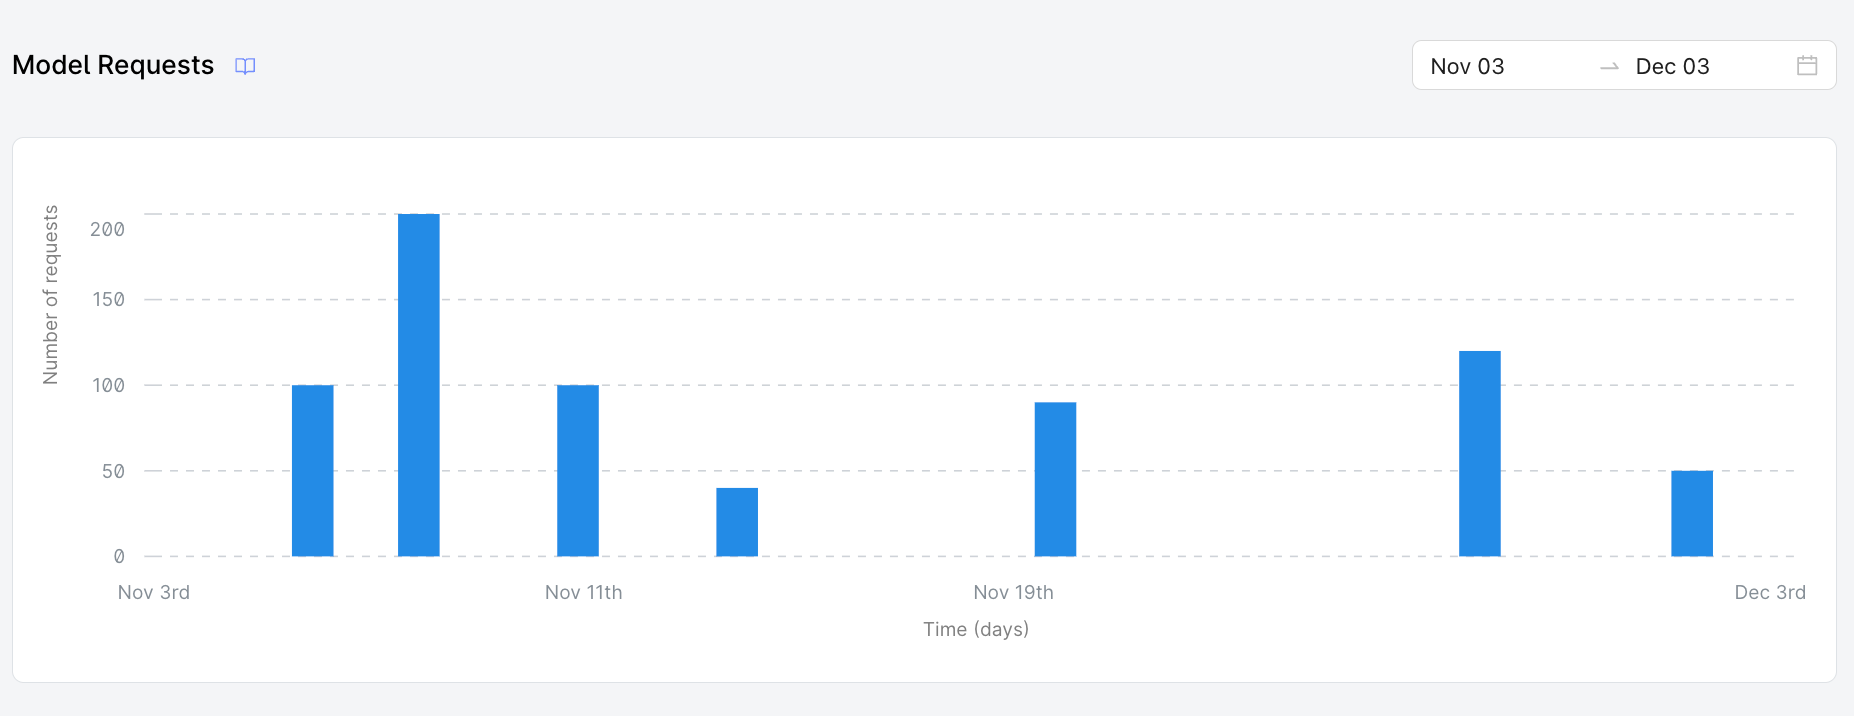
Model Requests
The Model Requests section provides a visual representation of the number of requests per day made on a particular model. Such insights help in pinpointing peak and low usage periods and in understanding how the model's usage varies over time.
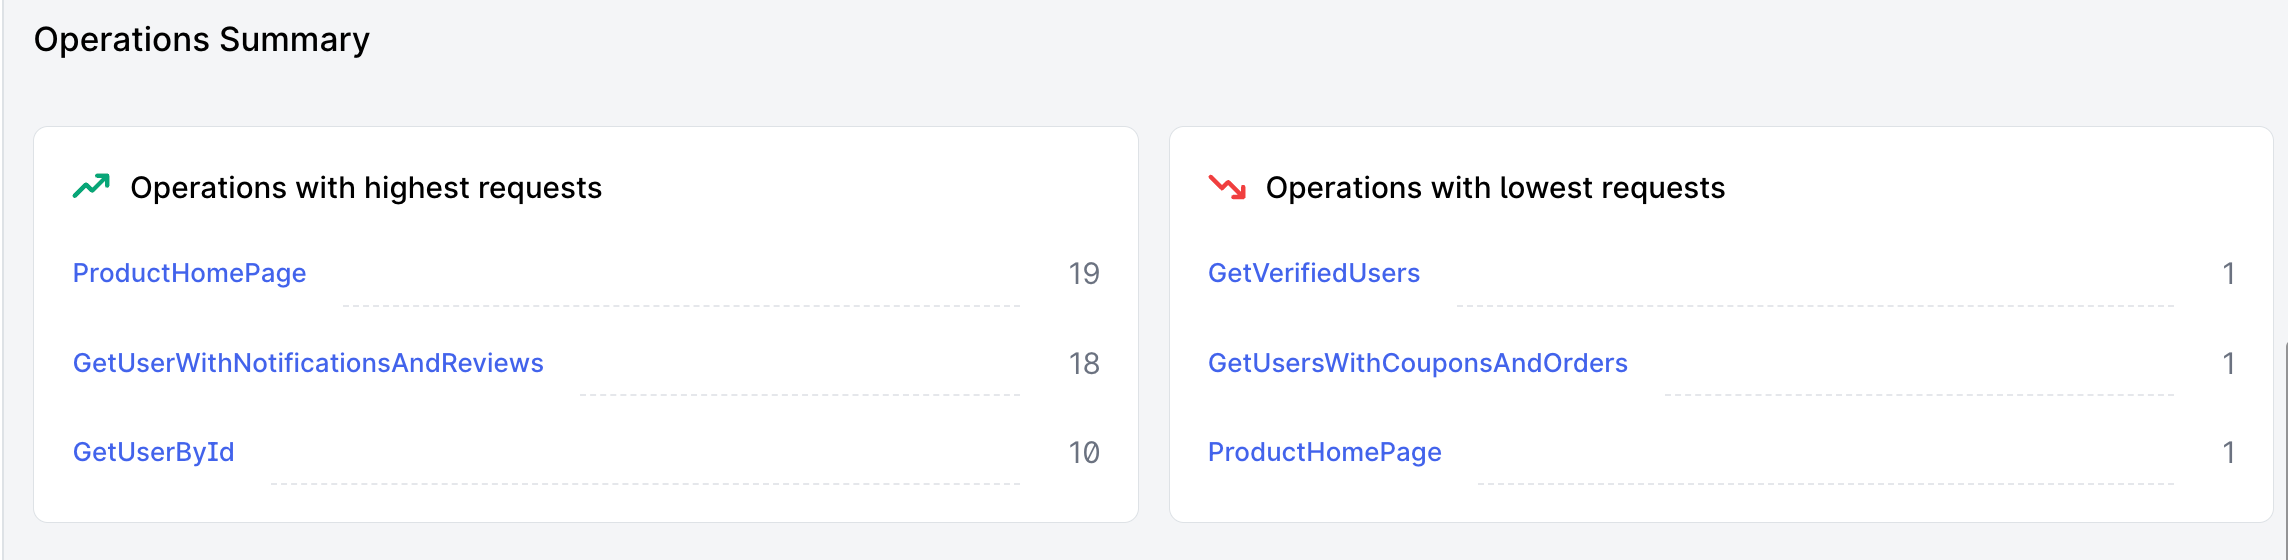
Operation Summary
The Operation Summary section provides an overview of the operations with the highest and lowest request counts. This information is crucial for understanding which queries or mutations most or least frequently access a model.
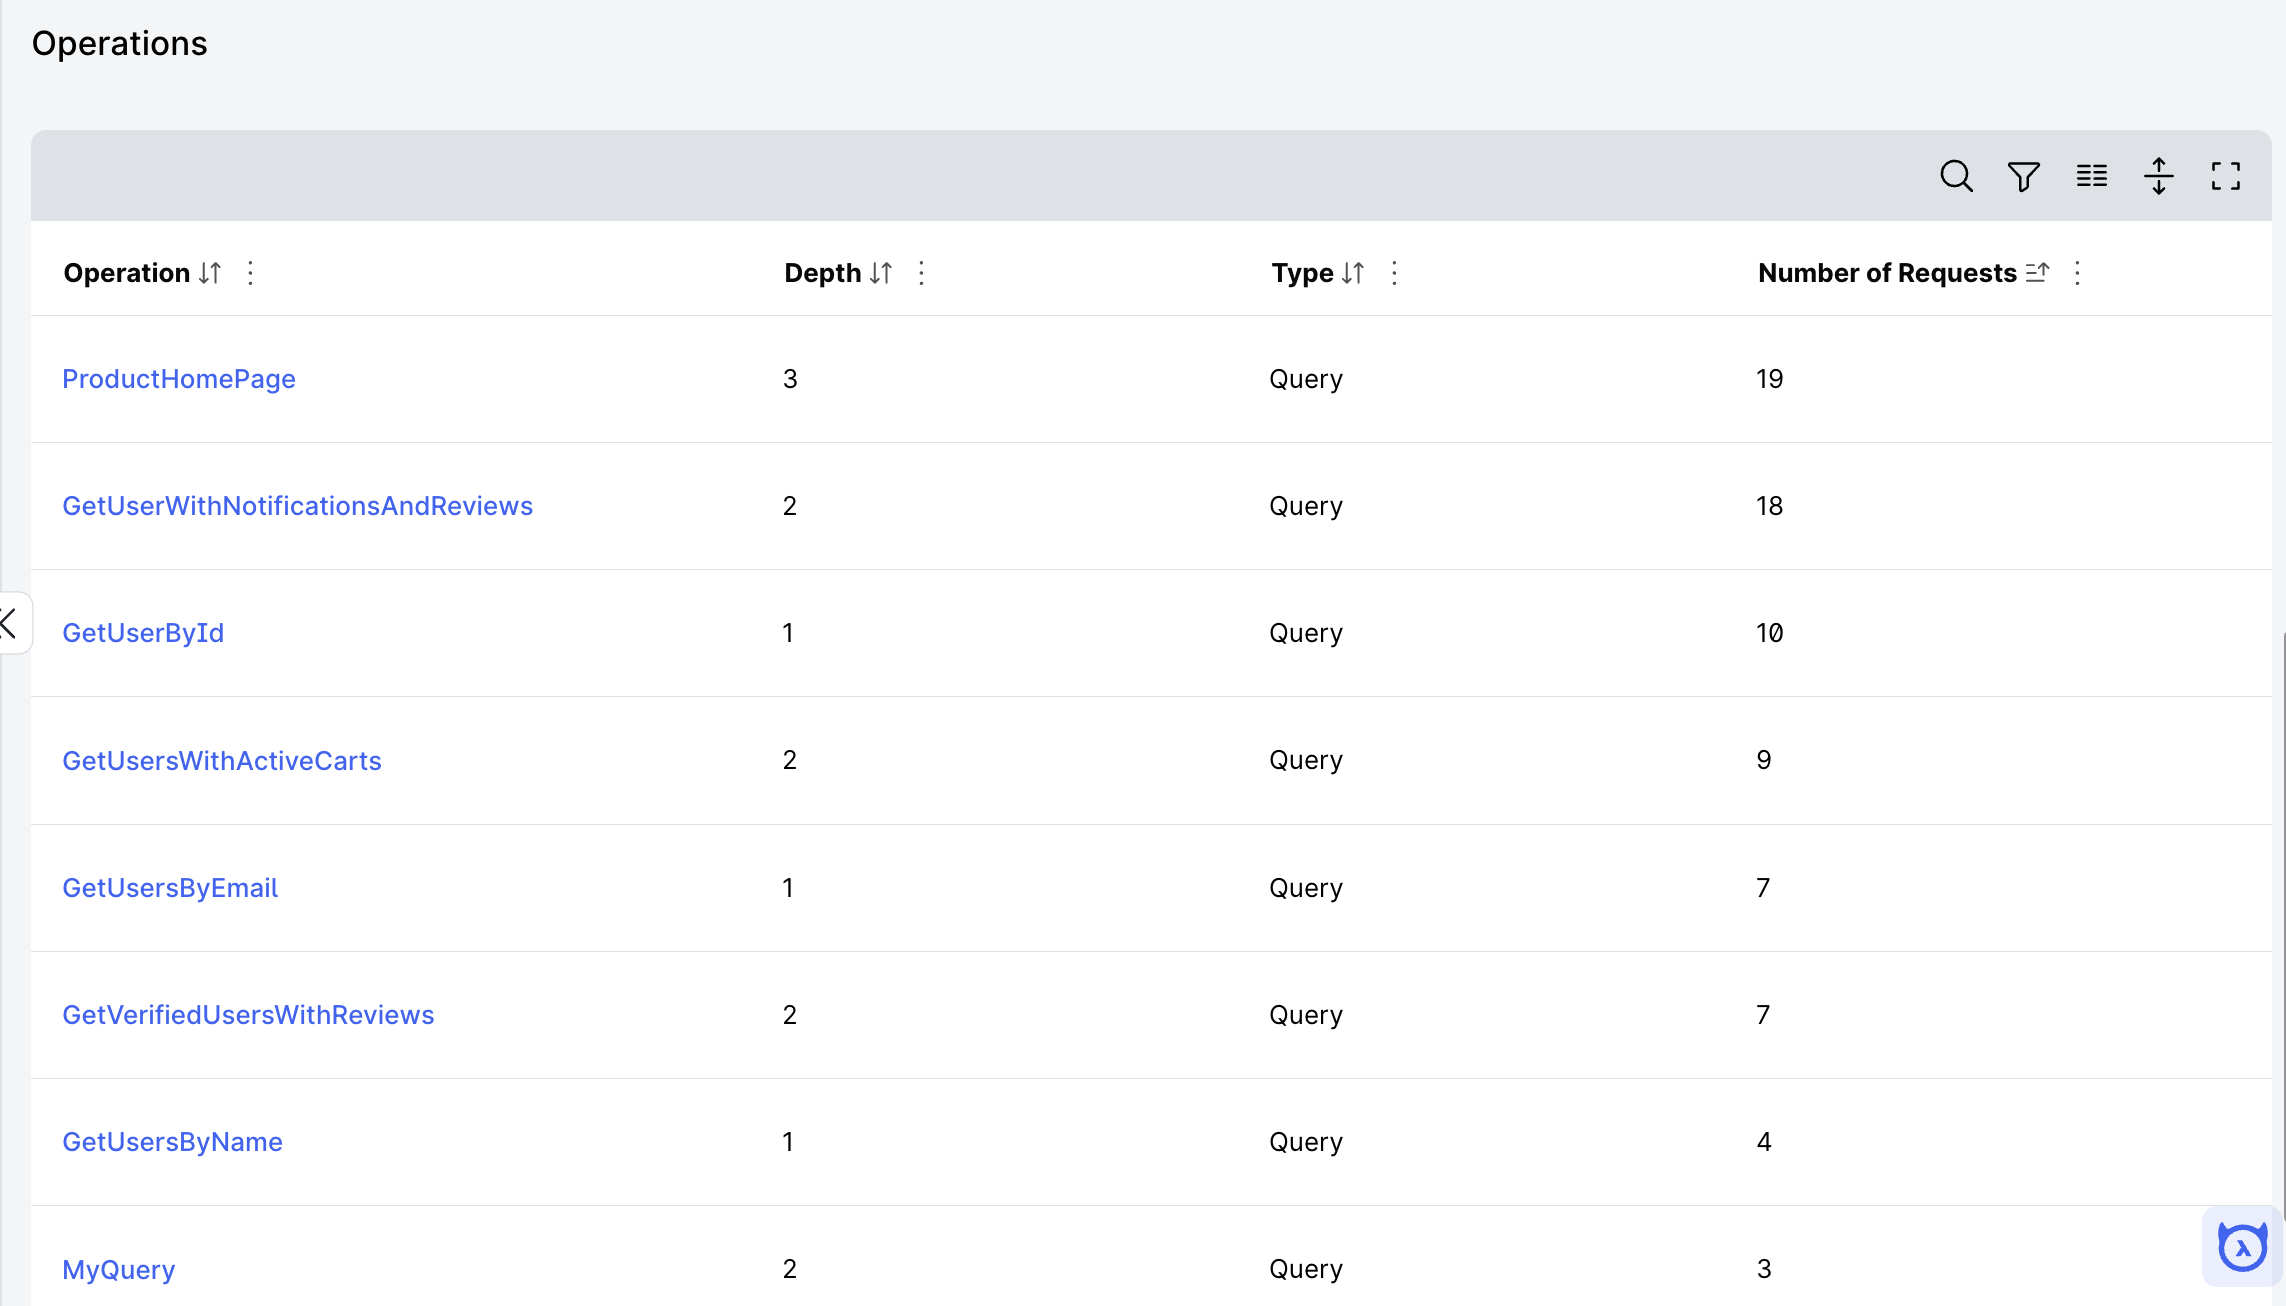
Operations List
The Operations List section provides a detailed table of all operations for a particular model. This table includes the operation name, depth level, operation type, and the number of requests. This comprehensive view helps in identifying and analyzing the usage patterns and complexities of different operations on a model.
Table columns
- Operation: The name of the GraphQL operation.
- Depth: Indicates the nesting depth of the operation. Depth in graphql queries can be a performance bottleneck.
- Type: The type of operation, such as query or mutation.
- Number of Requests: The total number of requests made for this operation.
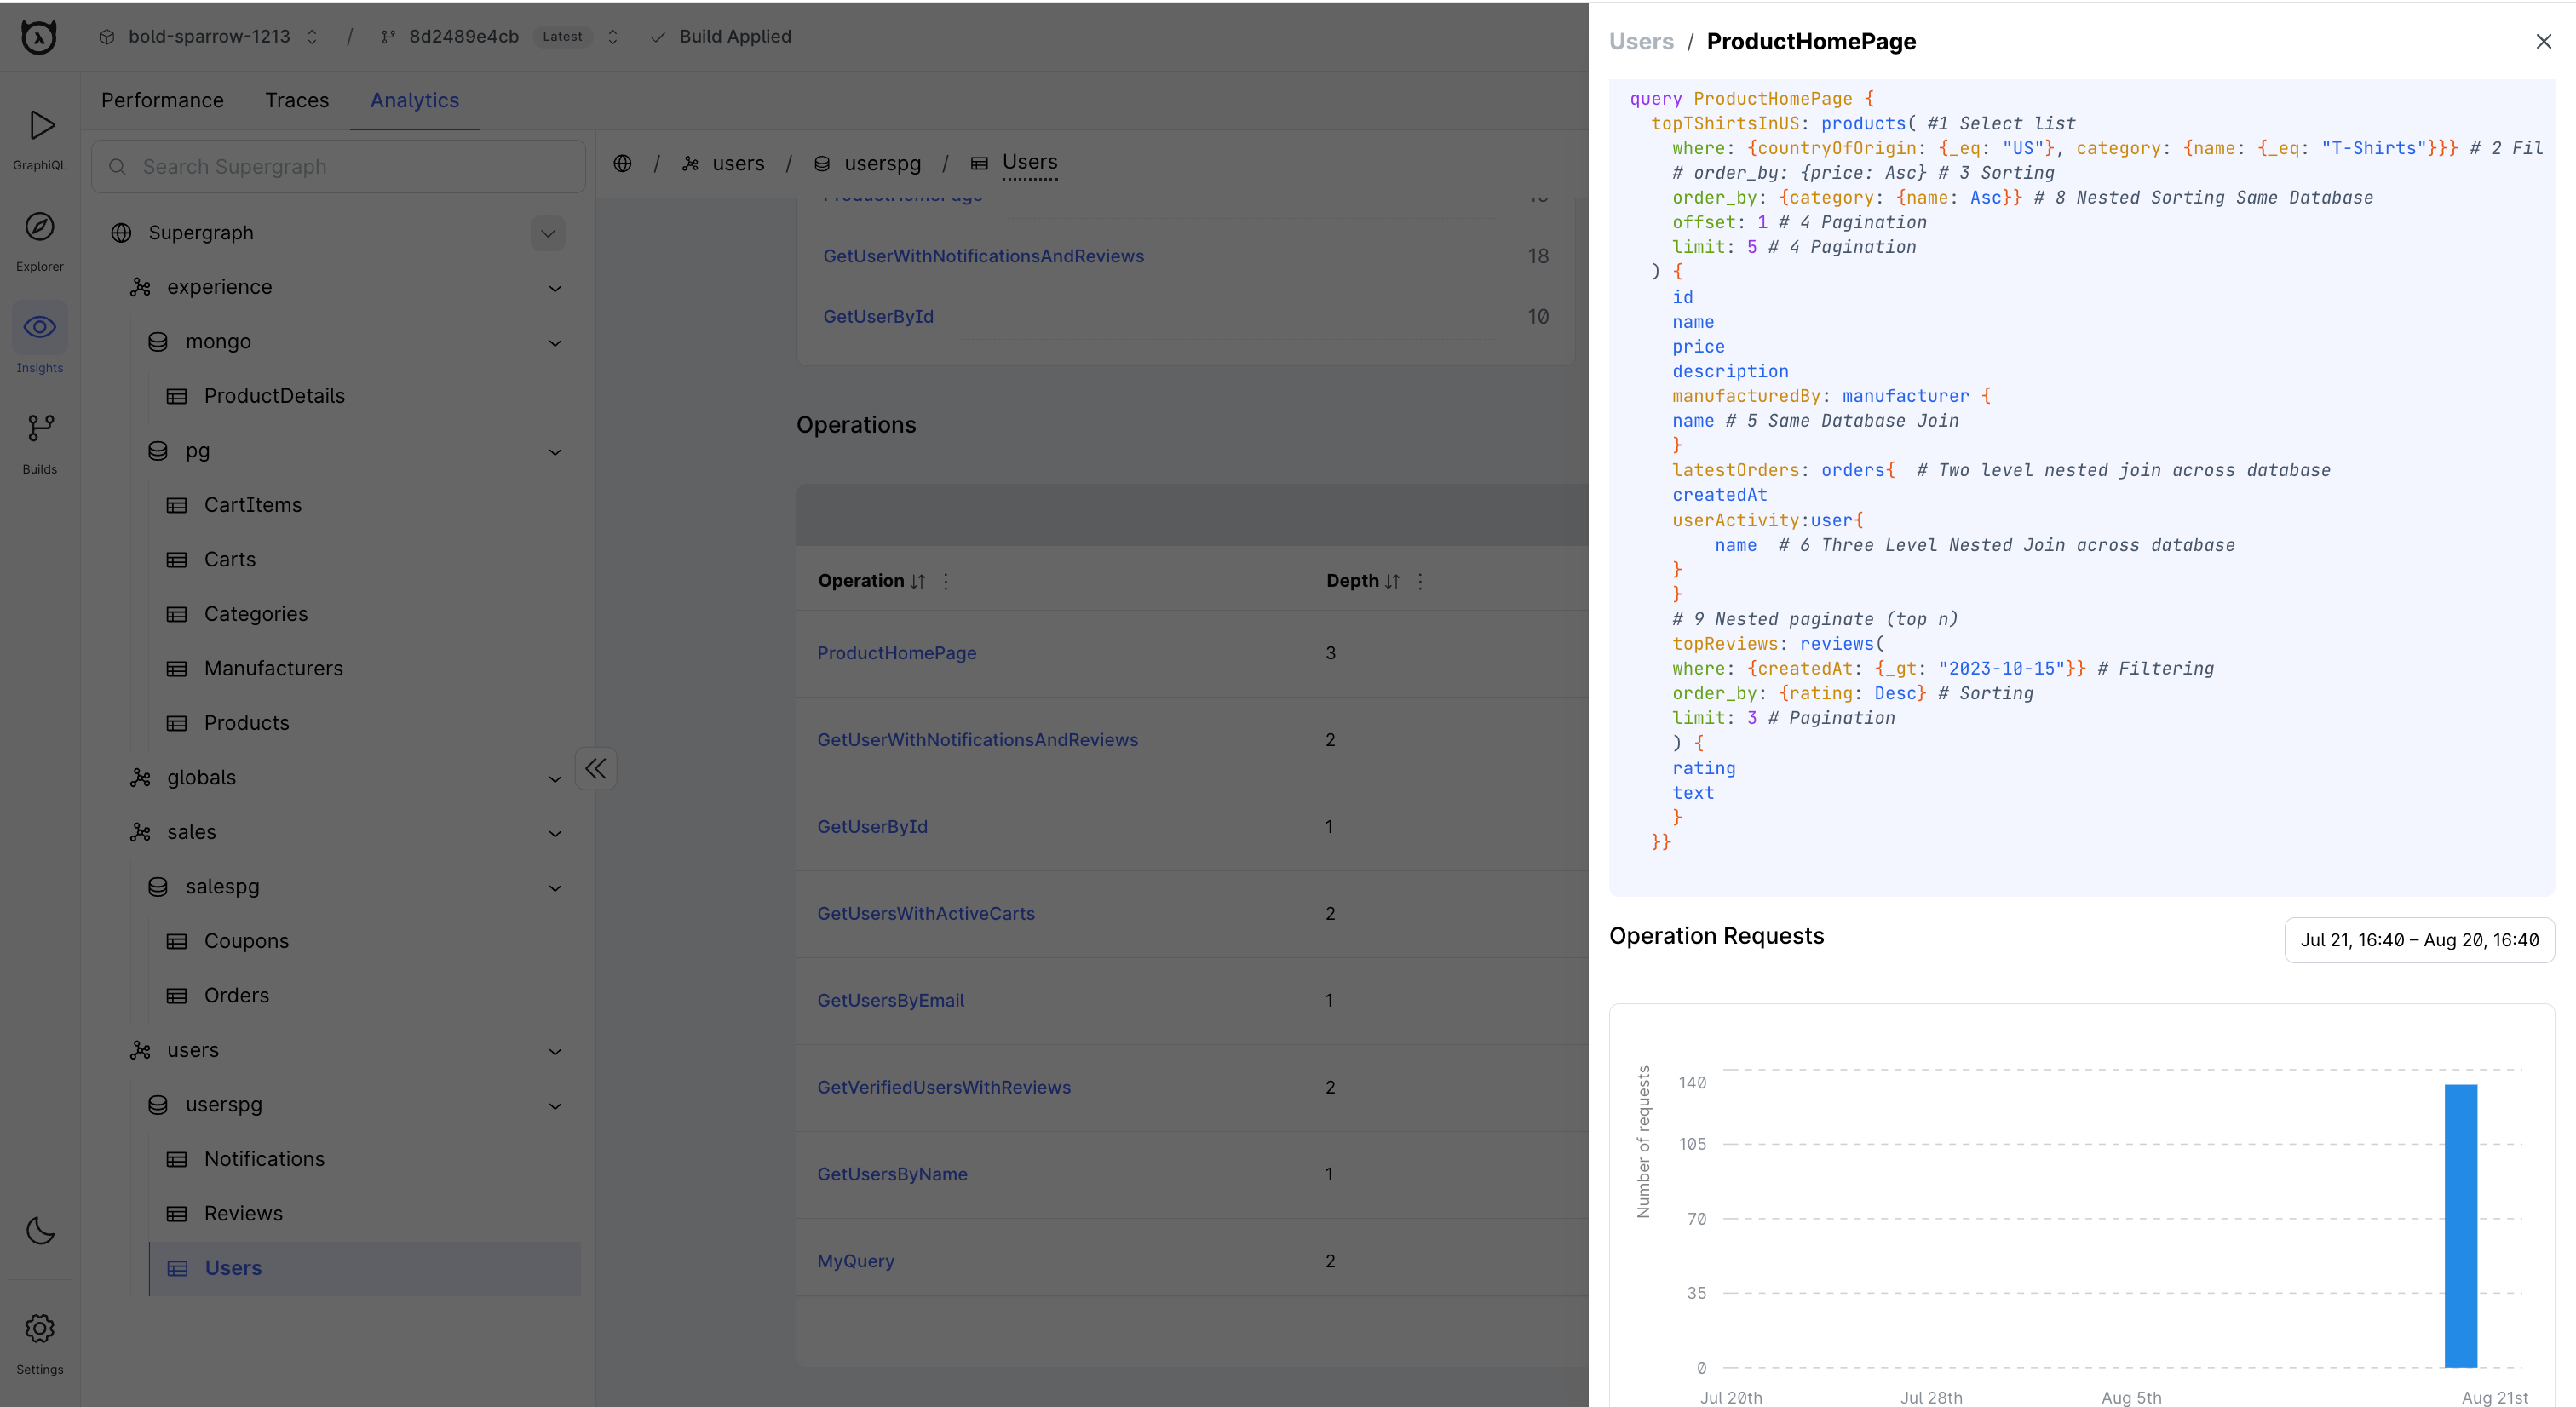
Operation details
Clicking on the operation name in the table shows additional details about the selected operation.
- Query Details: Displays the structure of the GraphQL query, showing the fields being queried.
- Operation Requests: A graph that shows the request traffic for this operation over the last month, allowing users to identify usage trends and peak periods.
- Models Used: Lists the models to which the query is made, providing insight into the data sources involved in the operation.
This detailed view enables you to dive deeper into specific operations, understand their structure, and analyze their usage over time, enabling you to make informed decisions about your APIs evolution and optimization.