Traces
Introduction
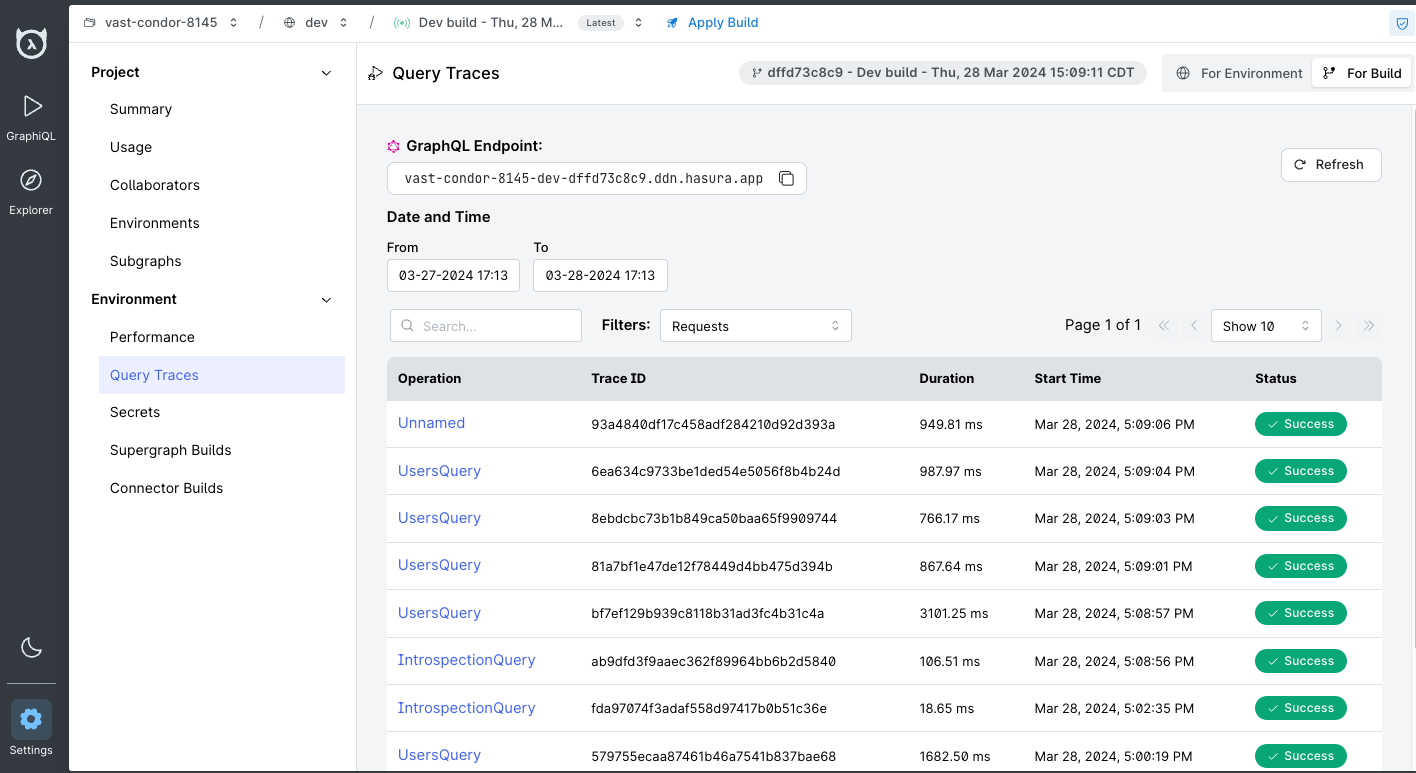
Query traces track and map journeys of user requests across various services or components. You can use these to quickly and easily view a summary for a query, see how much time it took to complete, the number of models that were used, commands which were accessed, and more.
Traces are typically used to diagnose or debug which part of your application could potentially be responsible for a failure or error state and to monitor the performance of end-user interactions with your application. You can do this by seeing how the query traverses through the various components of your supergraph and identify or debug potential failure points.
Traces are generated by instrumenting application code. Hasura DDN instruments all API queries with the OpenTelemetry
format and supports tracing out of the box. This means that you don't have to set up your own OpenTelemetry
collector. Simply head to the Query Tracing tab from Settings for a project's Console, and you'll see traces for
all your API requests.
You can access each query's trace using the toast in the bottom-right corner of the Console and instantly debug any potential issues.
Additionally, under settings, you can find the Query Traces tab to view all traces for your supergraph.
Topology
The topology of a query trace is a visual representation of the journey of a user request across various services or components. Each step in the journey is represented as a node in the topology, and the edges between the nodes represent the relationship between the steps. You can click on each node to view more details about the step.
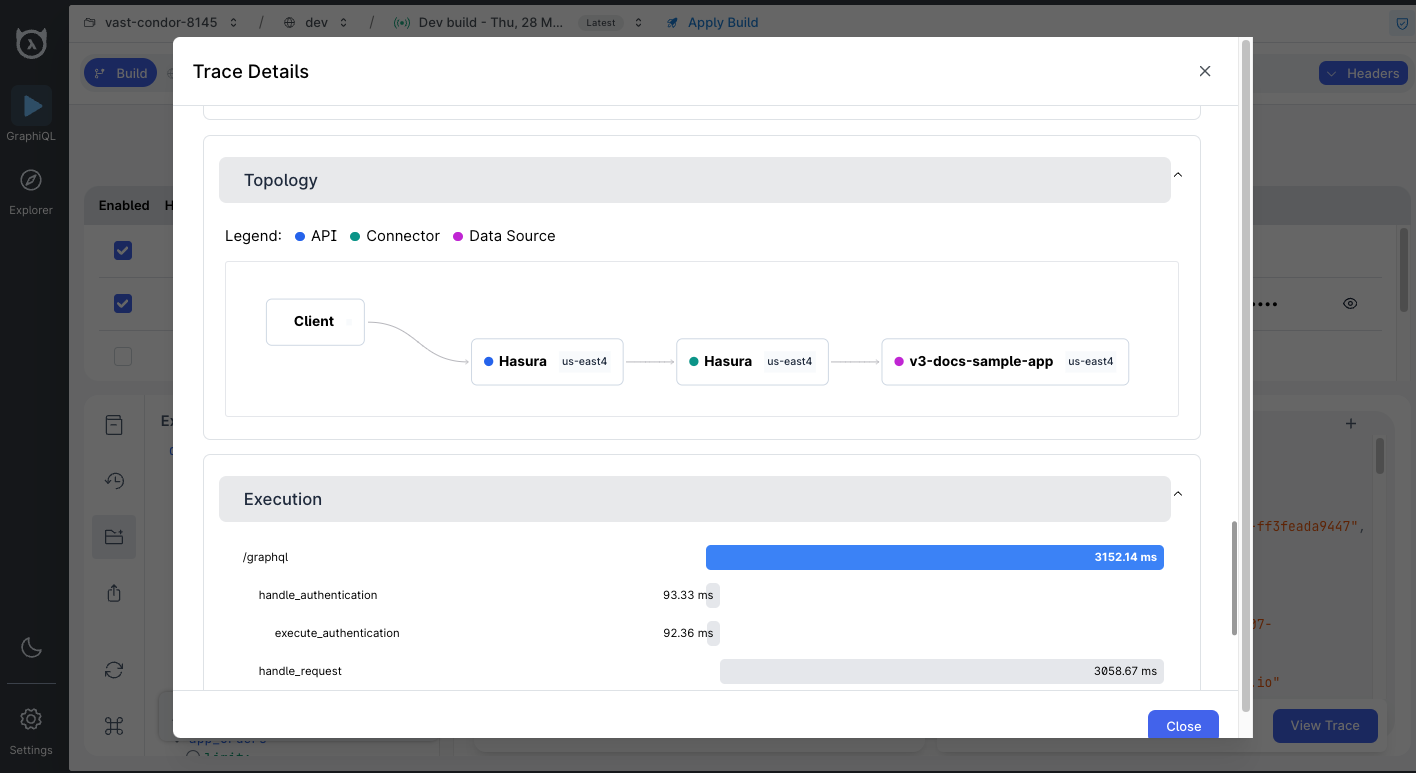
In the example above, you can see the trace begins with the client and moves its way through the various regions before arriving at the database.
Spans
Spans represent the basic unit of work in a distributed system. They describe the operation that an individual component of the system is doing, such as the time taken to execute a function or a request.
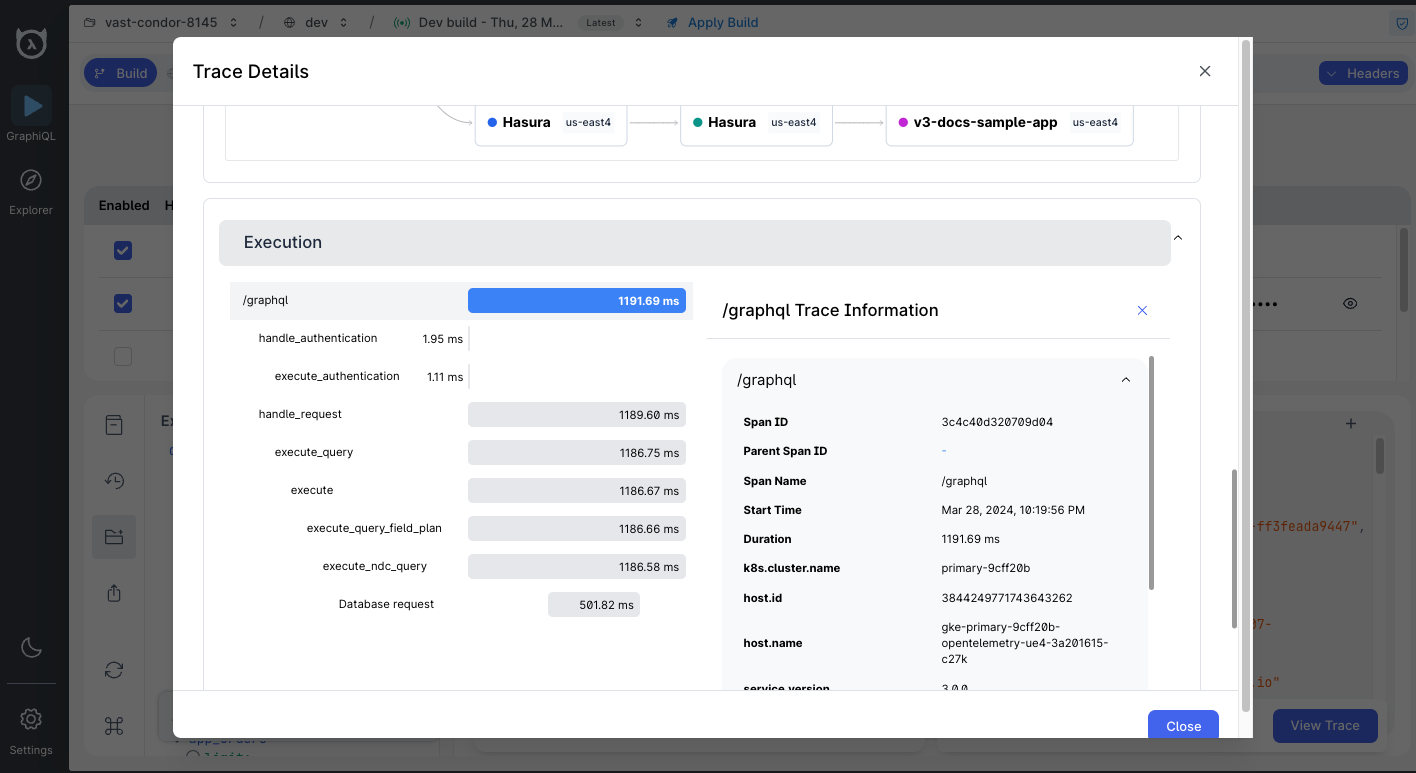
As we can see from the screenshot, there are two major spans:
| Span name | Description |
|---|---|
| authentication | The span responsible for handling authentication before the request is executed by the engine. |
| query | The span responsible for executing the GraphQL query. |
These spans can be expanded to view more details about the operation, such as the time taken to execute the operation, the status of the operation, and more.
Every request to your GraphQL API will have a unique trace-id associated with it and may have the following spans:
/graphqlhandle_authenticationexecute_authentication
handle_requestexecute_queryexecuteexecute_ndc_queryExecute Query<Connector spans>
execute_ndc_mutation<Connector spans>
| Span name | Description |
|---|---|
/graphql | The root span for every request to your GraphQL API. |
handle_authentication | The span responsible for handling authentication before the request is executed by the engine. |
execute_authentication | The span responsible for executing authentication, either using JWTs or via a Webhook. |
handle_request | The span responsible for handling a GraphQL request after it is successfully authenticated by the engine. |
execute_query | The top-level span for executing a GraphQL query. |
execute | The span responsible for executing each query in your GraphQL request. This span has an attribute usage_counts which describes all the models that were used as a part of this operation. |
execute_ndc_query | The span responsible for executing a single ndc query. This span has an attribute field which describes the schema type that was executed. |
Execute Query | The span responsible for executing the generated query on the data source. |
execute_ndc_mutation | The span responsible for executing a single ndc mutation. This span has an attribute field which describes the field that was executed. |
<Connector spans> | Optional spans from connectors to which the engine sends requests. |
Connector spans
Connectors can have internal spans that vary depending on the data source or business logic implemented. Those traces are exported separately from the connector and are handled automatically if the connector is deployed to DDN cloud. However, self-hosted connectors need to configure the variables below or connector traces will not be visible on the DDN console:
OTEL_EXPORTER_OTLP_ENDPOINT: https://gateway.otlp.hasura.io:443OTEL_EXPORTER_OTLP_HEADERS:Authorization=pat <personal-access-token>
The trace ID is propagated through B3 (Zipkin) headers, and must be extracted accordingly to ensure the spans are connected. If you are using a connector SDK, this should be handled for you automatically.
You can generate a personal access token here.