Observability & Performance Tuning
Hasura Event Triggers Execution
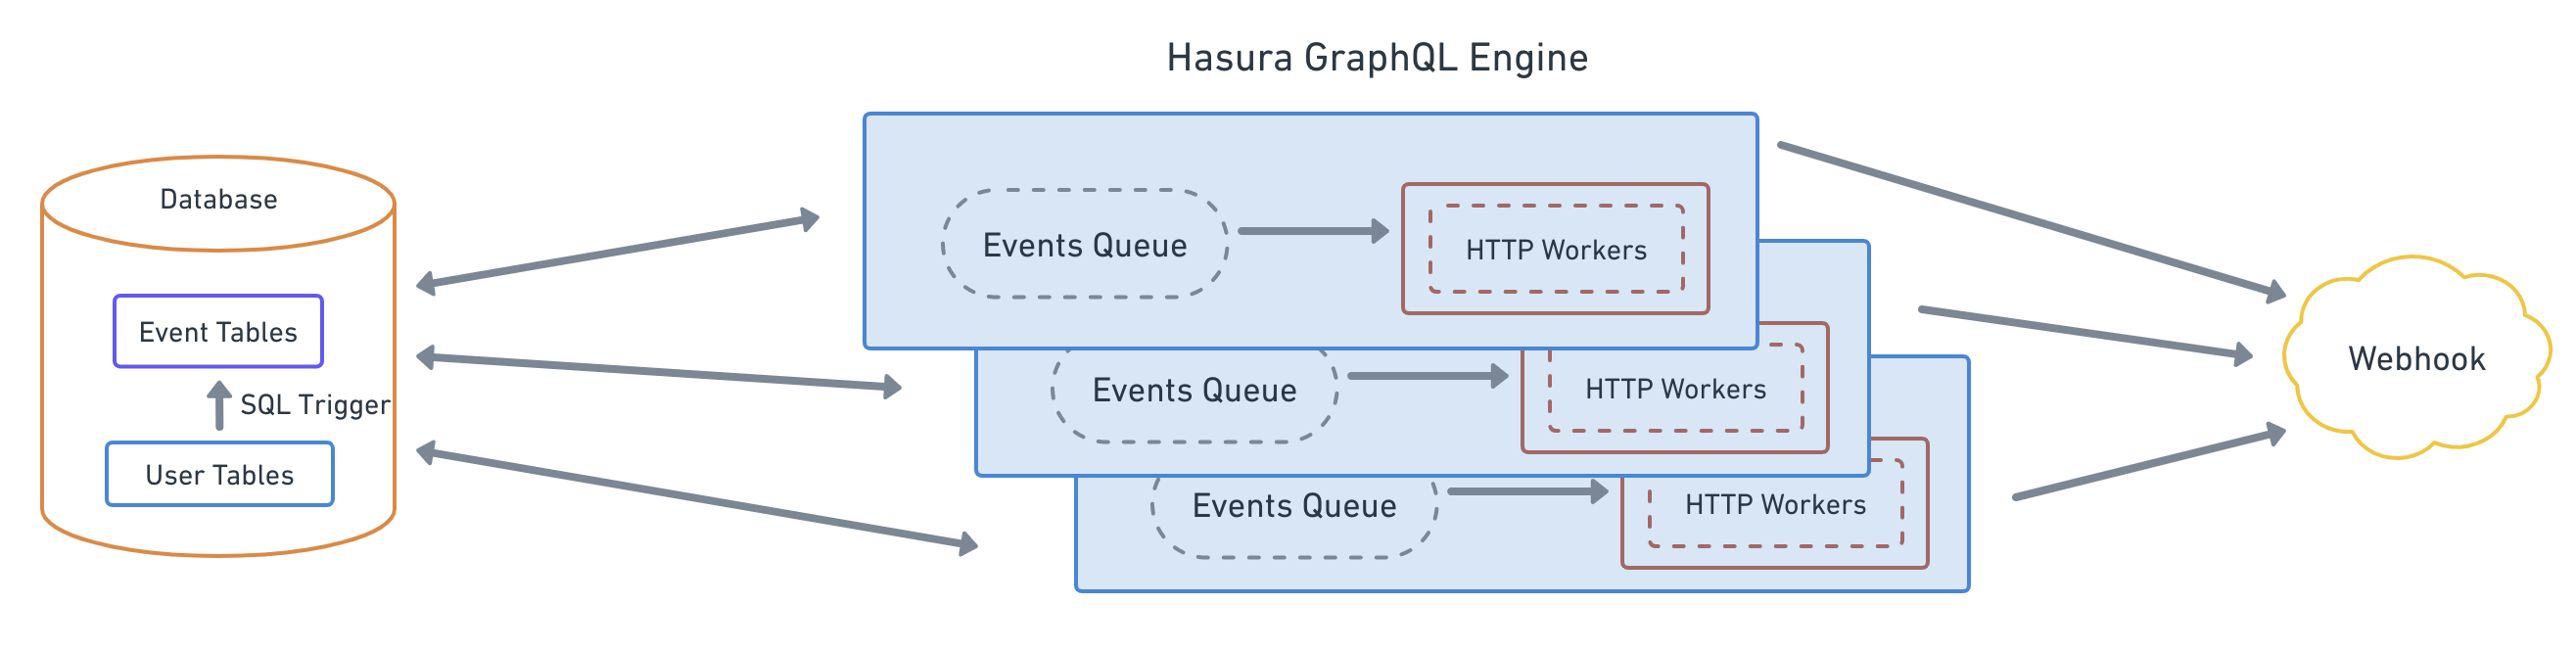
The Hasura Event Triggers system can be segmented into the 2 parts:
Event capture system
Event capture is accomplished via database triggers. A database trigger is created which is invoked whenever there is an
INSERT/UPDATE/DELETE (based on the definition of the event trigger) on the table.
The database trigger captures a per-row change and then writes that to a Hasura Events table. The Hasura Event tables acts as a queue for all pending/in-process events.
Event delivery system
Hasura creates a poller thread, which polls the Hasura Event tables for new/pending events. The poller thread fetches the events in batches (by default 100) and adds them to its in-memory events queue (Hasura Events queue). The polling is paused if all the HTTP workers (defined below) are busy.
Hasura also creates a pool of HTTP workers (by default 100) which are responsible for delivering the events from the events queue to the webhook.
After receiving response from the webhook, the event's state is updated in the Hasura Event tables.
Observability
Hasura EE exposes a set of Prometheus metrics that can be used to monitor the Event Trigger system and help diagnose performance issues.
The following metrics can be used to monitor the performance of Hasura Event Triggers system:
hasura_event_fetch_time_per_batch_secondshasura_event_invocations_totalhasura_event_processed_totalhasura_event_processing_time_secondshasura_event_queue_time_secondshasura_event_trigger_http_workershasura_event_webhook_processing_time_secondshasura_events_fetched_per_batch
Golden signals for Hasura Event Triggers
You can perform Golden Signals-based system monitoring with Hasura's exported metrics. The following are the golden signals for analyzing Hasura Event Triggers system performance.
Latency
Latency for the Event Triggers system is the time taken by Hasura GraphQL Engine to deliver events. To monitor this
latency, you can use the hasura_event_processing_time_seconds metric.
If the value of this metric is high, it may be an indication that events are taking a longer time to be processed and delivered.
The following are few things you can do to analyze and diagnose the latency issue:
- Investigate DB performance: Check the value of the
hasura_event_fetch_time_per_batch_secondsmetric. If the value of this metric is high, it maybe an indication that the database is slow. Consider optimizing the database. - Investigate HTTP Worker Saturation: Check the value of the
hasura_event_queue_time_secondsmetric. If the value of this metric is high, it maybe an indication that all the HTTP workers are saturated and are not able to pick up the events from theEvents Queue. Consider increasing the Events HTTP Pool Size - Investigate Webhook Performance: Check the value of the
hasura_event_webhook_processing_time_secondsmetric. If the value of this metric is high, it maybe an indication that the webhook is slow. Consider optimizing the webhook.
You can also try scaling your Hasura instance horizontally to handle more events.
Saturation
Saturation is the threshold until which the Hasura Event Triggers system can run smoothly. Once this threshold is crossed, you may see performance issues such as high event processing time, etc.
Saturation for the Event Trigger system references the difference between the incoming events rate and event delivery rate.
Saturation = No. of active HTTP workers / No. of total HTTP workers
To monitor saturation, you can use the following:
- Investigate HTTP Workers: Compare the active HTTP workers
hasura_event_trigger_http_workerswith the Events HTTP Pool Size. Saturation is high if the active HTTP workers is near the HTTP pool size. If HTTP workers are saturated then it maybe also indicate that thehasura_event_queue_time_secondsis also high. Consider Increasing the number of HTTP workers by increasing the Events HTTP Pool Size
Traffic
Traffic for Event Triggers is the number of new events created in a given time frame (like 1000 events per minute). Events can be created even if mutations don't go through Hasura i.e. using some other client. Hence, Hasura doesn't give the number of events as metrics, but you can find this out by using metadata APIs like pg_get_event_logs. "Proxy" metrics for traffic are the number of mutations, number of events processed and number of events fetched per batch.
To monitor traffic, you can use the hasura_event_processed_total and the
hasura_events_fetched_per_batch metrics.
If the value of hasura_events_fetched_per_batch is close to the configured max batch size, then it hints that there
may be some pending events in the database yet to be fetched and processed.
Errors
Errors for an Event Trigger references the number of event deliveries that failed or errored out.
To monitor errors, you can use the hasura_event_processed_total metric. You can then filter
the metric using the label status: failed i.e., hasura_event_processed_total{status="failure"}.
You can do to the following to analyze and diagnose errors:
- Identify the Event Trigger with a high error rate. You can do this by using the above metric and see the trigger
name associated to that metric in the
trigger_namelabel. - You can then use the
*_get_event_logsand*_get_event_invocation_logsmetadata API to get the error logs for the Event Trigger. This should provide some insights into the error.
Tuning Hasura Event Triggers performance
Hasura Event Triggers are designed to handle of millions of events per hour. However, due to misconfigurations or other reasons, the performance of the Hasura Event Triggers system can be impacted. This section describes how to tune the performance of subscriptions.
Performance tuning
Event Trigger processing can be tuned by few server settings as described below:
HASURA_GRAPHQL_EVENTS_FETCH_BATCH_SIZE:- The number of events fetched from the
Hasura Event tablesin the database per batch. By default, 100. - Increasing this will fetch more events from the database per batch, thereby reducing the load on database and improving throughput while increasing individual fetch SQL execution times and, potentially, the memory of the Hasura instance.
- The number of events fetched from the
HASURA_GRAPHQL_EVENTS_HTTP_POOL_SIZE:- The maximum number of HTTP workers that are spawned to deliver events to the webhook. By default, 100.
- Increasing this will spawn more HTTP workers, thereby increasing the number of concurrent event deliveries to the webhook. This may also increase the memory and the CPU usage of the Hasura instance.
HASURA_GRAPHQL_EVENTS_FETCH_INTERVAL:- The interval at which Hasura polls the database for new events. By default, 1000 milliseconds (1 second).
- Increasing this reduces frequency of the poll to the database reducing the load on it while increasing the latency of processing of event.