Observability Best Practices
Introduction
The purpose of this document is to provide an overview of some of the best practices to follow when you configure observability for your Hasura-driven product. We will cover the fundamentals of observability and provides general recommendations on what Hasura considers as observability best practices.
While specifics of your product or system will define your configurations, we have used Hasura Cloud, Postgres, Prometheus and Grafana to build this guide. Wherever applicable, links are provided to the mentioned product’s documentation.
We also provide pre-built Grafana Dashboards for you to replicate.

The basics
What is observability?
The ability to gauge a system's internal conditions by looking at its outputs is known as observability. If the current state of a system can be determined solely from information from outputs, such as sensor data, then the system is said to be "observable.”
Without observability, it would be challenging to figure out what is wrong with the system unless you were actively monitoring the system for issues. Observability means you can:
- Gain insights into the functionality and health of your systems, collect data, visualize them, and set up alerts for potential problems.
- Have distributed tracing provide end-to-end visibility into actual requests and code, helping you to improve the performance of your application.
- Audit, debug, and analyze logs from all your services, apps, and platforms at scale.
Three pillars of observability
The three pillars of observability are logs, metrics, and traces. Access to logs, metrics, and traces does not automatically make systems more visible. But in combination, they are potent tools that, when properly understood, allow the creation of observable systems.
Observability in Hasura
Hasura Cloud
Hasura Cloud projects include dashboards for observability. You will find your monitoring dashboard under the
Monitoring tab of your Hasura Cloud project.
The following default observability options are enabled on your Hasura Cloud project:
- Stats Overview
- Errors
- Usage Summaries
- Operations
- Websockets
- Subscription Workers
- Distributed Tracing
- Query Tags
Third-party observability platforms
If your organization has multiple applications and systems that need to be monitored, the most efficient way to do so is via an observability platform. Hasura provides first-party integrations with multiple observability platforms and is fully open-telemetry compliant. You can find a list of third-party observability platforms supported by Hasura here.
Hasura Enterprise (self-hosted)
Since your Hasura Enterprise is self-hosted (on-premises or on a third-party cloud), we recommend that you enable monitoring for your containers and pods. Your organization can make better decisions by knowing what is happening at the cluster or host level and within the container runtime and application. This level of information allows you to make decisions like when to scale instances, tasks and pods in or out, as well as which instance types to use.
Logs
Depending on your Hasura Enterprise Edition deployment mode, you may access, export, and process logs from your deployment using this document. Generally, you should configure your container logs to be exported to your observability platform using the appropriate log drivers.
Metrics via Prometheus
You can export metrics of your Hasura Enterprise project to Prometheus easily via enabling the metrics API. You can
find more information on this here.
For security reasons, the metrics endpoint should not be leaked to the internet. Or if unavoidable, the Prometheus secret should be confidential to prevent misuse.
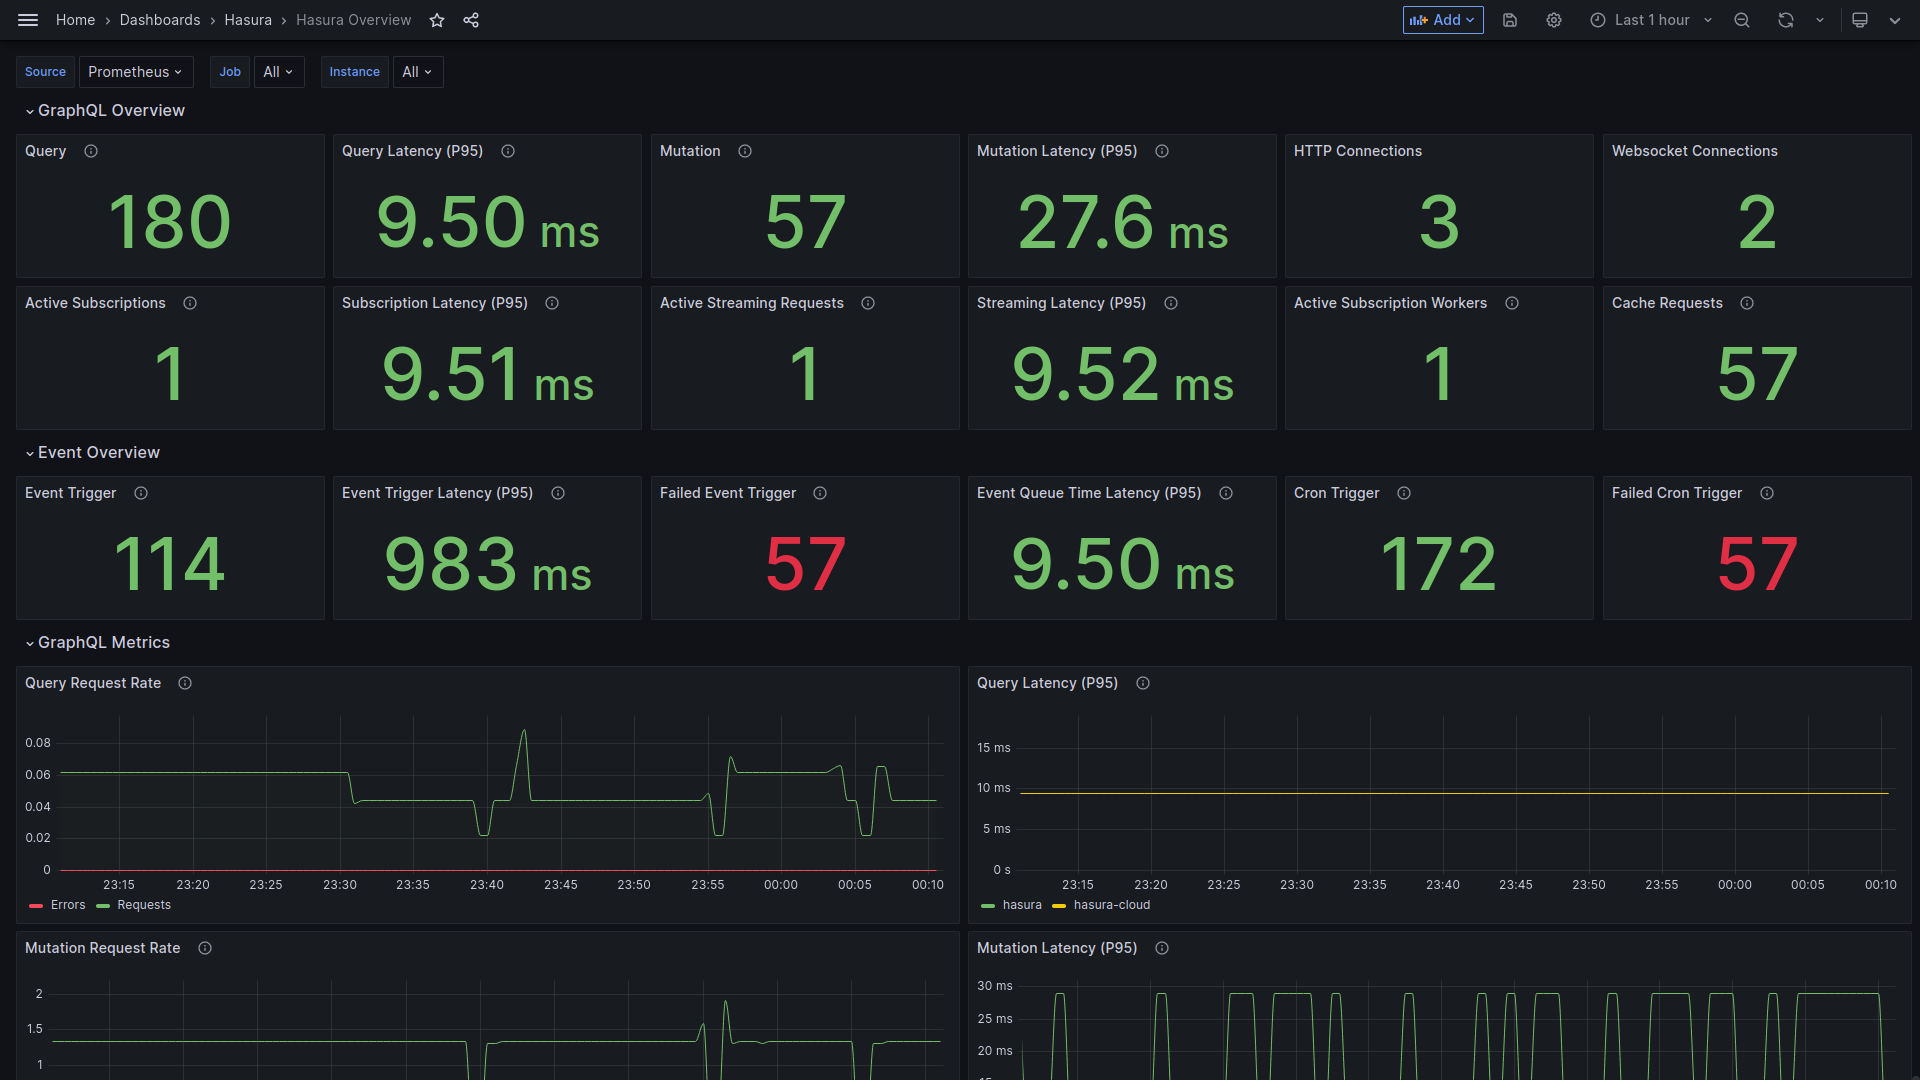
Pre-built Grafana Dashboards are provided to visualize Golden signal metrics that you will love for real-time monitoring.
Metrics via OpenTelemetry
Hasura Enterprise is open-telemetry compliant and can export metrics to third-party observability platforms which support OpenTelemetry. Check out the OpenTelemetry page for more information.
Distributed traces
Hasura Enterprise also can export distributed traces via OpenTelemetry. Read more at here for more information.
Database observability
Deeper insight into databases across all of your servers is provided via database monitoring. To understand the performance and health of your databases and address problems as they develop, we have to dig deeper into:
- Historical query performance
- Host-level metrics
Enabling observability agents in your database
You can enable observability for your databases by installing an agent for your observability platform on your database servers (typically from the observability tool’s marketplace). Hasura recommends the following instrumentations should be implemented:
- System information
- CPU Usage
- Memory
- Query Tags
Query Tags are SQL comments that consist of key=value pairs that are appended to
generated SQL statements. When you issue a query or mutation with query tags, the generated SQL has some extra
information. Database analytics tools can use that information (metadata) to analyze DB load and track or monitor
performance.
Using Query Tags and pganalyze
- Refer to documentation from pganalyze for information on how to connect your database to the analyzer.
- Once connected to your database, test the functionality by:
- Executing the
run consoleoption in pganalyze. - Executing the
collector --testcommand in the Console.
- Executing the
- At this point, all queries run from the GraphiQL editor or your Cloud project's Console will appear in the pganalyze Console.
- Selecting any query from the dashboard will expand to give additional information about the execution.
- To quickly locate operations, you can use the
Request IDthat can be found from theMetricsdashboard on Cloud.
Alerting and alert propagation
Integrating your observability tools with an incident response platform (IRP) is the recommended method for alert propagation. Integrating with an IRP allows high visibility and actionable intelligence across the entire incident lifecycle. Most IRPs enable your organization to respond quickly to incidents, automate responses, and will allow you to build more reliable services and platforms.
If you use Prometheus for metrics observability, you can also consider using Alertmanager to configure common alert rules for performance and error incidents.