Integration Guide for Grafana Cloud
Introduction
Grafana Cloud provides a free tier that allows you to monitor and visualize your traces, metrics, and logs. By integrating Grafana Cloud with Hasura Cloud using OpenTelemetry, you can effectively monitor your Hasura GraphQL Engine and data connectors. This guide will walk you through the steps to integrate Grafana Cloud's OTLP endpoint with Hasura Cloud, enabling you to visualize and analyze your telemetry data effectively.
Step 1: Set up Grafana Cloud
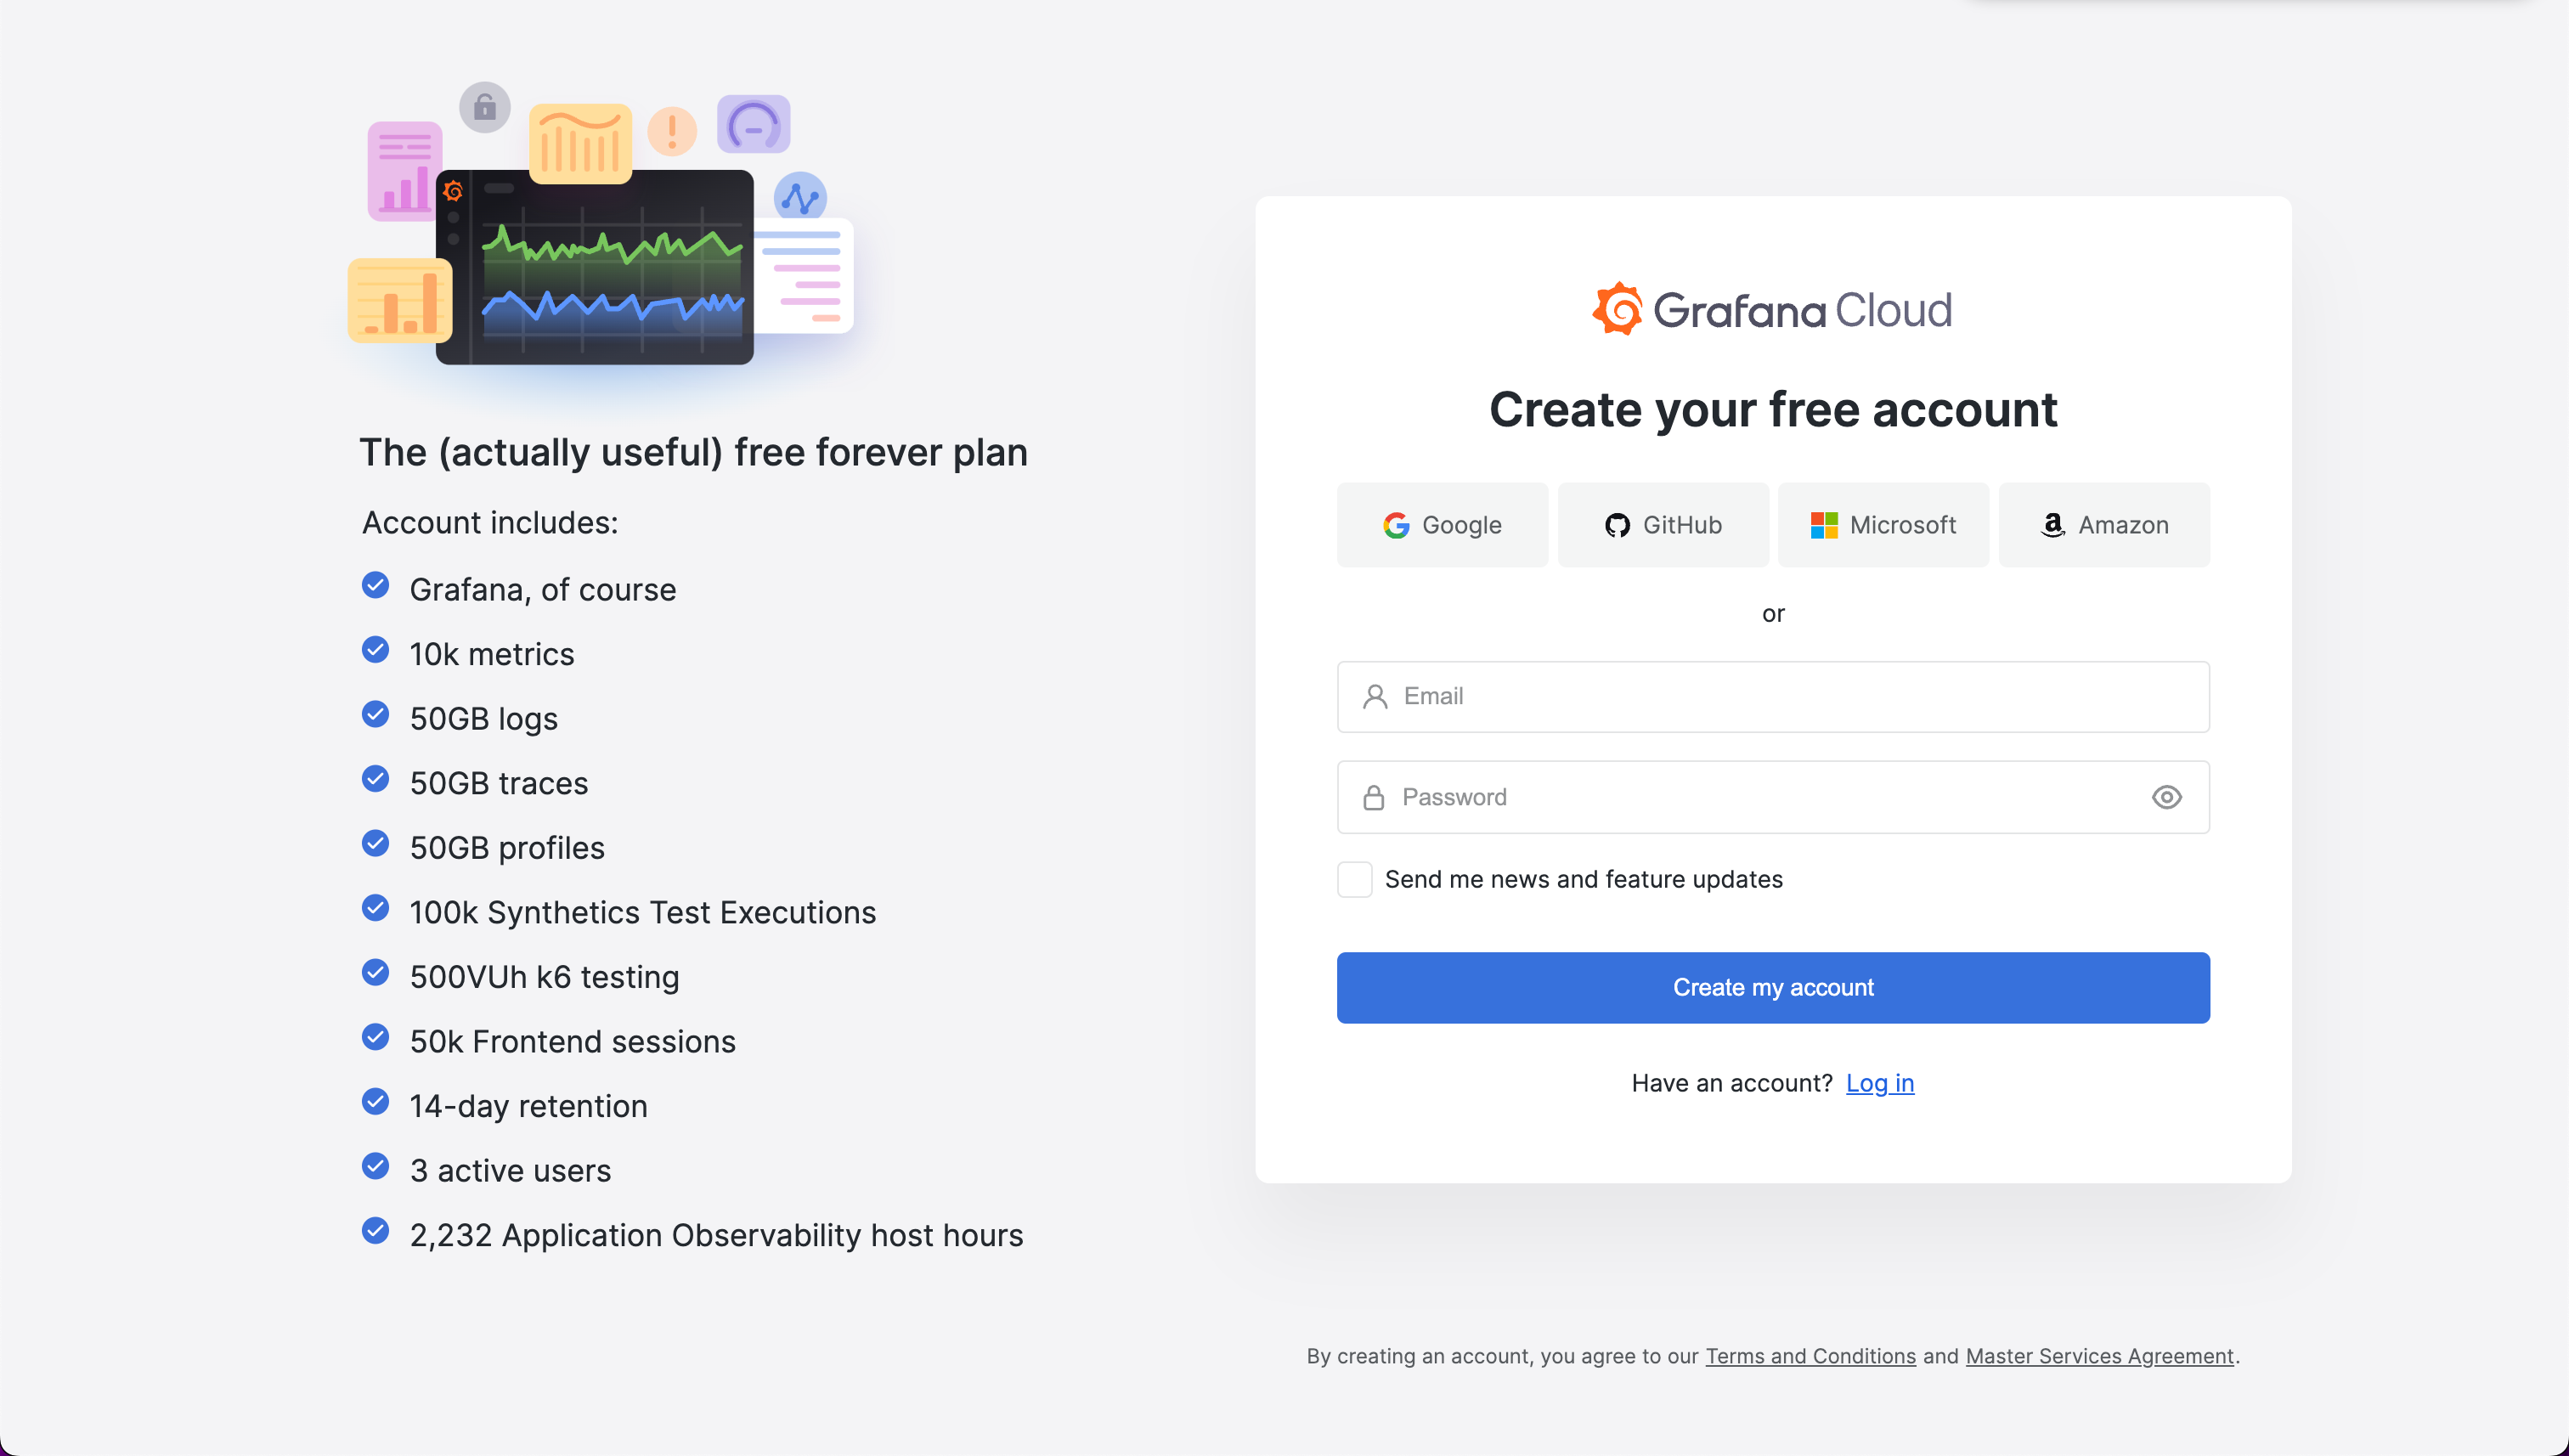
Begin by logging into your existing Grafana Cloud account, or create a new one here.
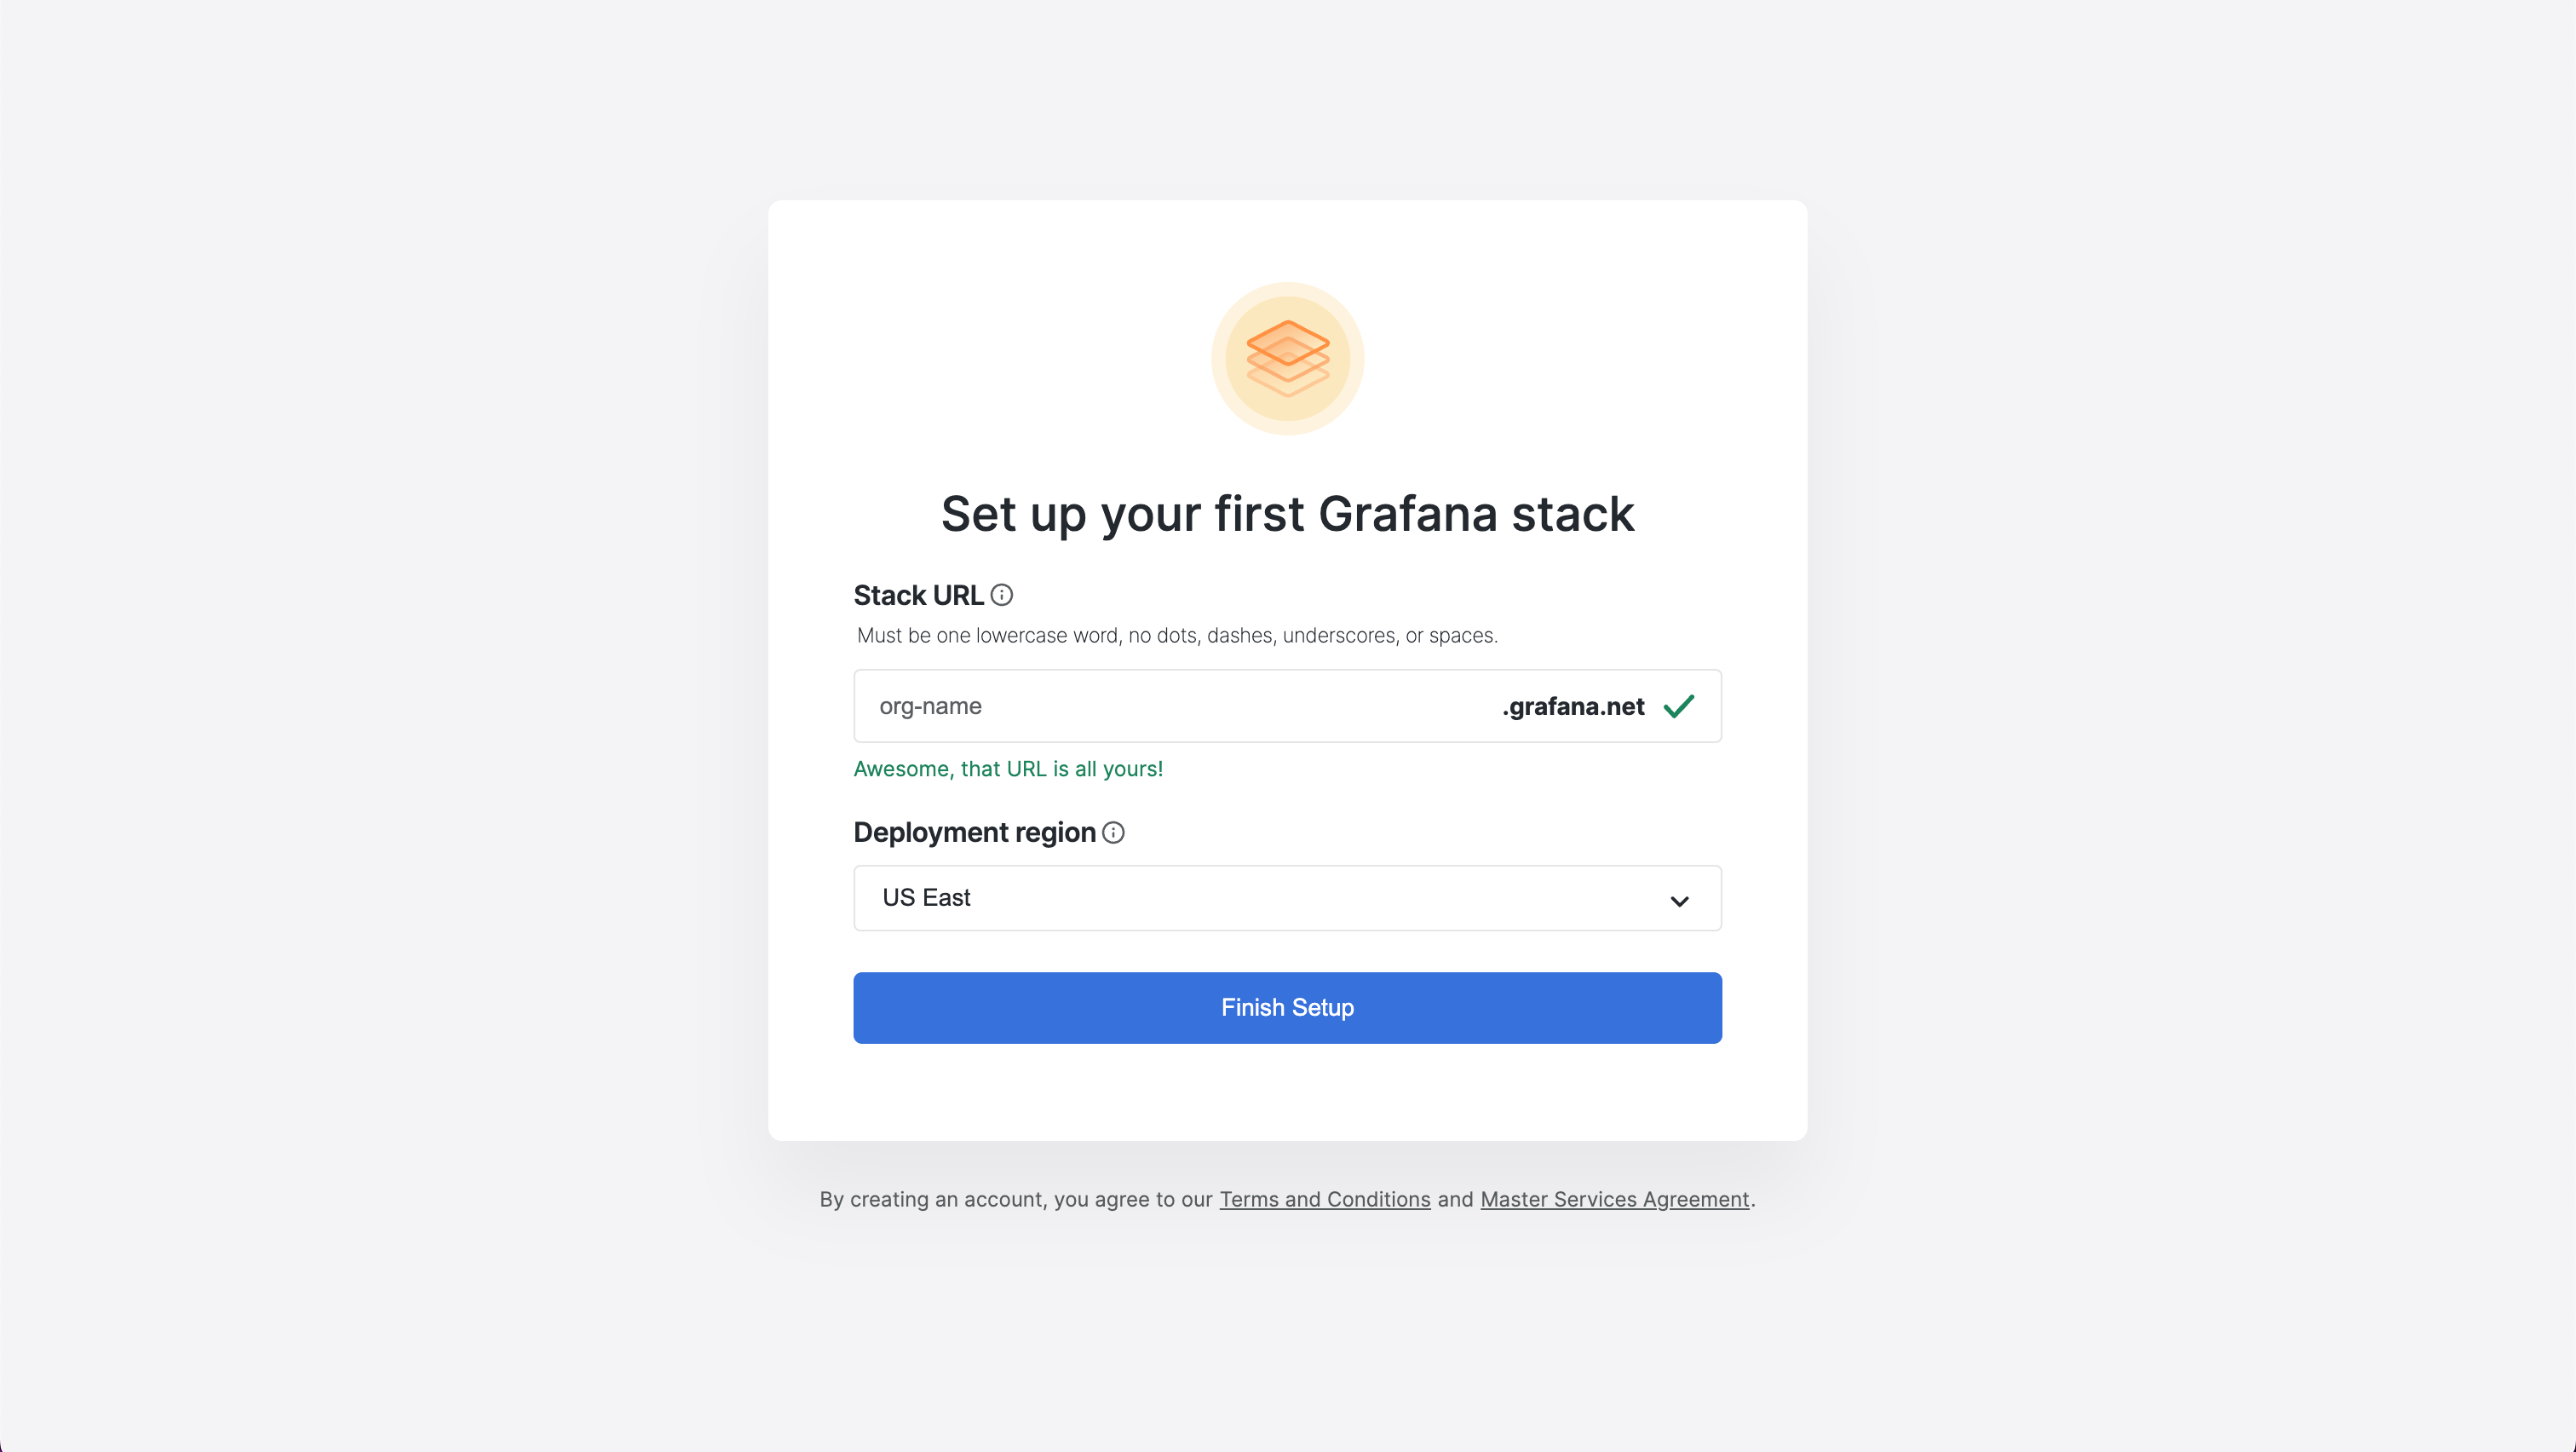
After logging in, you will be prompted to create a new stack if you don't have one.
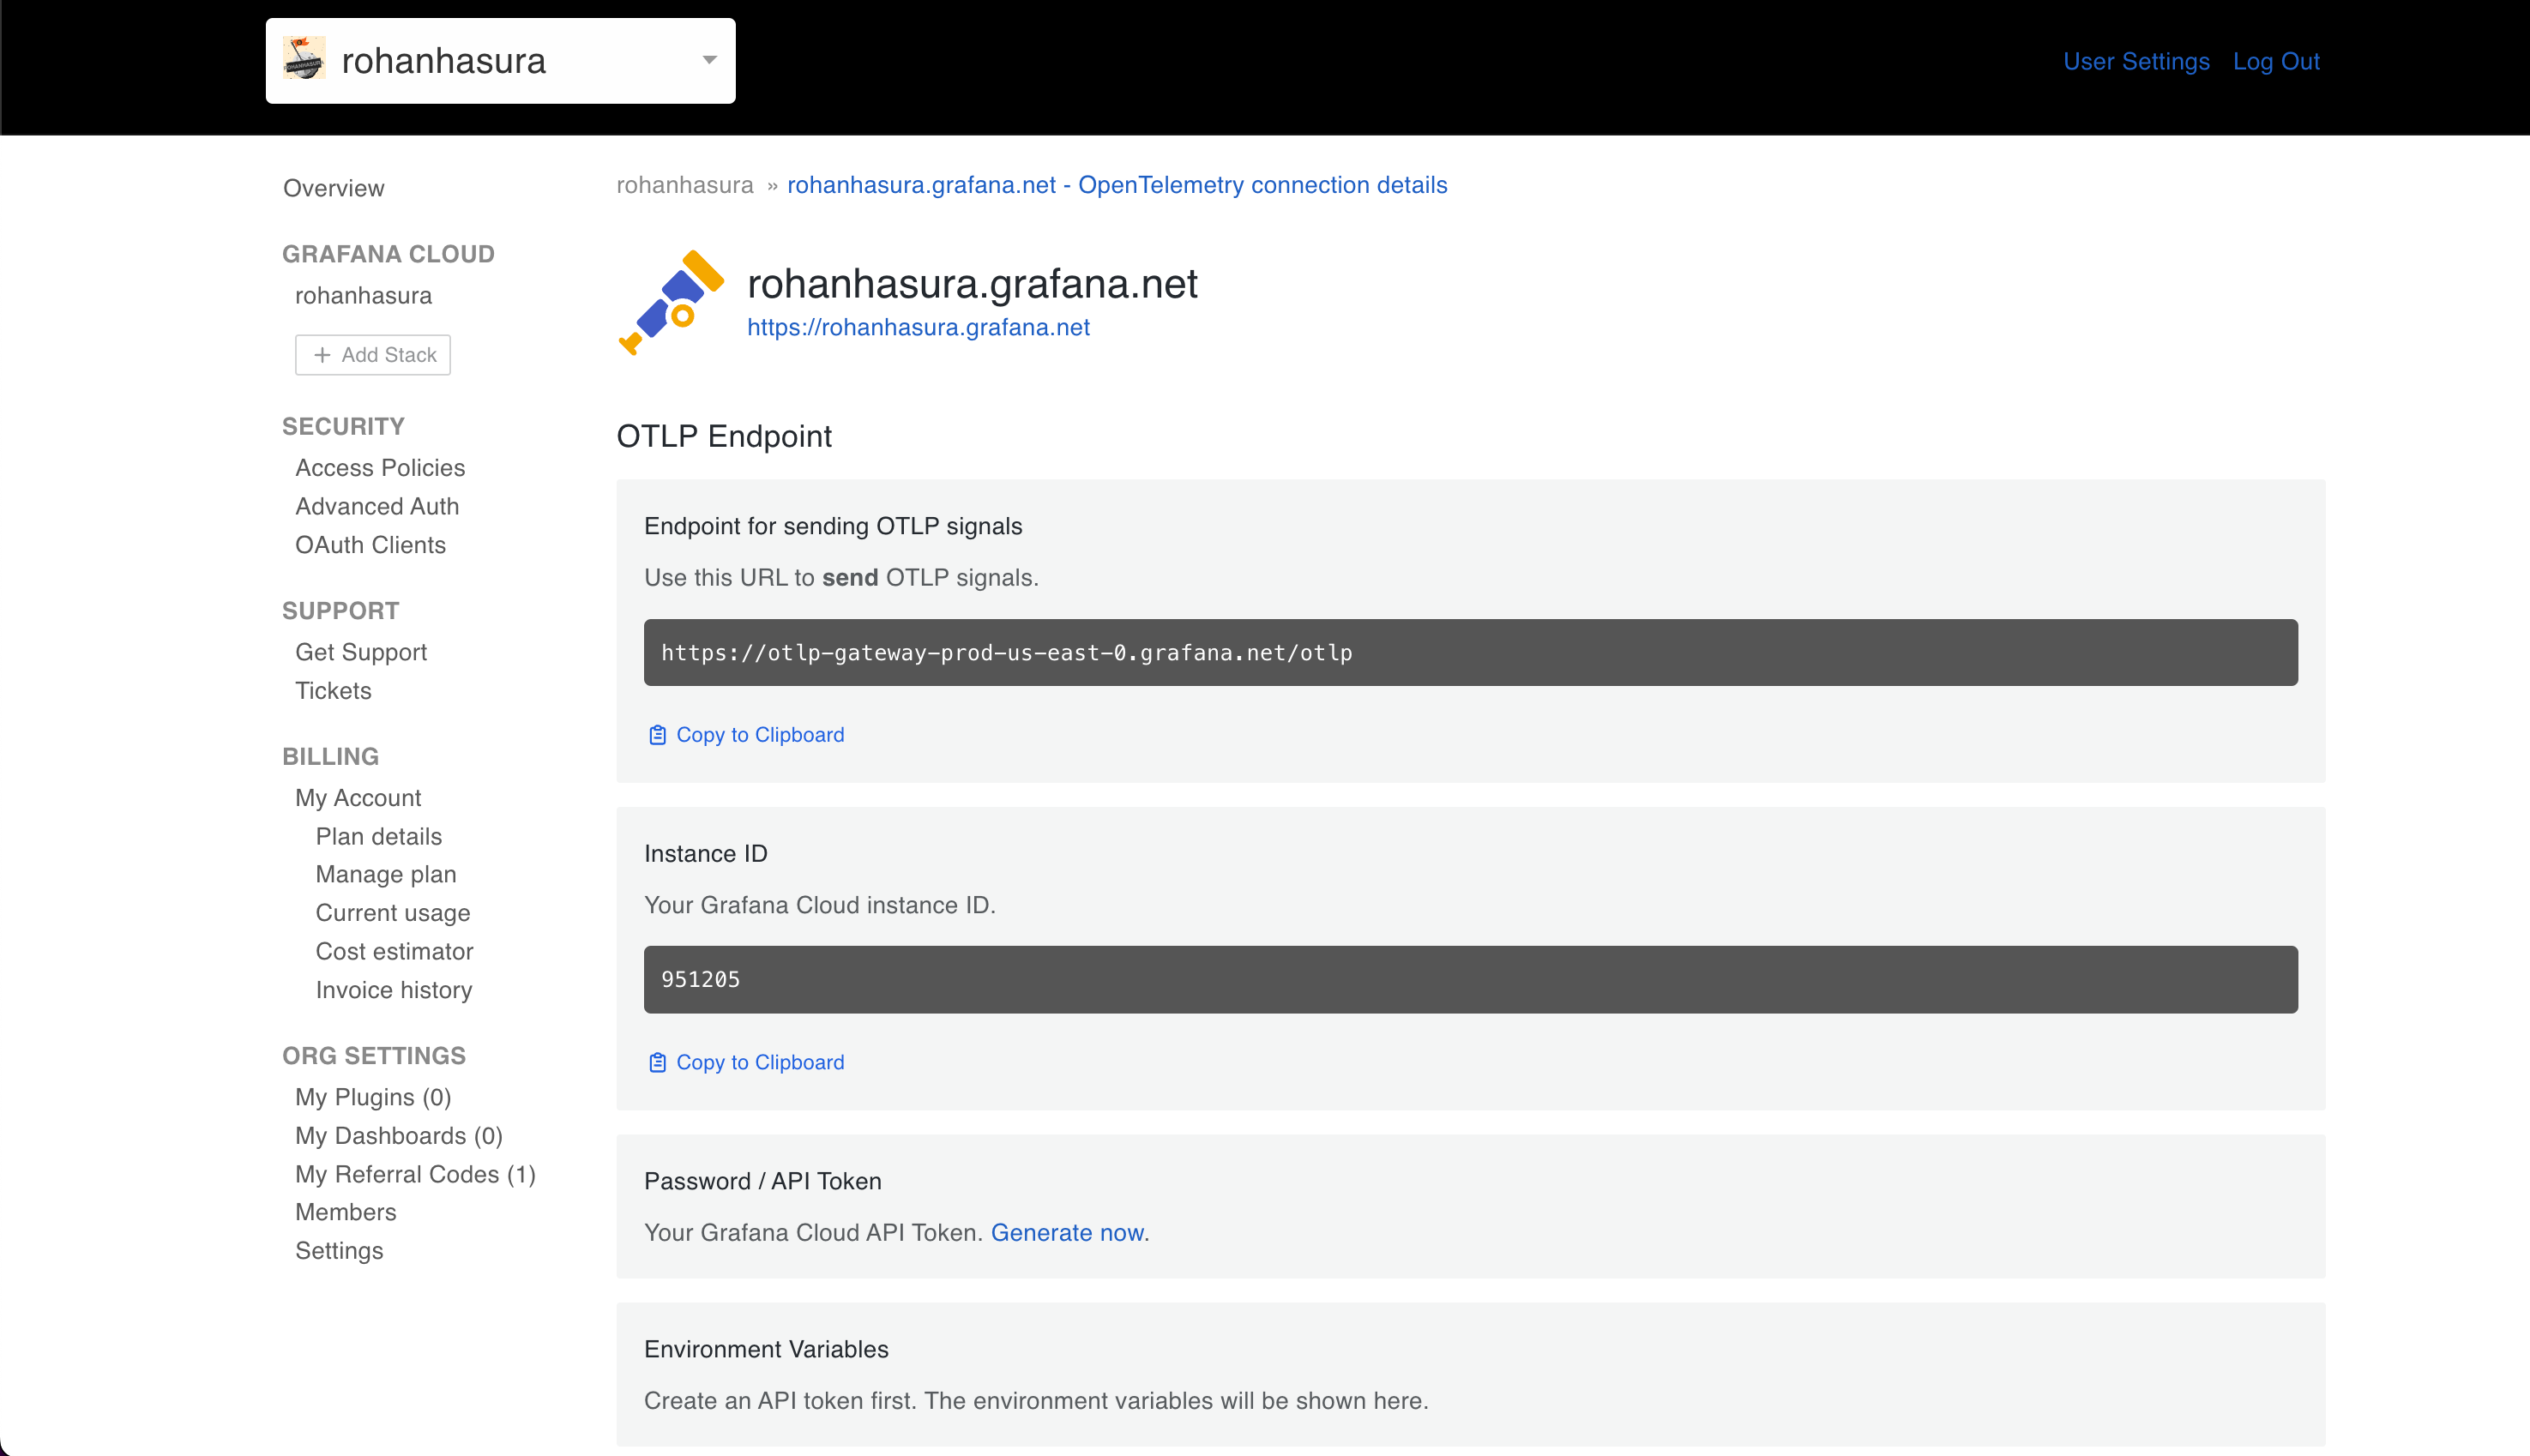
Get the OTLP Endpoint Details by going to your stack's details and then locatin gthe OTLP ednpoint URL and instance ID. Then, create an API token:
Step 2: Configure Hasura Cloud
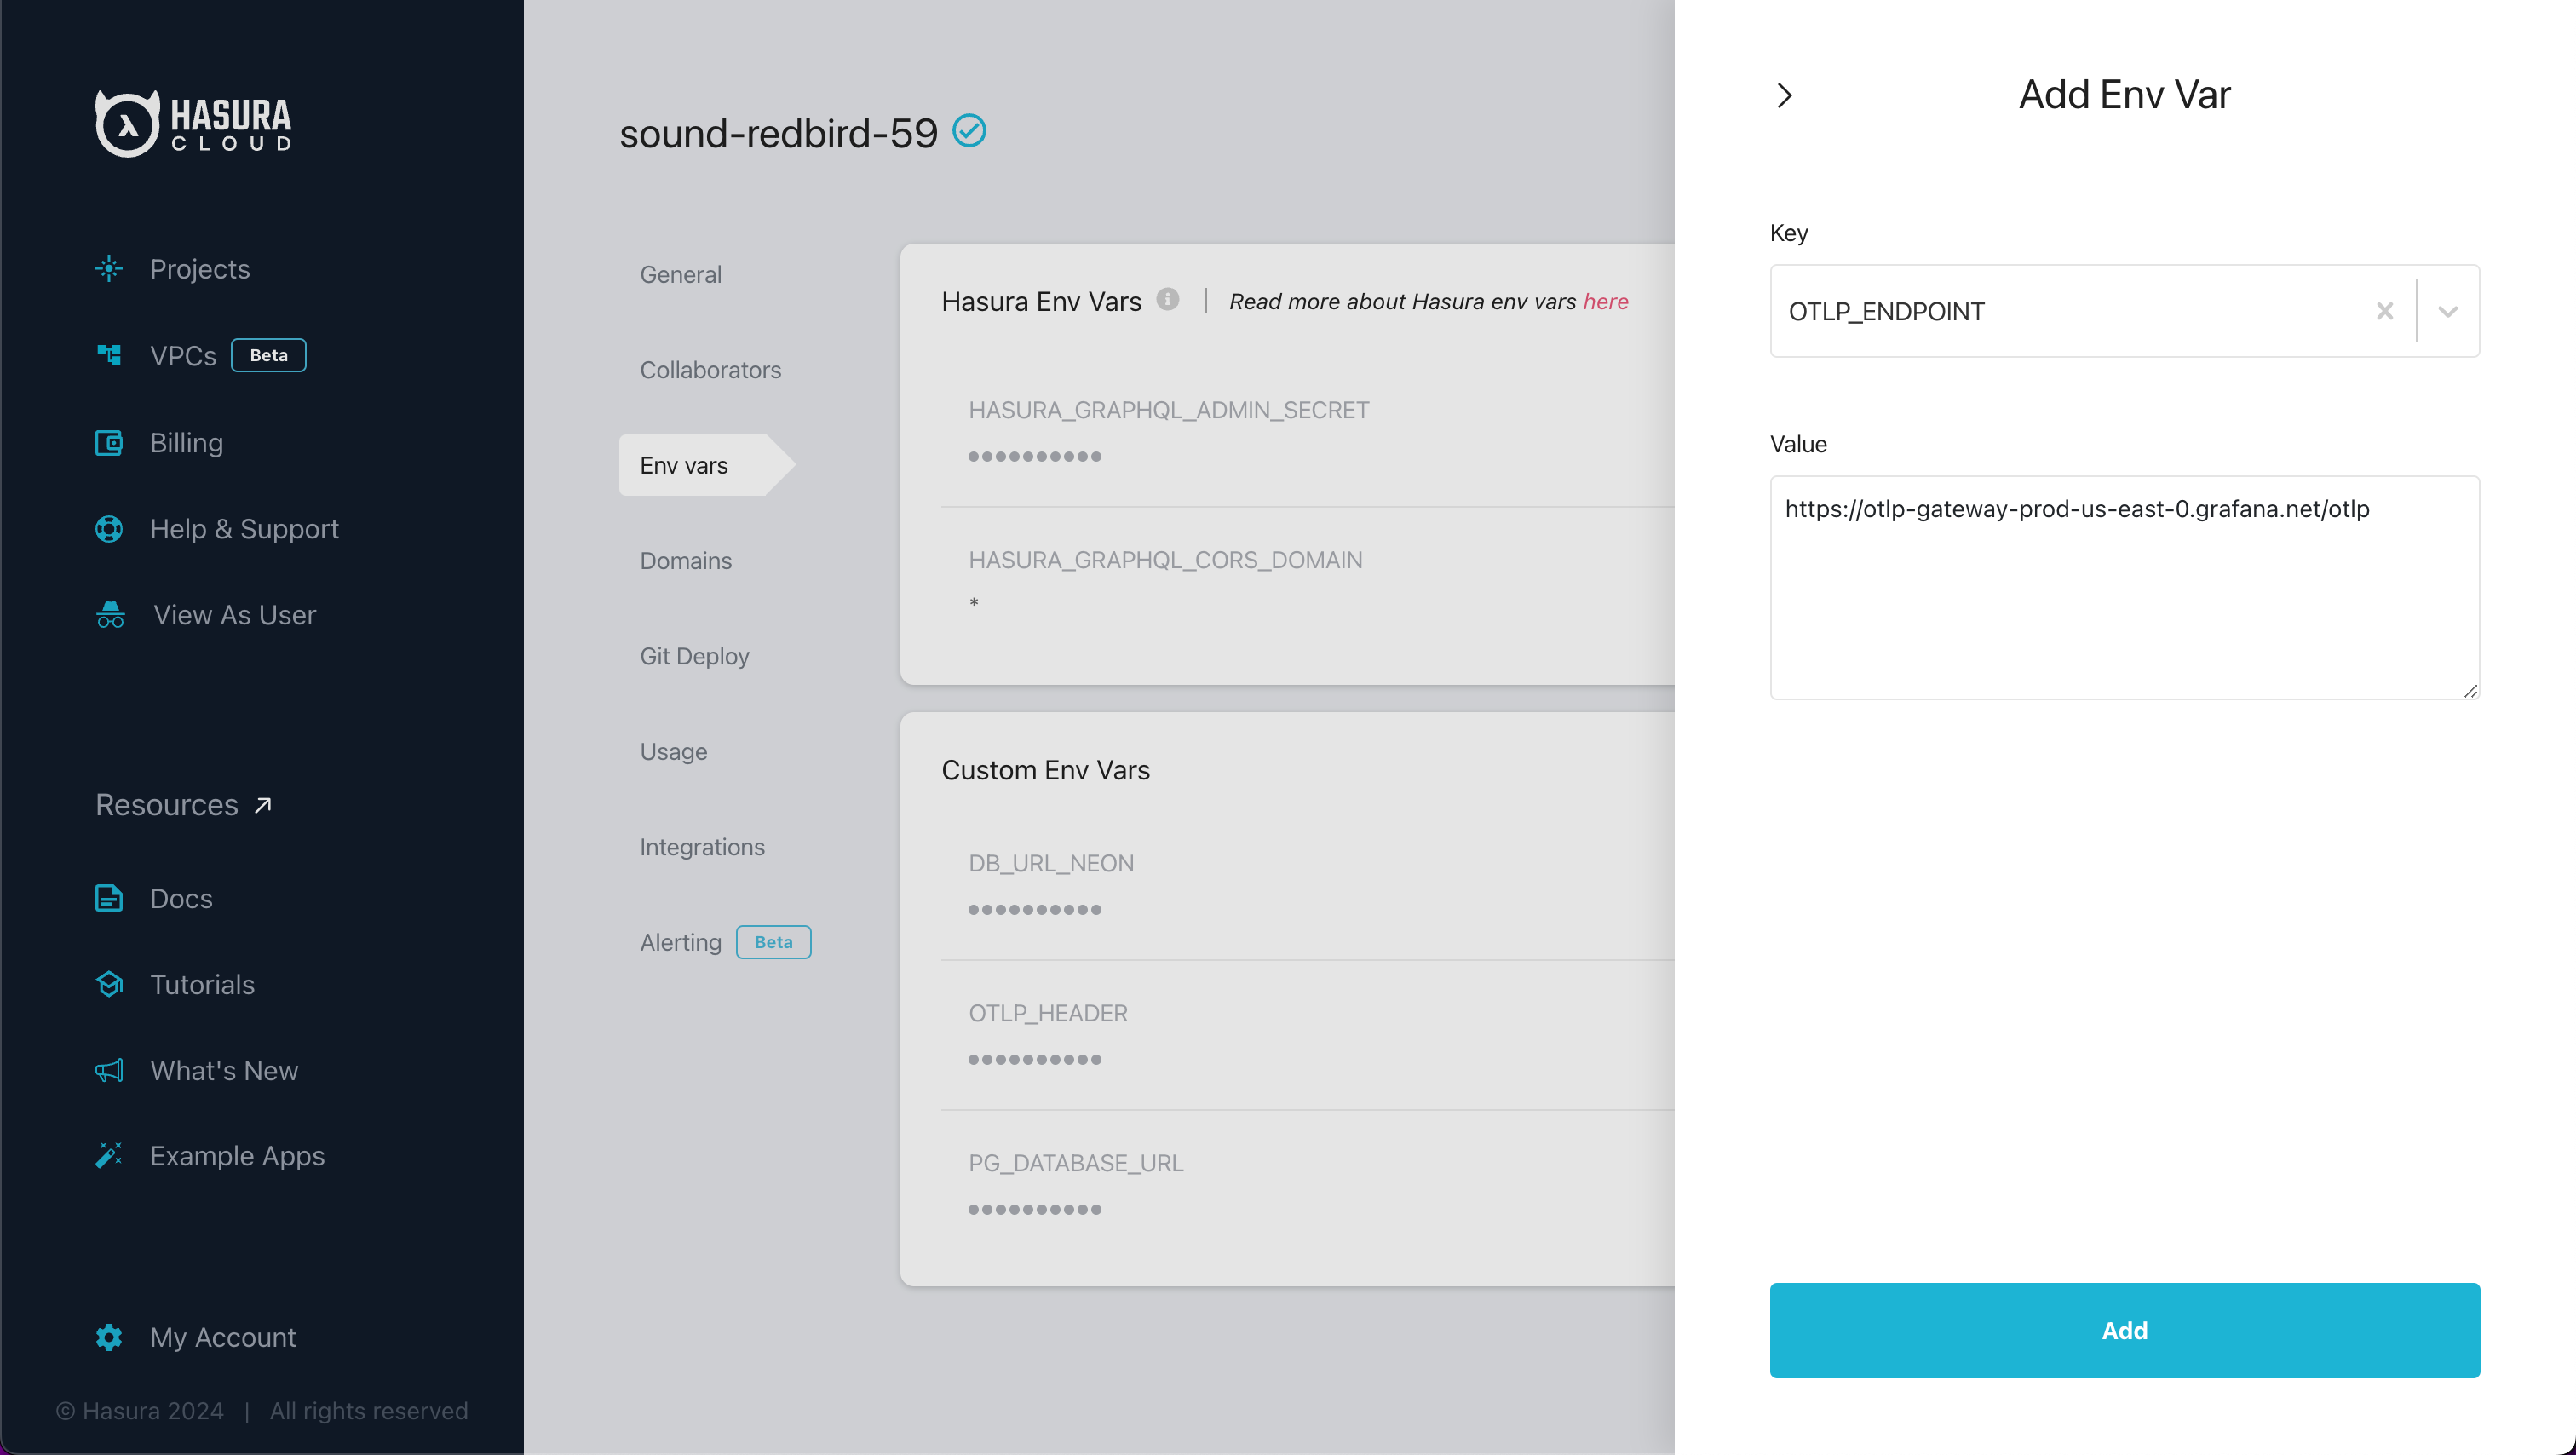
After logging into your Hasura Cloud account at hasura.io, go to your project's settings page and navigate to the project you want to configure. Then, open the settings page and add the OTLP Endpoint as an environment variable in Hasura Cloud.
- Key:
OTLP_ENDPOINT - Value:
https://your-grafana-cloud-otlp-endpoint
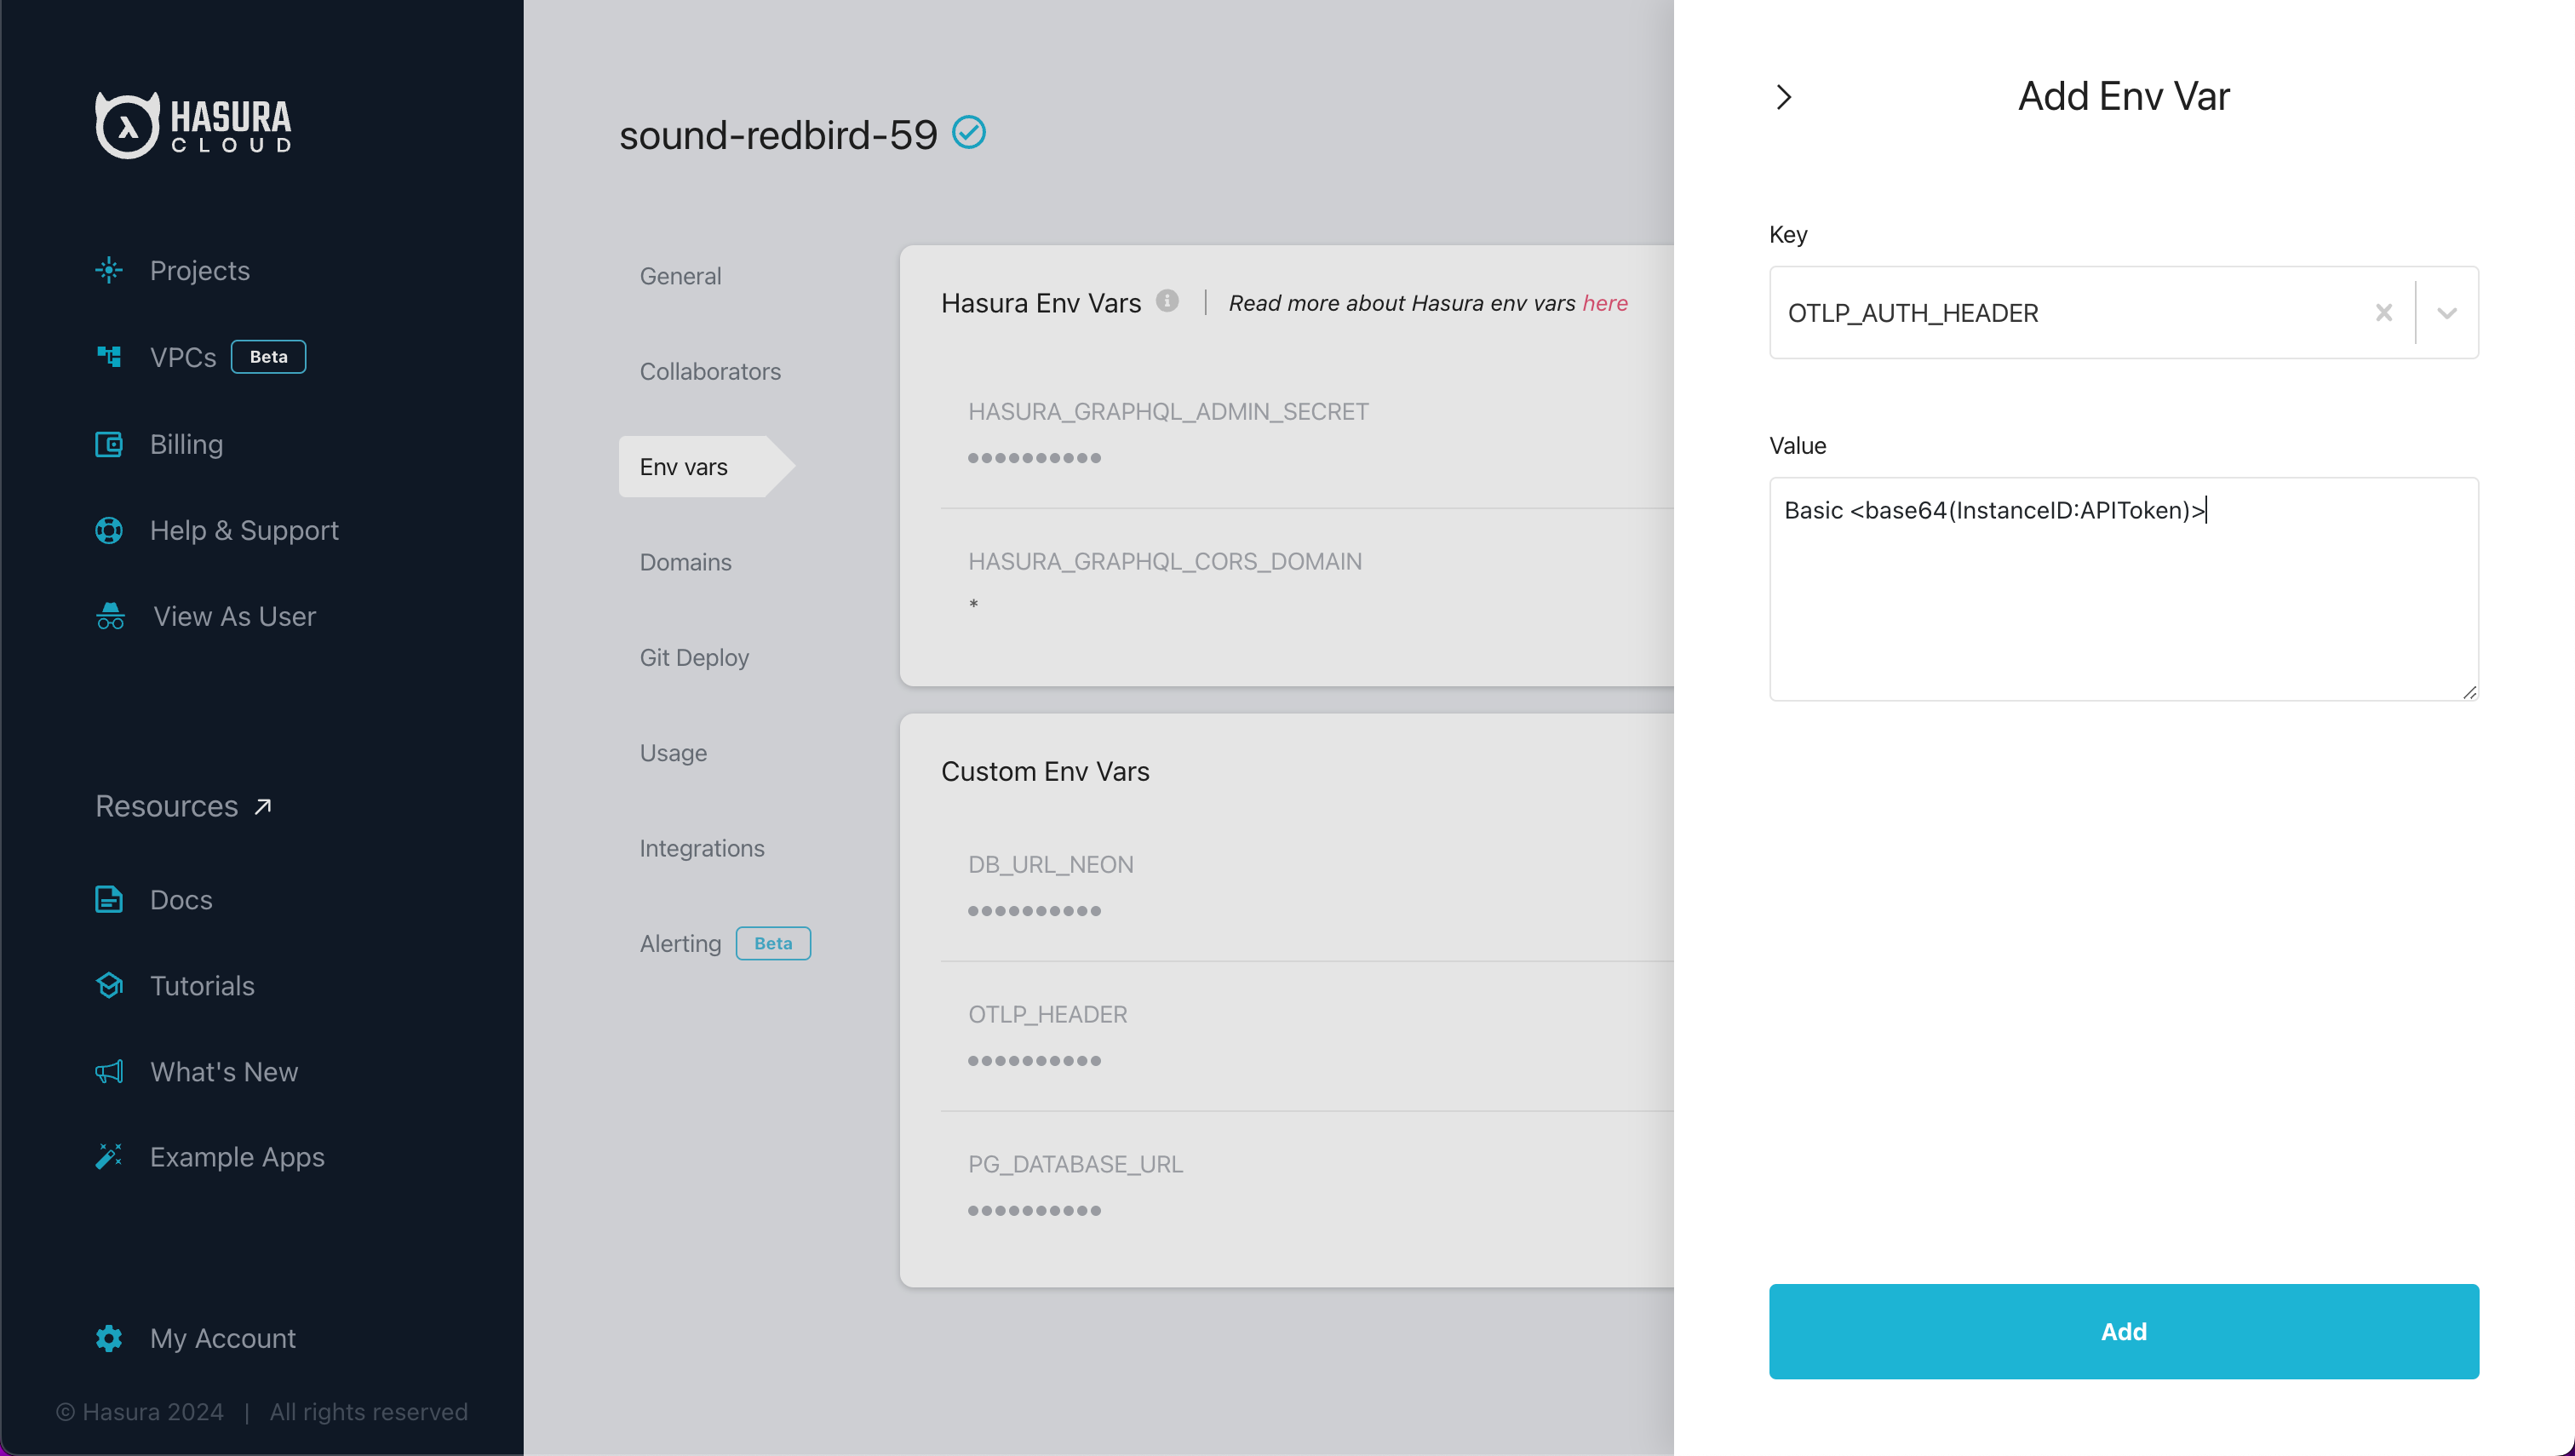
Next, add the OTLP authorization header as an environment variable in Hasura Cloud.
- Key:
OTLP_AUTH_HEADER - Value:
Basic <base64(InstanceID:APIToken)>
Then, configure the OpenTelemetry Exporter in Hasura Cloud by opening the project's Console and navigating to the
OpenTelemetry Exporter section of the settings tab.
Set the status to enabled and enter the details for the OTLP exporter:
Traces Endpoint:
{{OTLP_ENDPOINT}}/v1/tracesMetrics Endpoint:
{{OTLP_ENDPOINT}}/v1/metricsLogs Endpoint:
{{OTLP_ENDPOINT}}/v1/logsHeaders: Add the environment variable
OTLP_AUTH_HEADERas the value for theAuthorizationheader.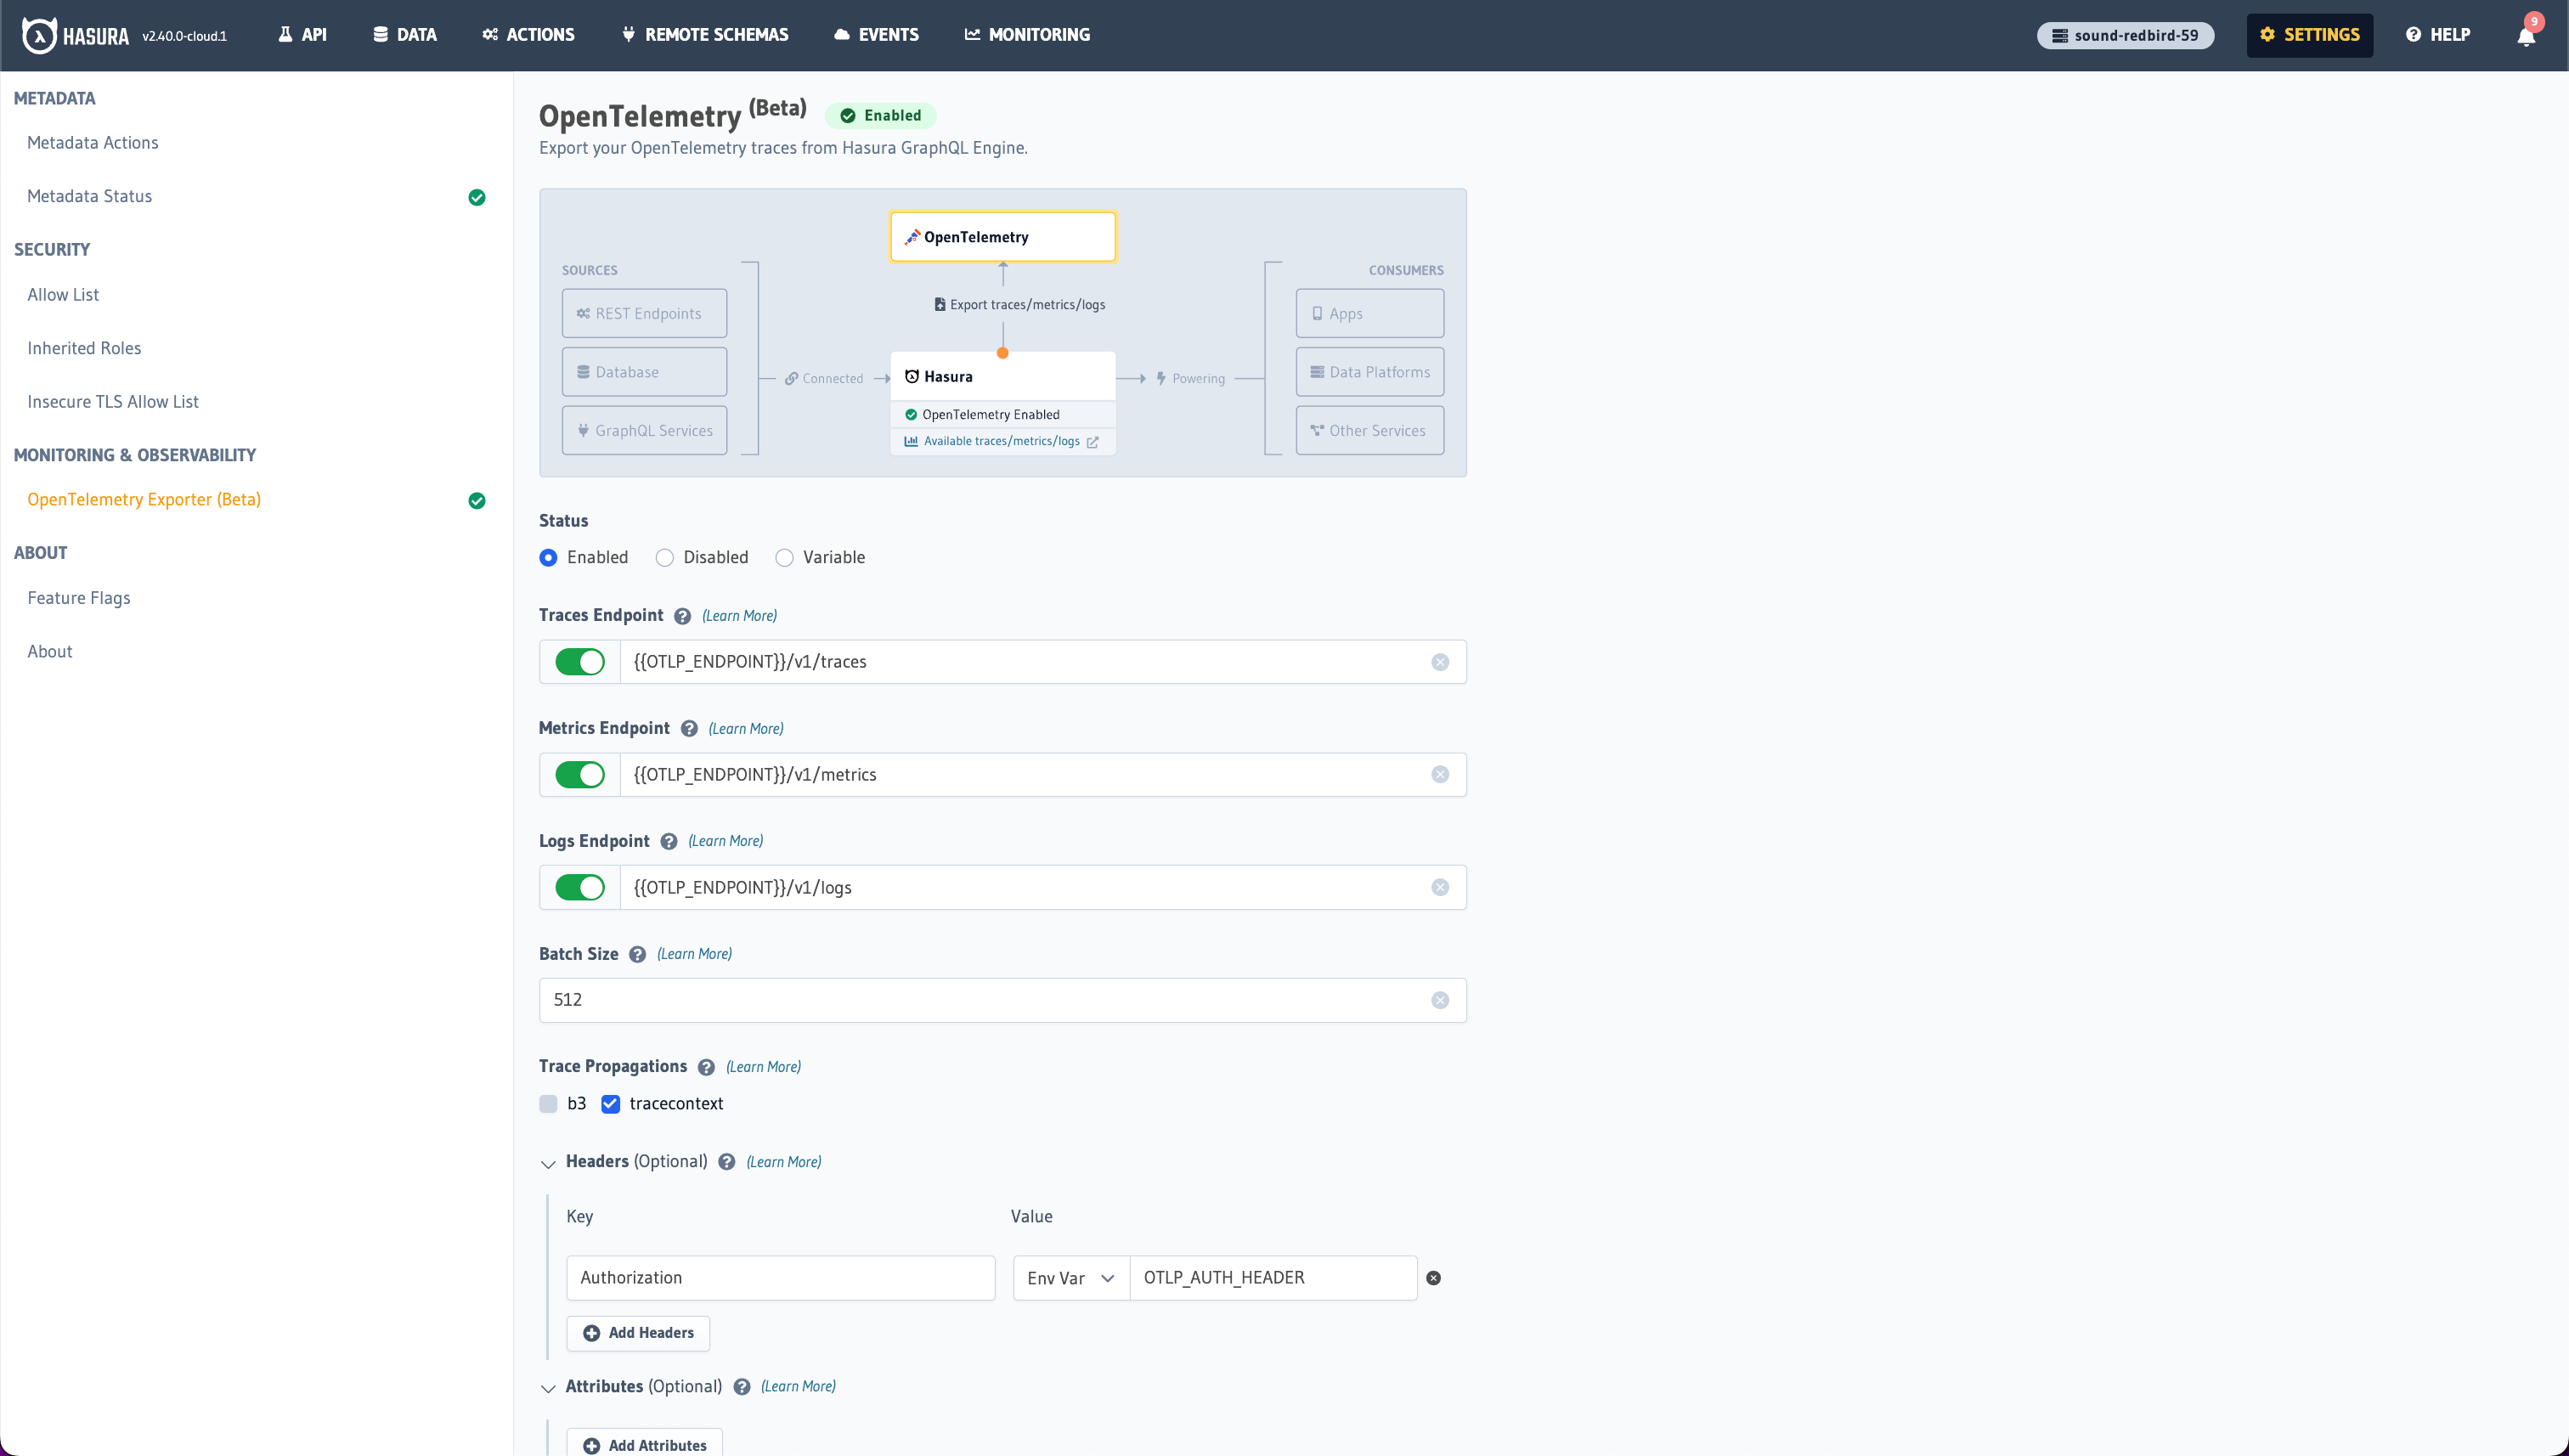
Finally, save and apply the configuration changes by clicking "Connect".
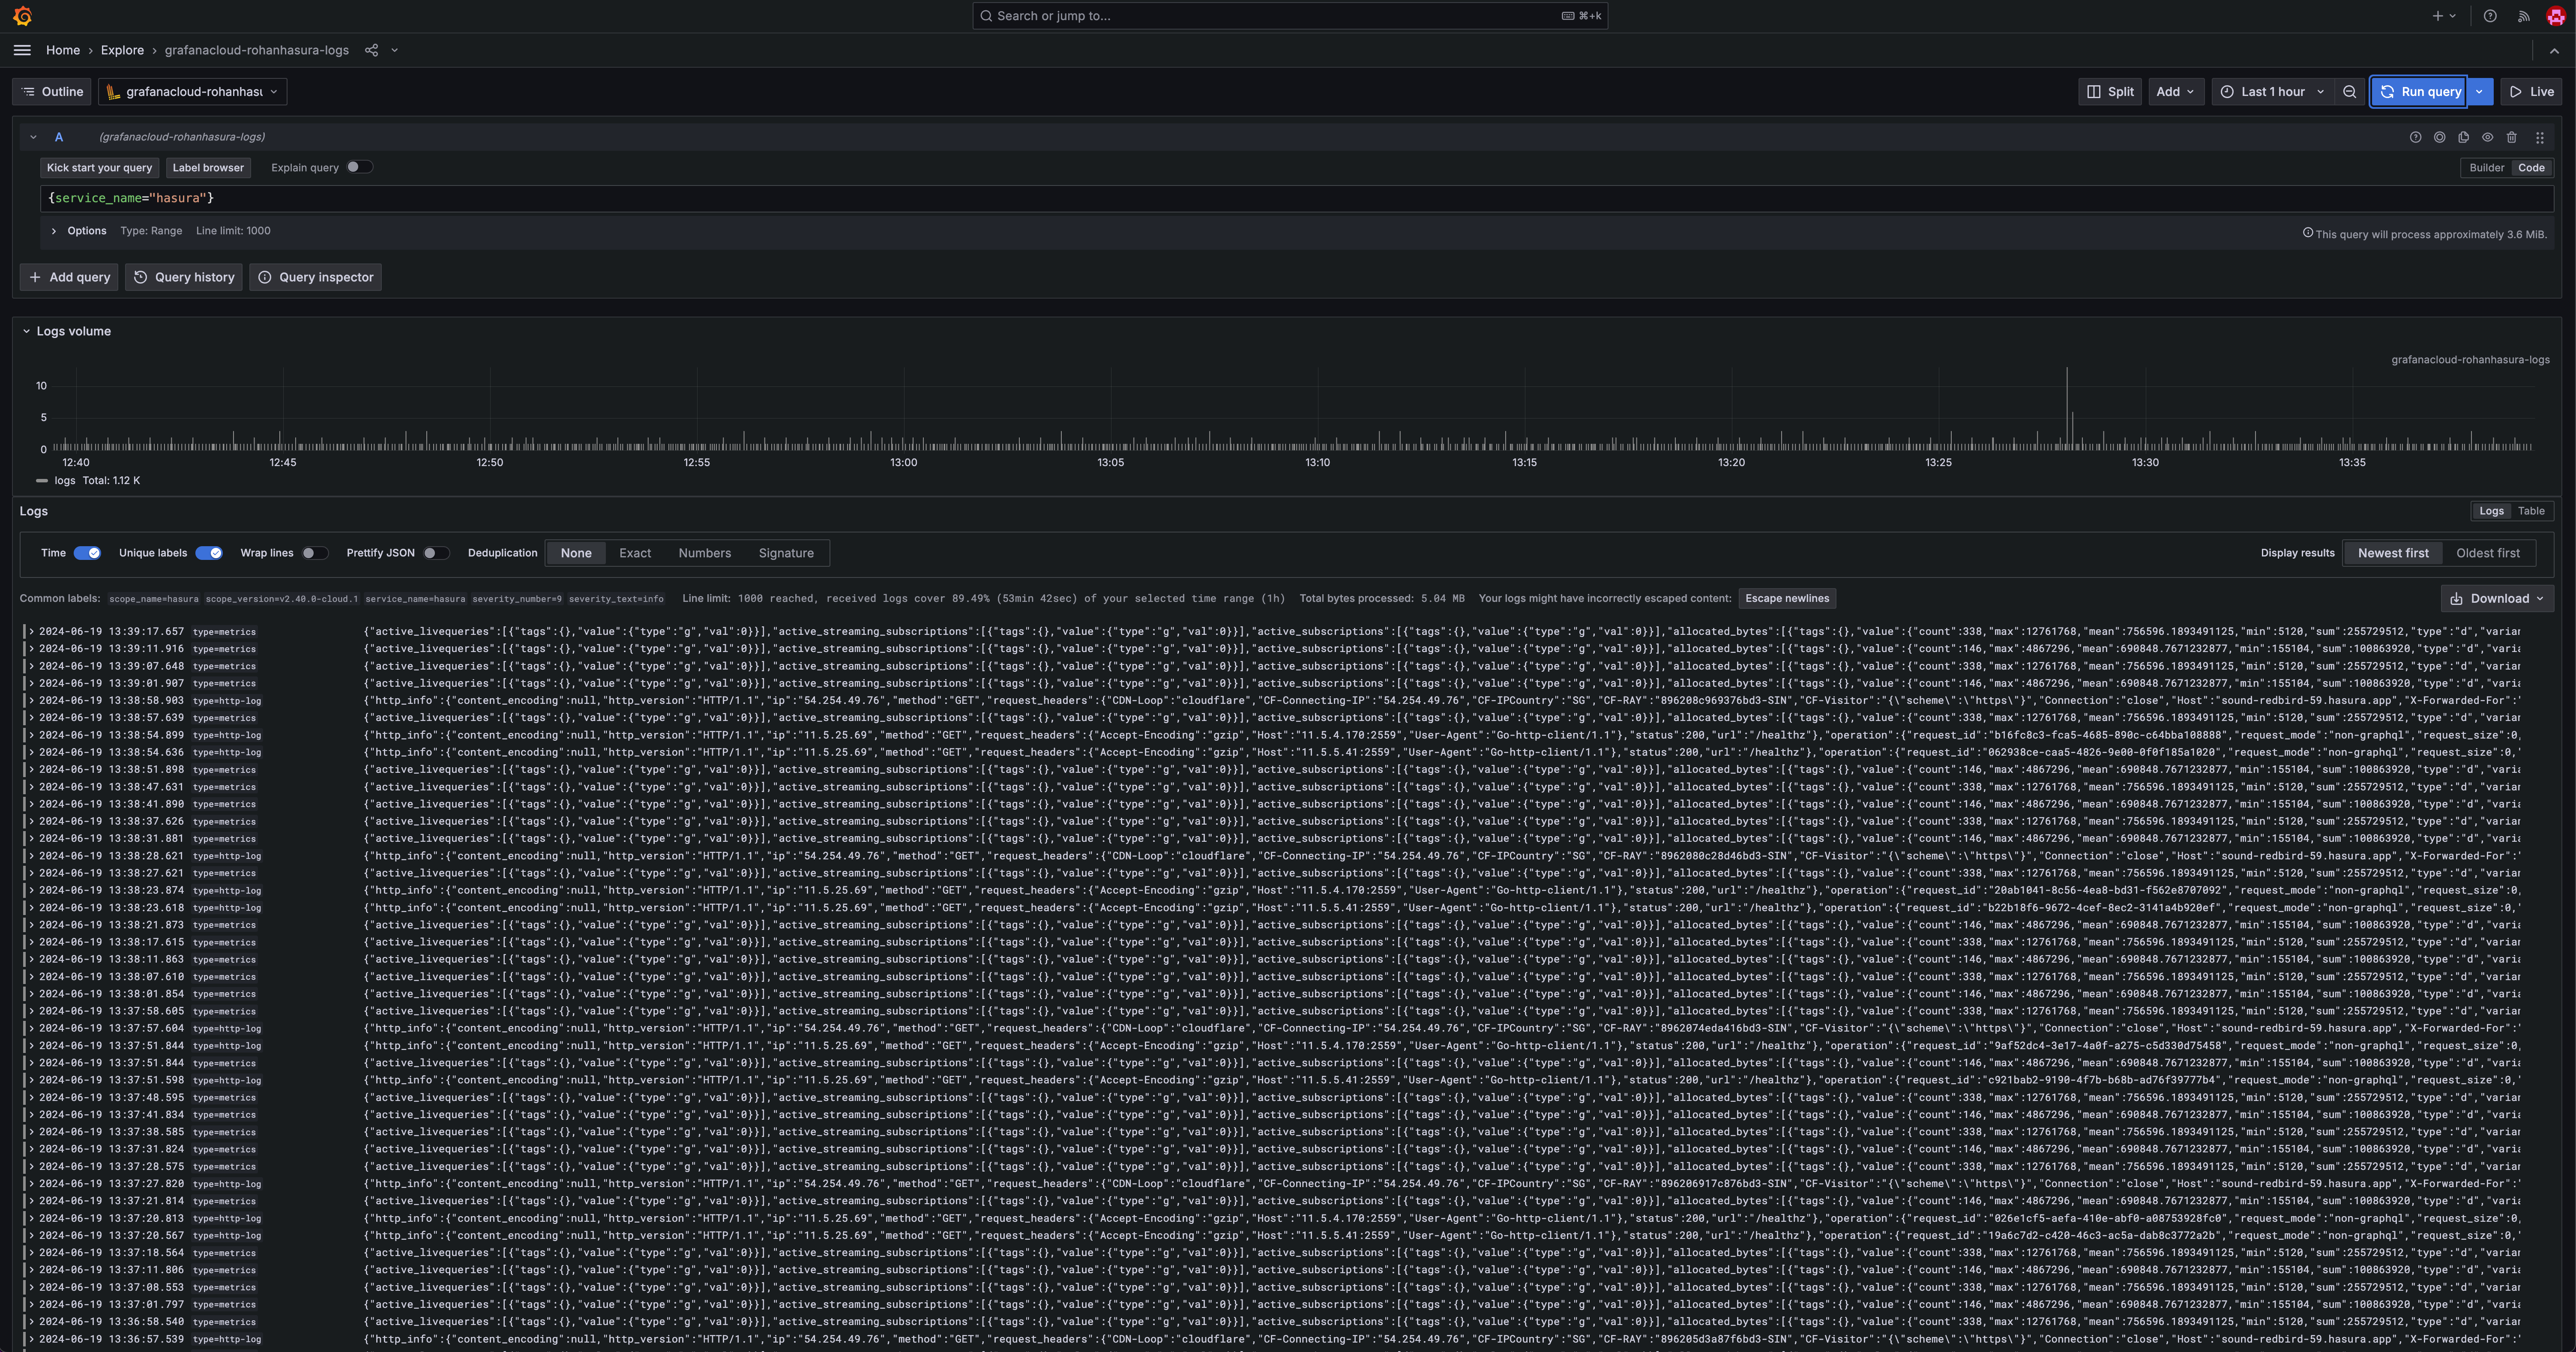
Step 3: Verify the integration
Perform some operations on your Hasura API to generate traces, metrics, and logs. Then log into you Grafana Cloud instance and navigate to the explore section to view the traces, metrics, and logs.
Step 4: Set up dashboards and alerts
There are some ready-made dashboards available for Hasura Cloud on Grafana's website here. Import these dashboards into your Grafana Cloud instance for immediate visualization of your Hasura Cloud metrics.
Additionally, you can use the Grafana UI to create additional custom dashboards that visualize the traces and metrics from Hasura.
You can also set up alerts on this data in Grafana Cloud to monitor your Hasura Cloud instance effectively.
For more detailed information, refer to the Hasura OpenTelemetry documentation. By following these steps, you can successfully integrate Grafana Cloud's OTLP endpoint with Hasura Cloud, import ready-made dashboards, and start monitoring your distributed traces effectively.