Export Traces, Metrics and Logs to OpenTelemetry Compliant Receiver from Hasura
Introduction
Distributed traces track and map journeys of user requests across various services or components which can then be analyzed via observability tools.
Traces are typically used to diagnose or debug which part of your application could potentially be responsible for a failure or error state and to monitor the performance of end-user interactions with your application.
Traces are generated by instrumenting application code. Hasura has instrumented all API queries, mutations and
subscriptions with the OpenTelemetry format. These traces can
be exported directly from your Hasura instances to your observability tool that supports OpenTelemetry traces. This can
be configured in the Settings section of the Hasura Console.
Configure the OpenTelemetry receiver
OpenTelemetry traces are supported for Hasura GraphQL Engine versions v2.18.0 and above on Self-Hosted Enterprise,
with support for metrics export added in v2.31.0 and for logs export added in v2.35.0. Also, available to all cloud
tiers.
We have deprecated the previous Open Telemetry exporter integration on Hasura Cloud in favor of this native feature, and
you can now configure this directly via the Hasura Console's Settings page under the Monitoring & Observability
section.
All users are encouraged to migrate to this new integration.
Hasura Cloud implements sampling on traces. That means only one in every n traces will be sampled and exported (n
will be automatically configured based on various parameters during runtime. This can't be manually adjusted).
- Console
- CLI
- API
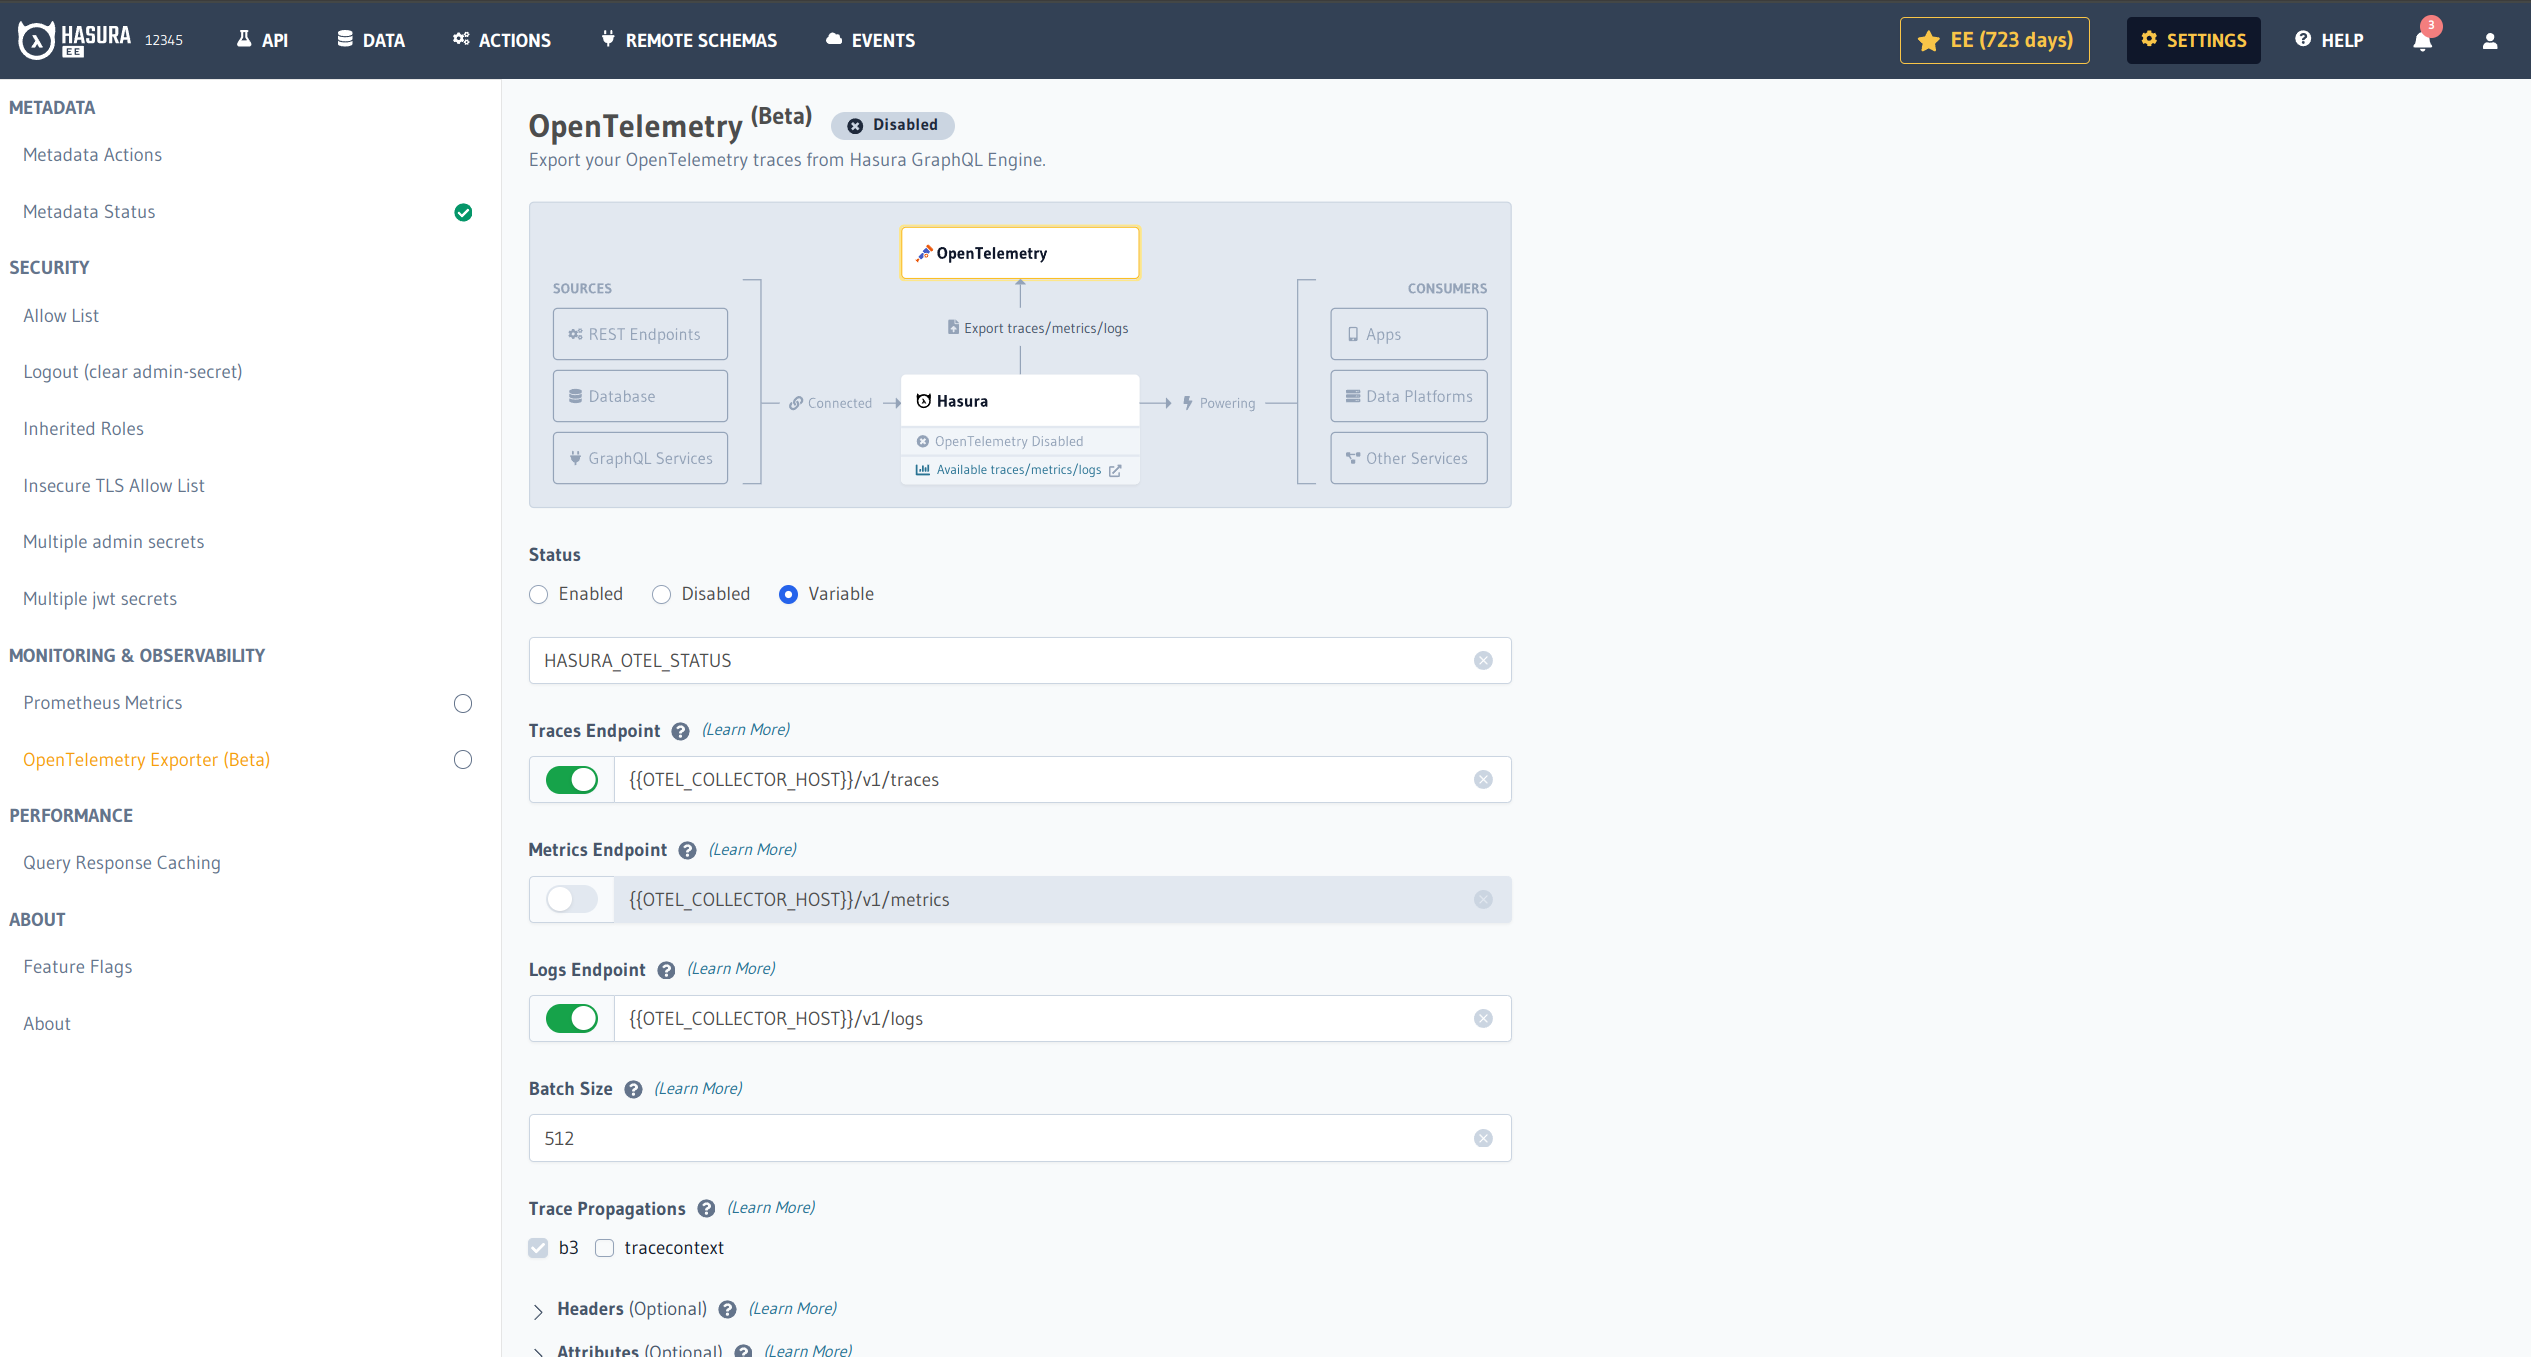
Go to the Settings tab (⚙) in the console and click on OpenTelemetry Exporter. After adding appropriate values to
the parameters, click Update and then toggle the Status button to enable the integration.
Create and update parameters in the file opentelemetry.yaml inside the metadata directory as follows:
status: enabled # accept enabled, disabled or env template {{ENV_NAME}}
data_types:
  - traces
  - metrics
  - logs
exporter_otlp:
  headers:
    - name: x-test-header
      value: testing
    - name: x-header-from-env
      value_from_env: TEST_ENV_VAR
  resource_attributes:
    - name: stage
      value: production
    - name: region
      value: us-east
  otlp_traces_endpoint: http://host.docker.internal:4318/v1/traces
  otlp_metrics_endpoint: http://host.docker.internal:4318/v1/metrics
  otlp_logs_endpoint: http://host.docker.internal:4318/v1/logs
  protocol: http/protobuf
  traces_propagators:
    - tracecontext
batch_span_processor:
  max_export_batch_size: 512
Apply the Metadata by running:
hasura metadata apply
Parameters
The following parameters are needed to set up the integration with your observability tool:
Endpoint
The OpenTelemetry compliant receiver endpoint. The URL scheme (http or https) determines if SSL(TLS) should be used
for the communication. Please check the documentation for your observability tool to determine how to set up an
OpenTelemetry endpoint. There may be different endpoints provided for the HTTP and gRPC protocols (gRPC is not
supported yet), so ensure that you use the appropriate endpoint for your chosen connection type.
Endpoint Notes
- Environment variable templating is available for the endpoint URL, e.g.
https://{{ENV_VAR}}/v1/traces - You may need to append
/v1/tracesor/v1/metricsto the end of the receiver endpoint URL if the provided URL does not contain this already. This depends on the observability vendor. - If you are running Hasura as a Docker container without host networking enabled, and want to connect to a local
OpenTelemetry Collector, you may want to use this as the endpoint:
http://host.docker.internal:4318/v1/traces. - If the
httpsendpoint uses a custom or self-signed CA, add the endpoint to the Insecure TLS Allow List.
It is a generally accepted convention that the OpenTelemetry receiver endpoint is exposed on port 4318 for HTTP but
can usually be customized. Please check the documentation for your observability tool to determine the port number.
Connection Type
The protocol and transport to be used for the communication with the receiver. Hasura currently only supports the OpenTelemetry Protocol over HTTP (OTLP/HTTP with binary-encoded Protobuf payloads).
Data Type
Selects the type of observability data points to be exported. Traces, Logs and Metrics are the only data types
that are currently supported.
Batch Size
Batch size is the maximum number of data points (spans in the context of traces) allowed per export request made to the observability tool. Default size is 512.
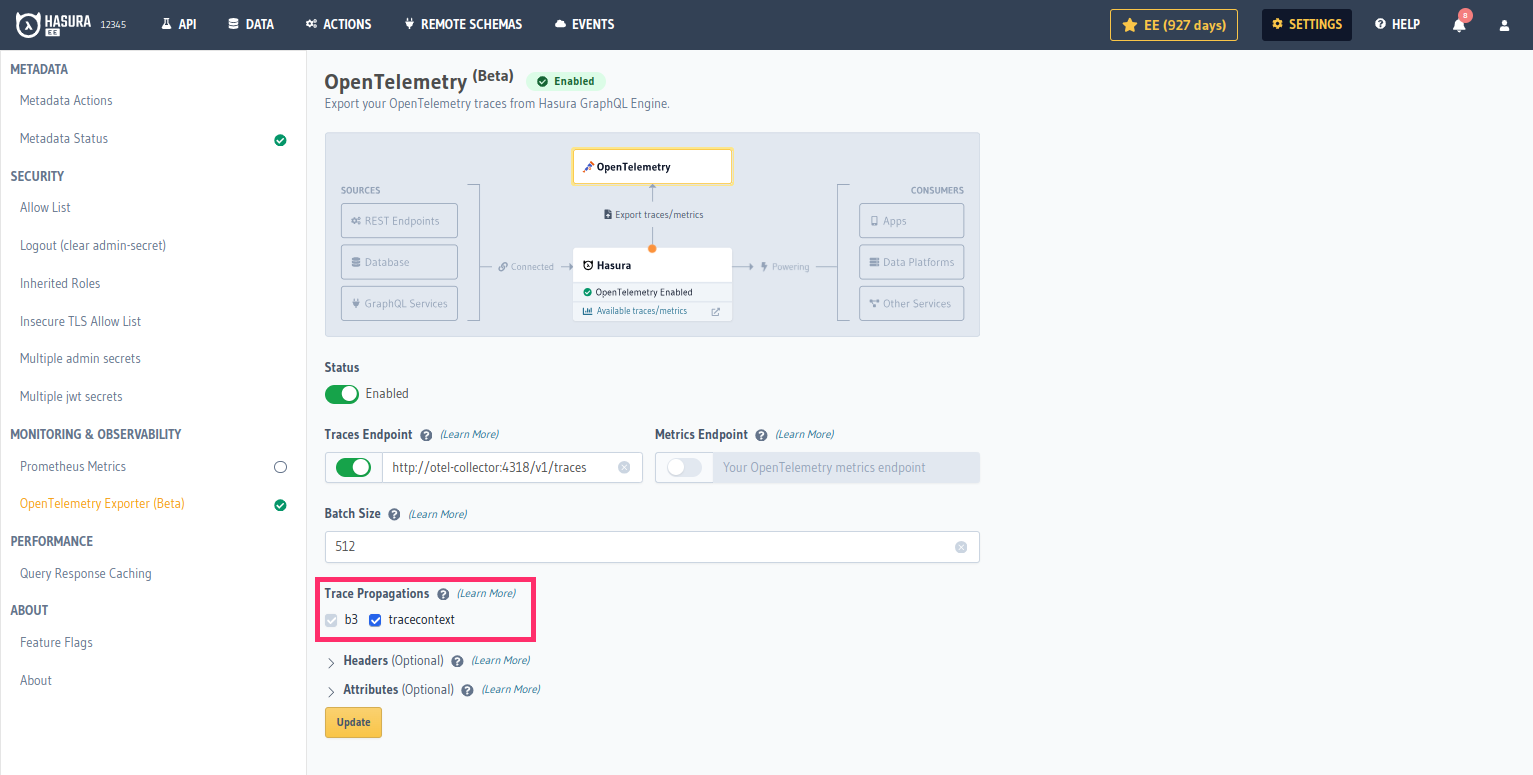
Trace Propagations
Trace Propagation implements the mechanism that exchanges context between services and processes. It serializes or deserializes the context object and provides the relevant trace information to be propagated from one service to another. GraphQL Engine supports the following propagation mechanisms:
W3C Trace Context is supported for Hasura GraphQL Engine versions v2.35.0 and above.
B3 propagation is enabled by default. You can enable other protocols in the OpenTelemetry Exporter configuration.
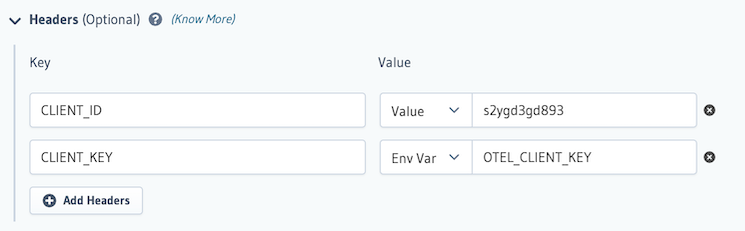
Headers
Headers are (optionally) added to every request made by Hasura to the observability tool. They are generally Authorization/API keys with the required role/permissions to accept OpenTelemetry data. Please refer to the documentation in your observability tool to understand how required request headers need to be formatted. You can use an environment variable as a header value too. This is important for values which are sensitive.
If you use an environment variable as a header value, please make sure that it's applied to the Hasura Docker container before starting the container.
Example using Console:
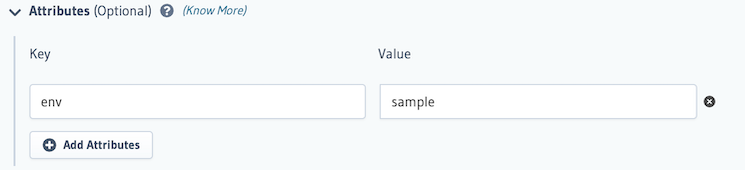
Attributes
Resource attributes are (optional) custom tags that are sent alongside observability data in order to identify the entity for which the observability data was recorded. This is usually used to identify sources in a distributed tracing environment and aids in granular filtering and analytics.
Example using Console:
Your observability tool may expect to receive certain resource attributes in order to provide full functionality; such resource attributes must be set with this parameter. Many, but not all, of these resource attributes will be OpenTelemetry Semantic Conventions.
Hasura automatically sets some resource attributes. The values of such attributes can be overridden by specifying your own value for the attribute using this parameter.
Default resource attributes
| Attribute | Type | Default |
|---|---|---|
| service.name | string | hasura |
Hasura currently only supports string-valued attributes.
Consuming and visualizing traces
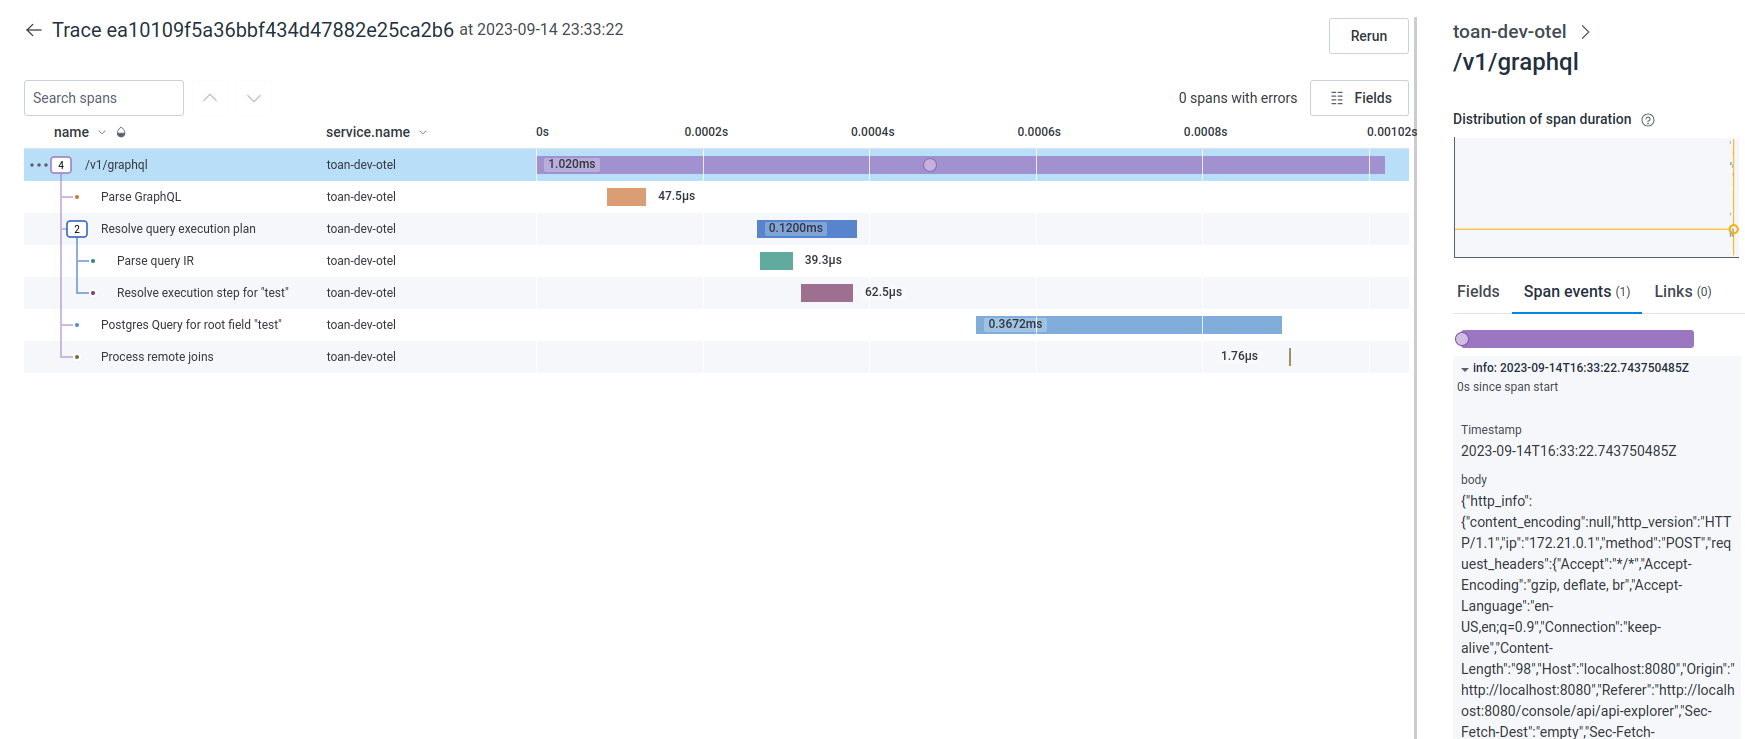
You can utilize your observability tool's UI to visualize and perform further analytics on trace data to monitor, diagnose and troubleshoot your application. Typically, traces and their spans are listed out and selecting a trace shows a flame graph containing a visual representation of where the operation spent its execution time. Below, we provide some examples of how to consume and visualize traces using popular observability tools.
Jaeger
To use Jaeger, simply add this to your docker-compose.yaml:
jaeger:
  image: jaegertracing/all-in-one:1.37
  restart: always
  ports:
    - 5775:5775/udp
    - 6831:6831/udp
    - 6832:6832/udp
    - 5778:5778
    - 4002:16686
    - 14250:14250
    - 14268:14268
    - 14269:14269
    - 4317:4317 # OTLP gRPC
    - 4318:4318 # OTLP HTTP
    - 9411:9411
  environment:
    COLLECTOR_OTLP_ENABLED: 'true'
    COLLECTOR_ZIPKIN_HOST_PORT: '9411'
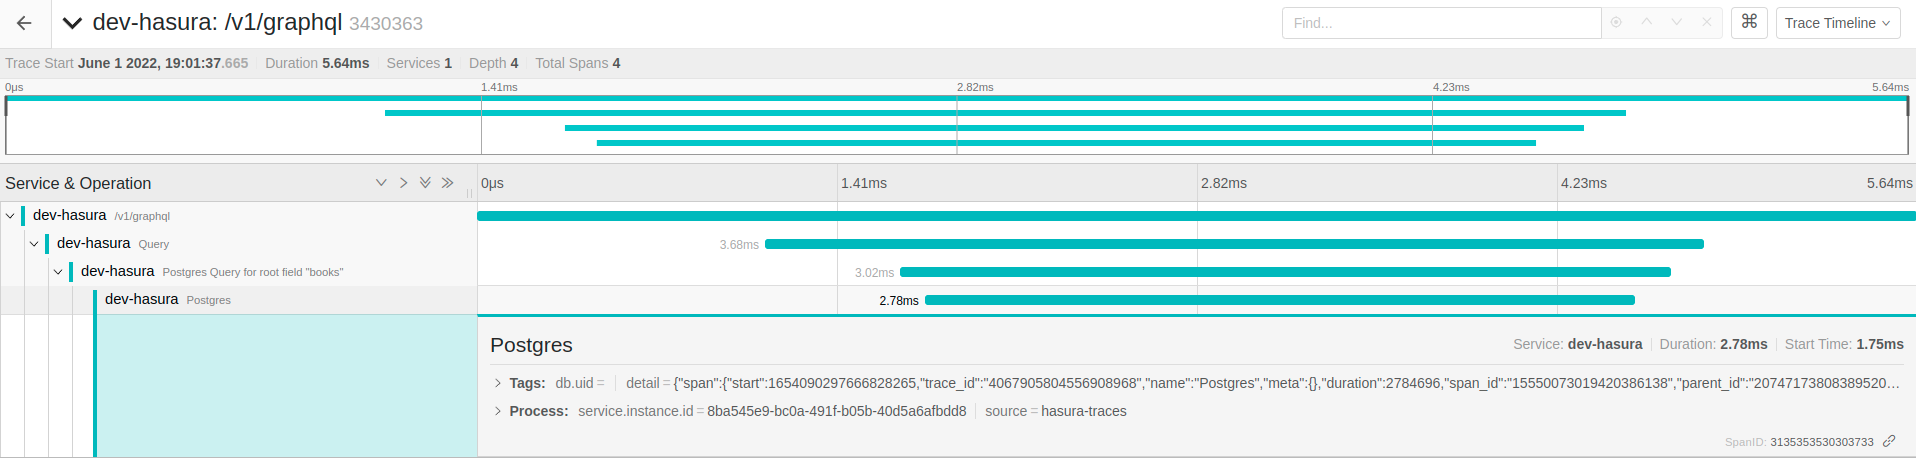
The image below shows a flame graph in Jaeger where a query took 5.64 milliseconds in total, of which 2.78 milliseconds was the actual Postgres database processing the query.
OpenTelemetry Collector
OpenTelemetry provides the OpenTelemetry Collector that can export OpenTelemetry data to observability tools that do not support native OpenTelemetry ingestion.
To work with such observability tools, Hasura's OpenTelemetry integration can be configured to send OpenTelemetry data to the collector.
This collector should be run in your infrastructure and should be reachable by the Hasura backend that is configured to send the data to it. The list of supported exporter targets can be found in the OpenTelemetry Collector repository.
Available Traces
GraphQL Engine traces activities of:
- Metadata APIs (
/v1/metadata) - Schema APIs (
/v2/query) - GraphQL API (
/v1/graphql) - Event triggers
- Scheduled triggers
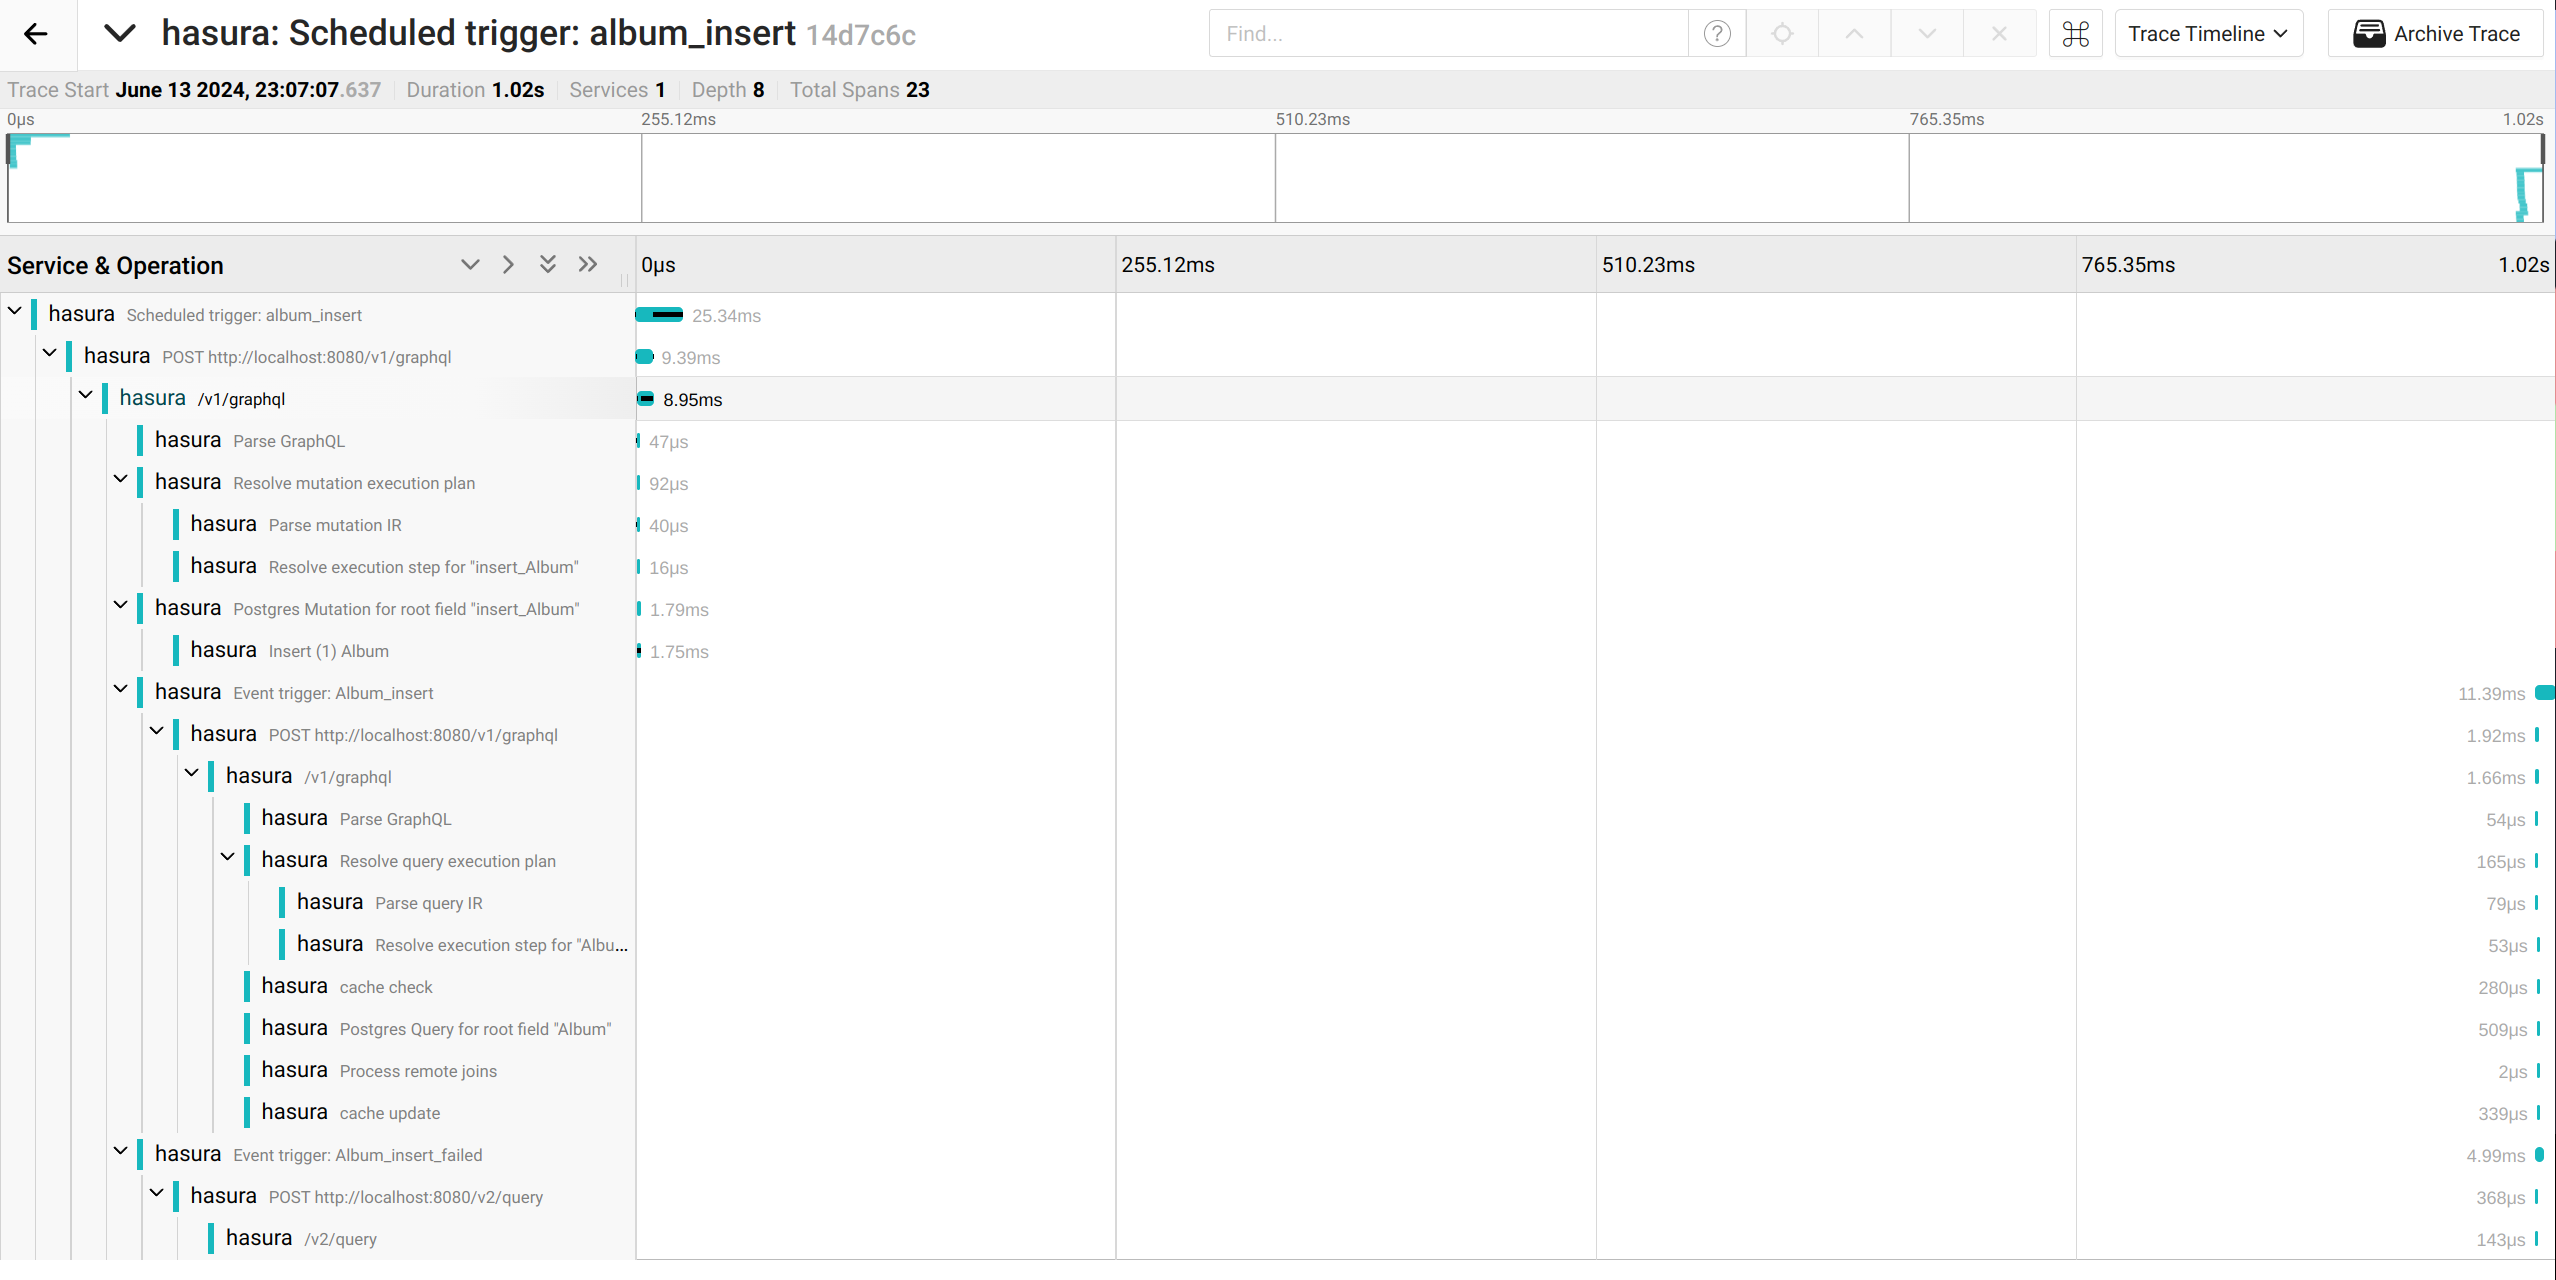
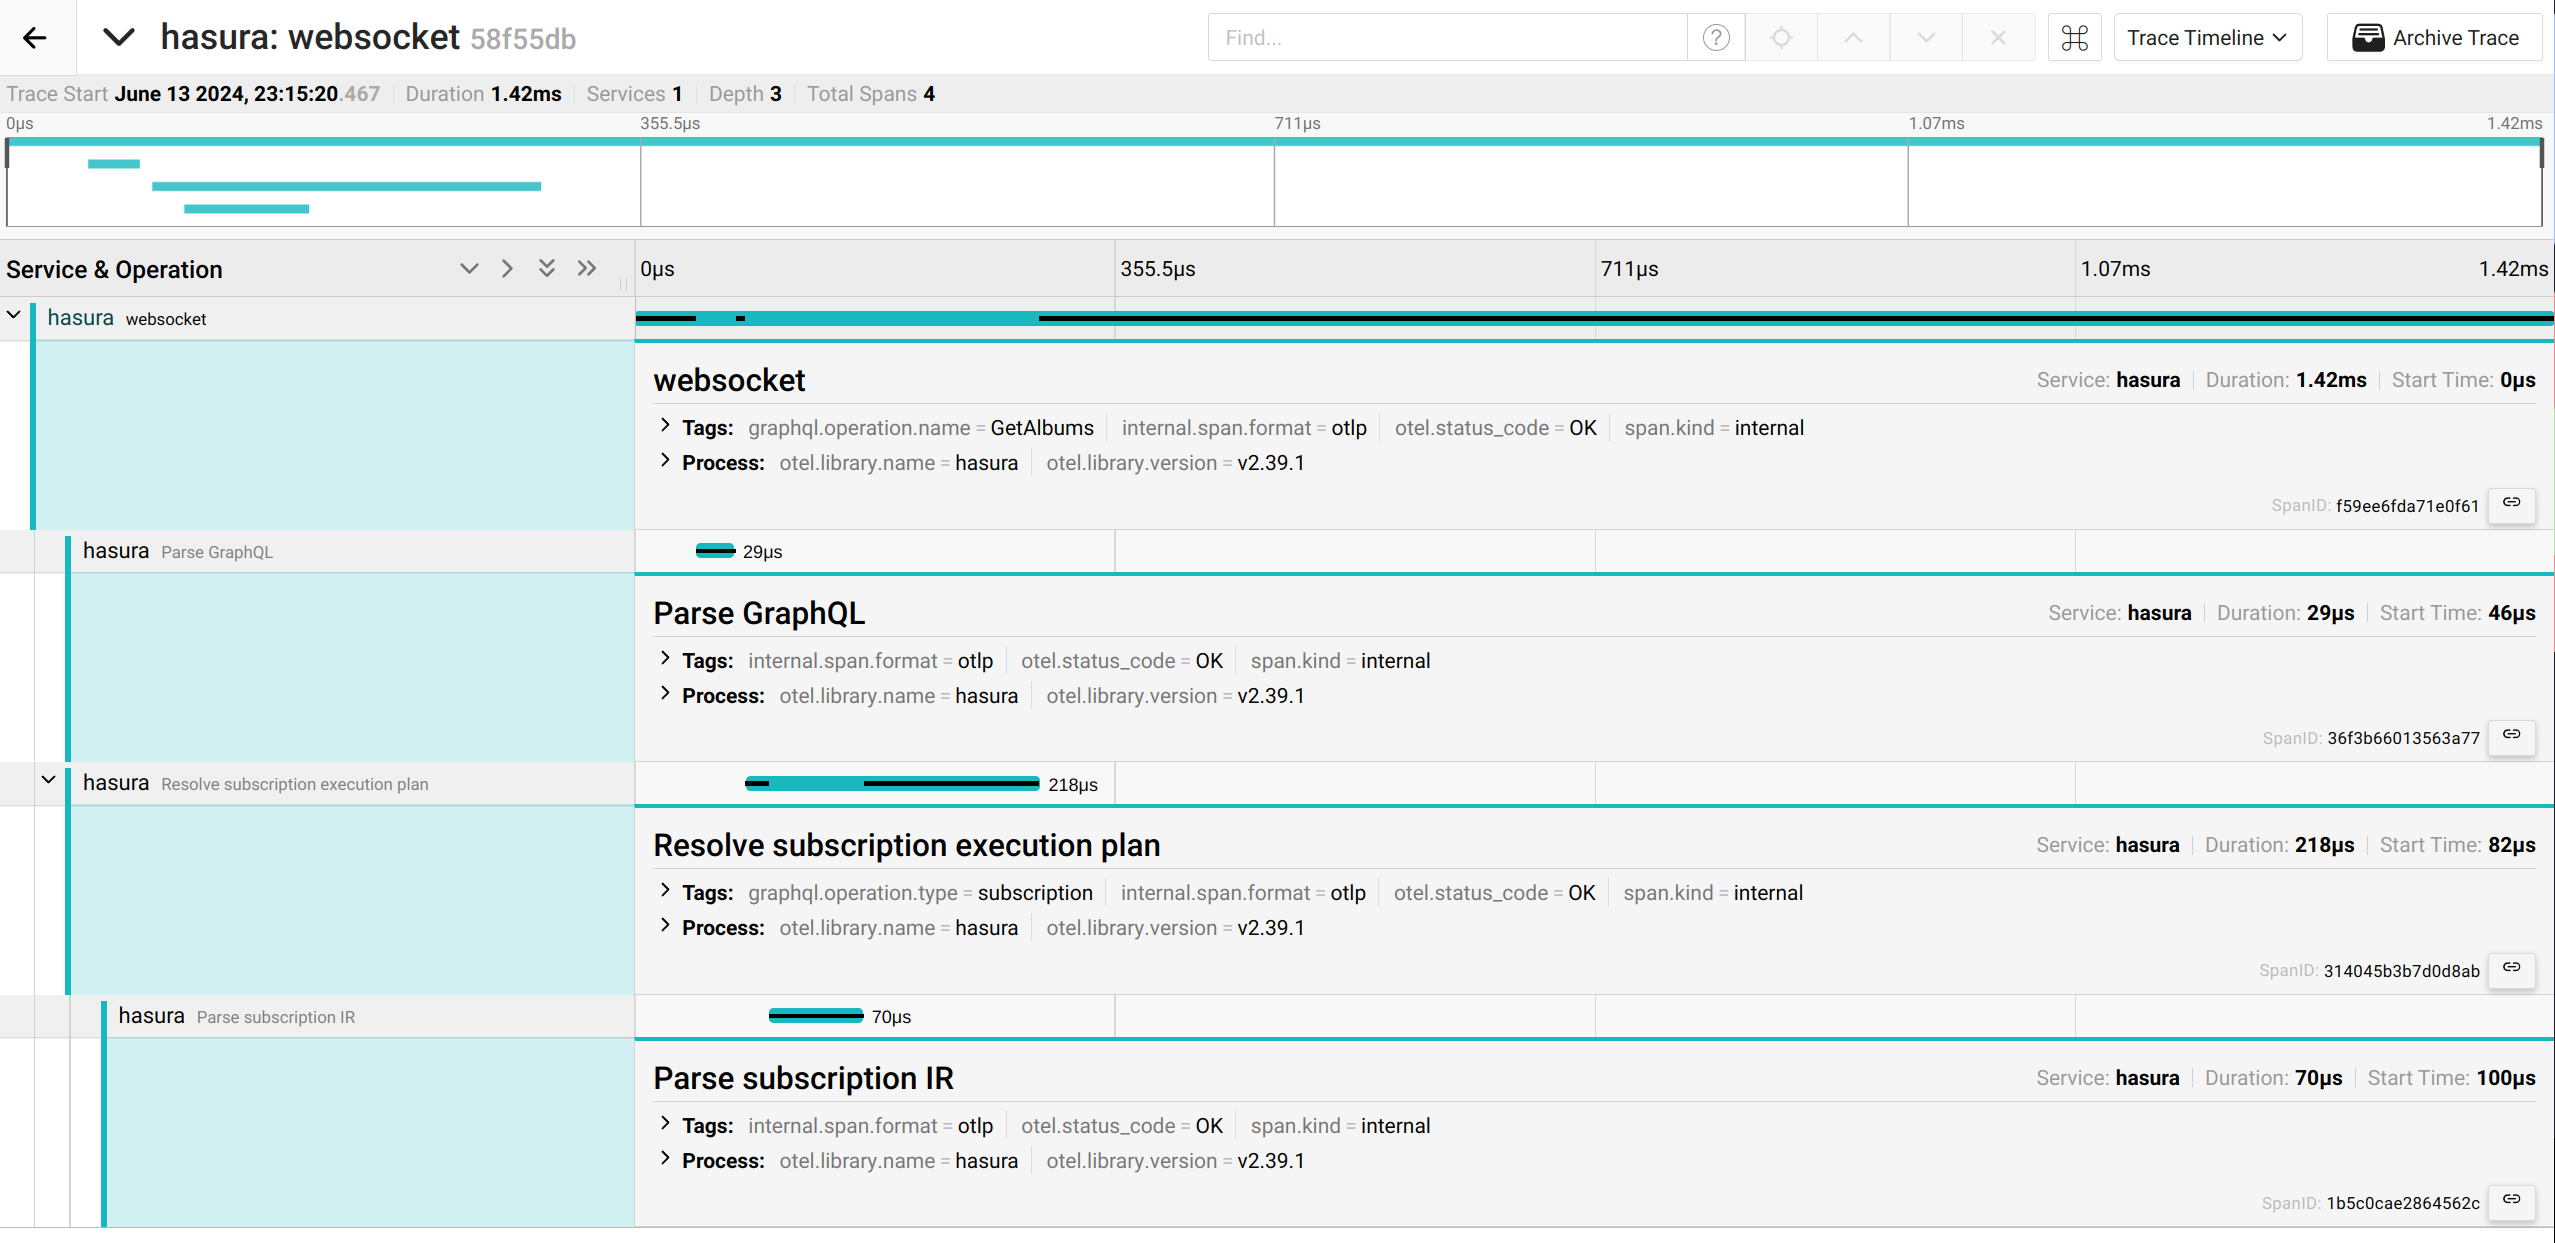
Multiple operations can be linked together with the same trace ID. For example, the following trace includes Scheduled Trigger, GraphQL, Event Trigger and Schema requests in the same flame graph.
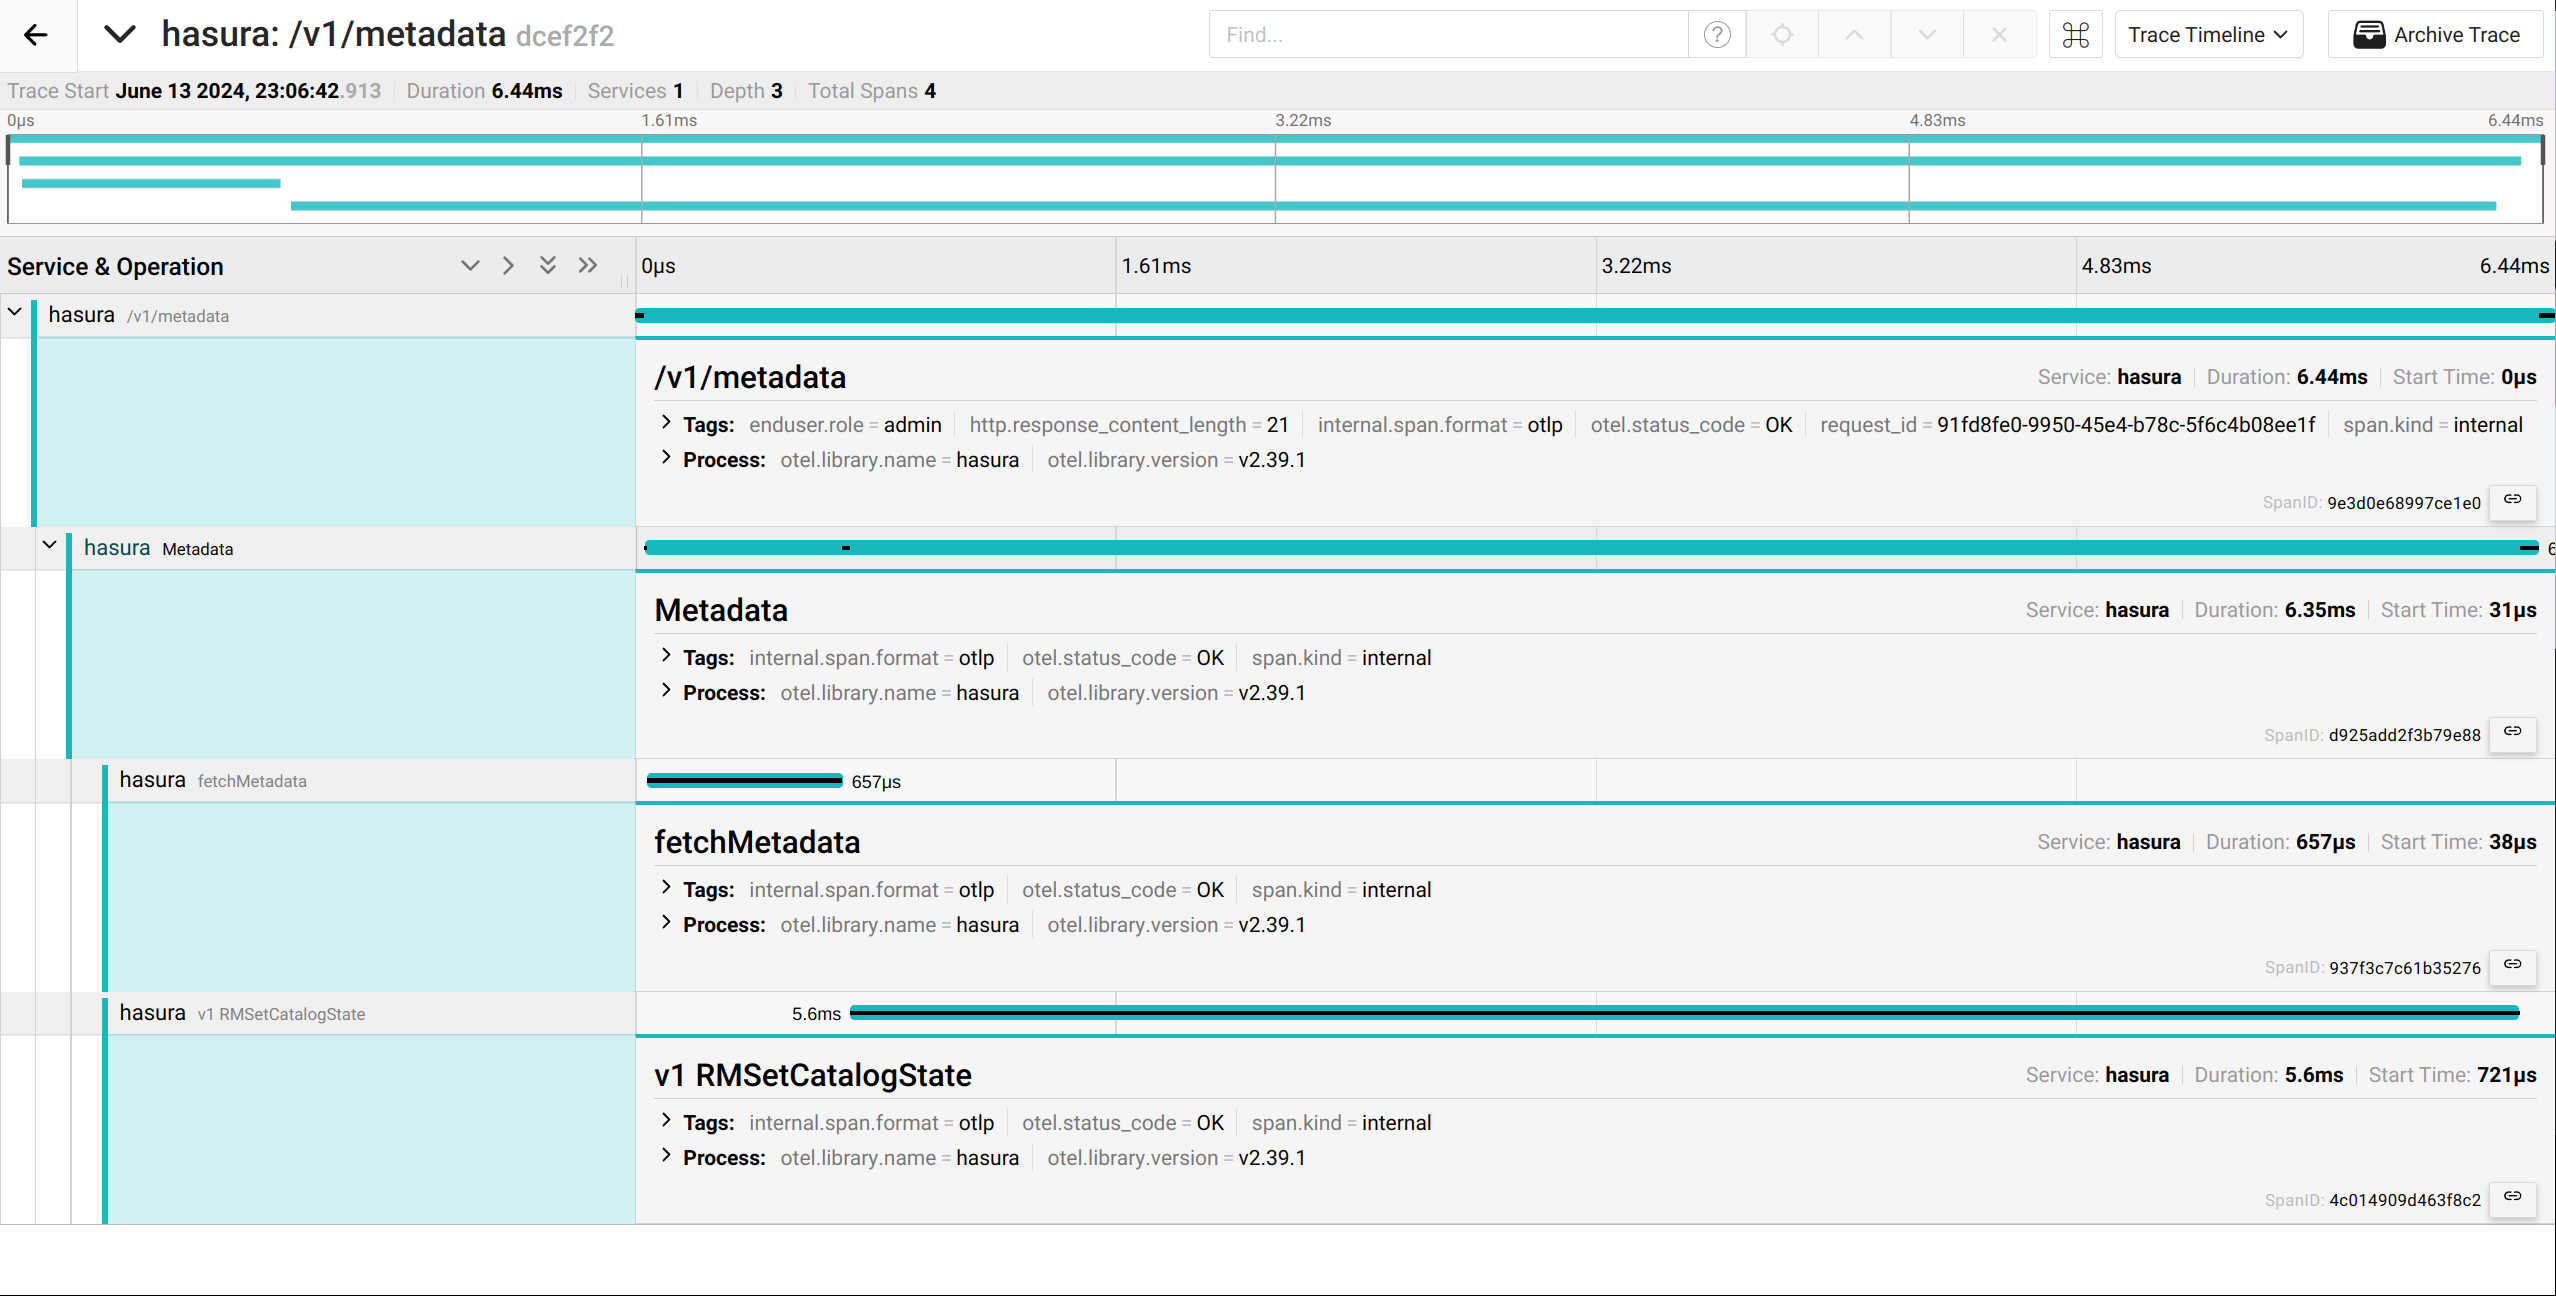
Metadata API
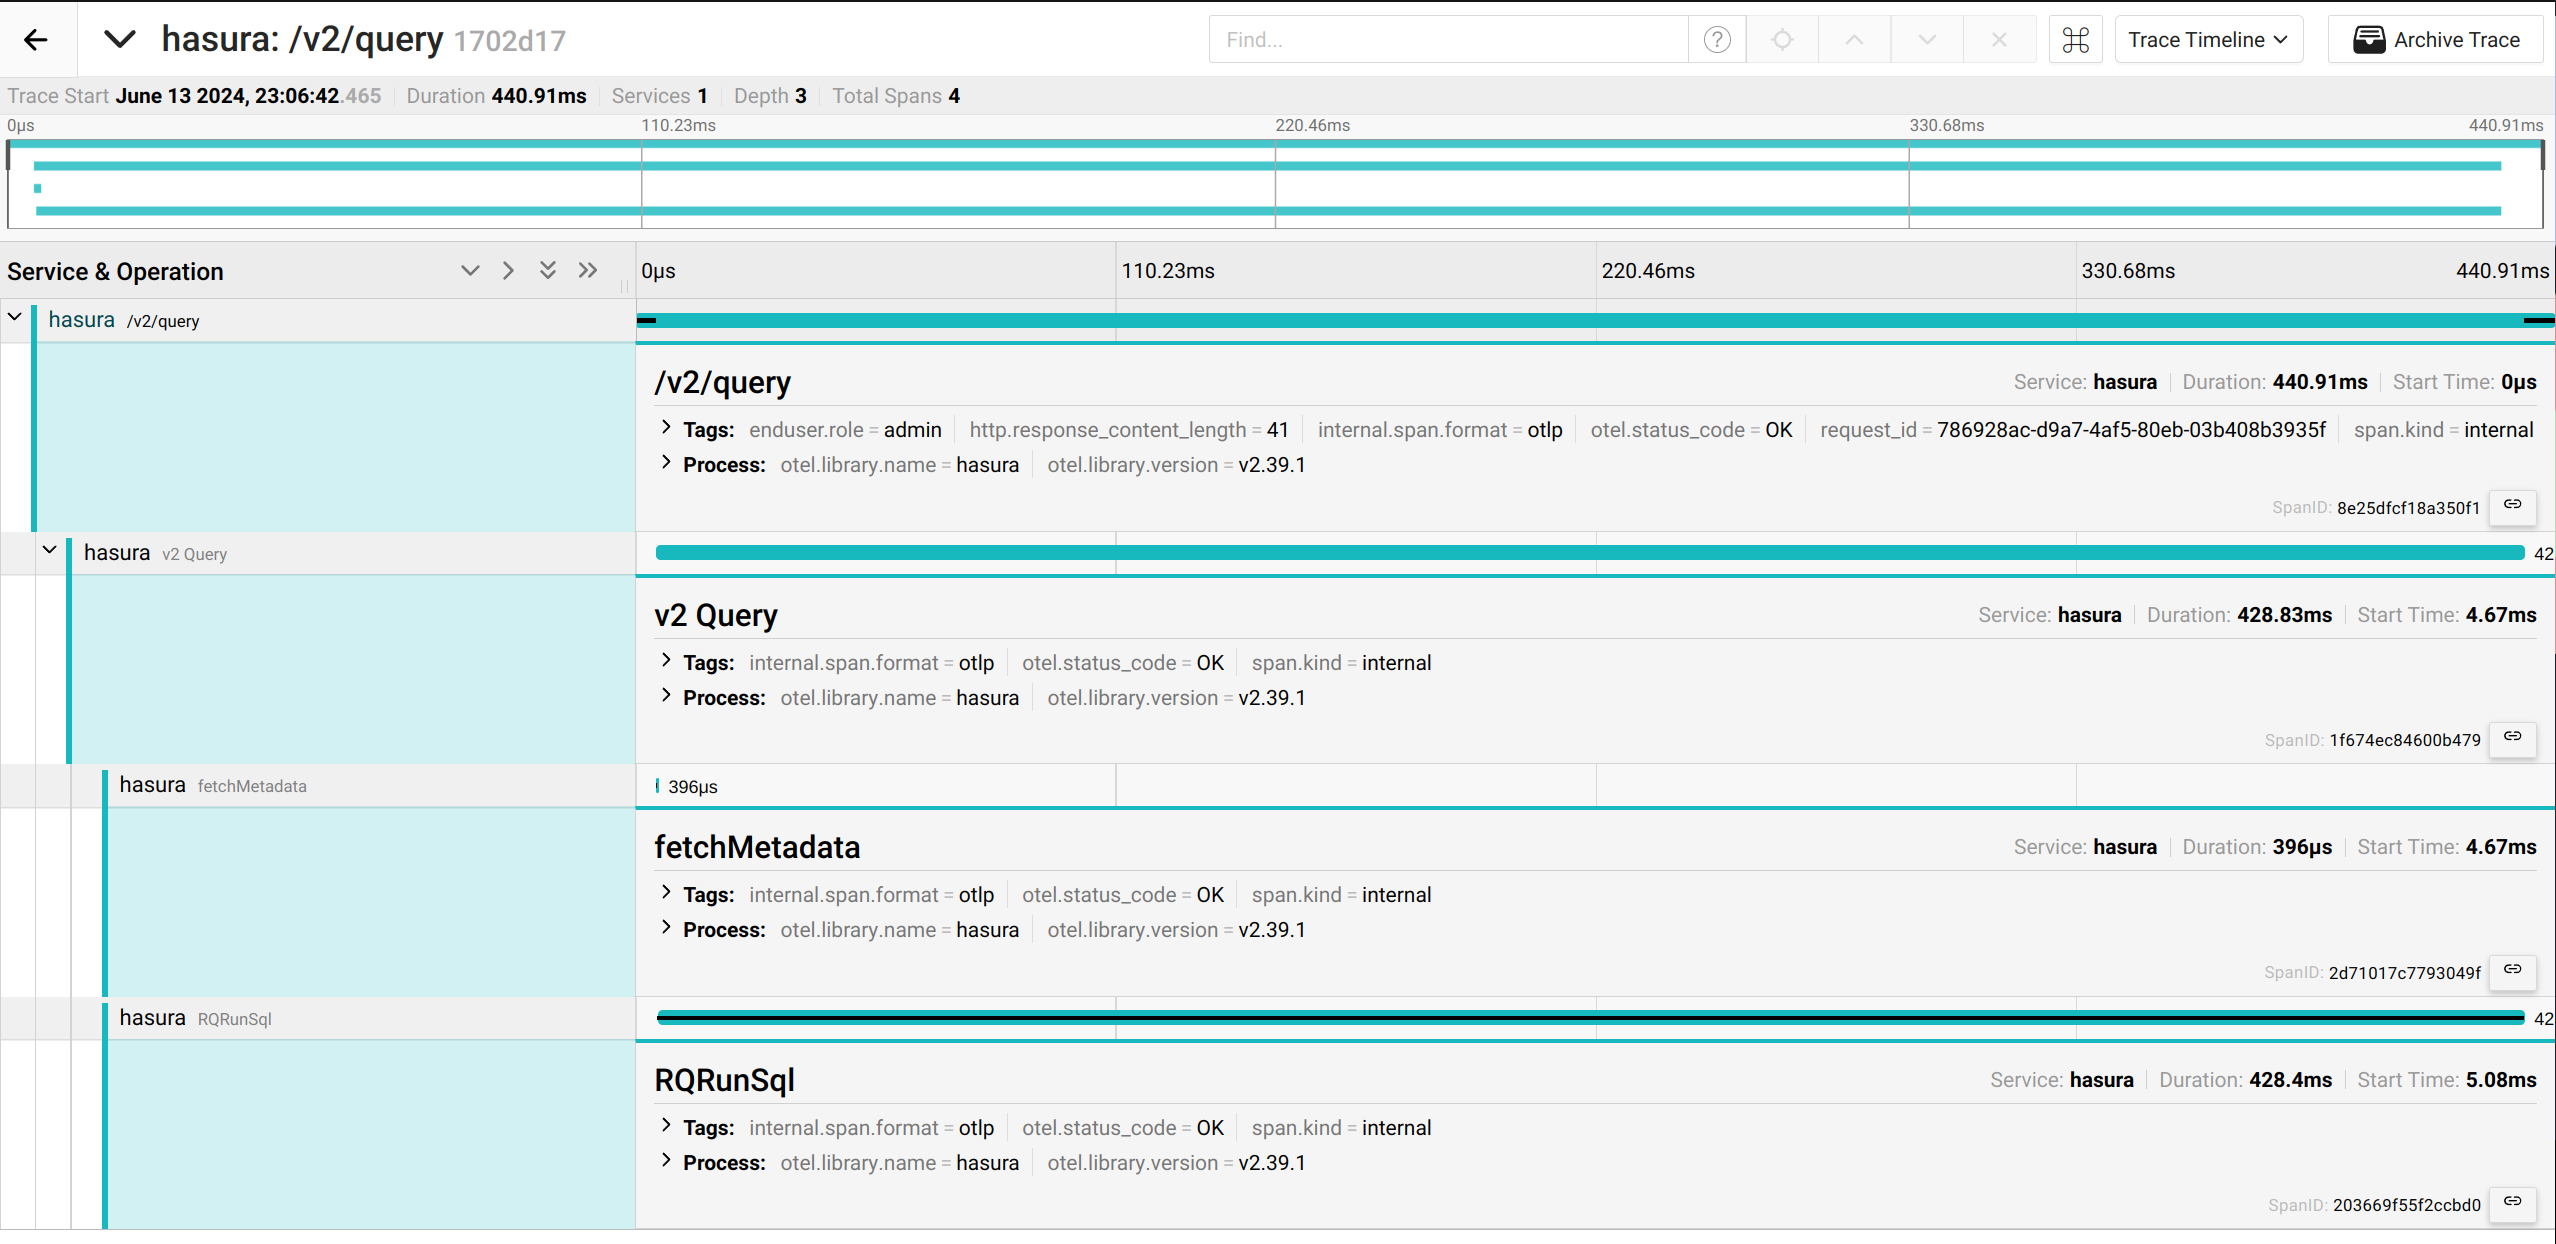
Schema API
Subscription
Consuming and visualizing metrics
OpenTelemetry and Native Prometheus metrics are exchangeable. You should enable only one of these exporters to avoid receiving duplicated data.
OpenTelemetry Collector
The OpenTelemetry Collector is recommended, especially if your production infrastructure has many GraphQL Engine replicas. The replication instance ID is in the global resource attributes array. However, some observability services don't automatically convert resource attributes to data point labels. Aggregate values of metrics may not be accurate. You should add a processor to assign the instance ID.
processors:
  transform:
    error_mode: ignore
    metric_statements:
      - context: datapoint
        statements:
          - set(attributes["instance"], resource.attributes["host.name"])
See the full configuration example here.
Available Metrics
The available OpenTelemetry metrics are the same as those available via Prometheus.
Visualizing metrics via Prometheus and Grafana
OpenTelemetry and Native Prometheus metrics are exchangeable. Grafana dashboards
are compatible with those metrics as well. However, because Prometheus renames the job label from exported metrics by
default you need to enable honor_labels to allow overriding the job label from OpenTelemetry Collector.
scrape_configs:
  - job_name: 'otel-collector-hasura'
    scrape_interval: 30s
    honor_labels: true
    static_configs:
      - targets: ['otel-collector:8889']
Logs
Log Structure
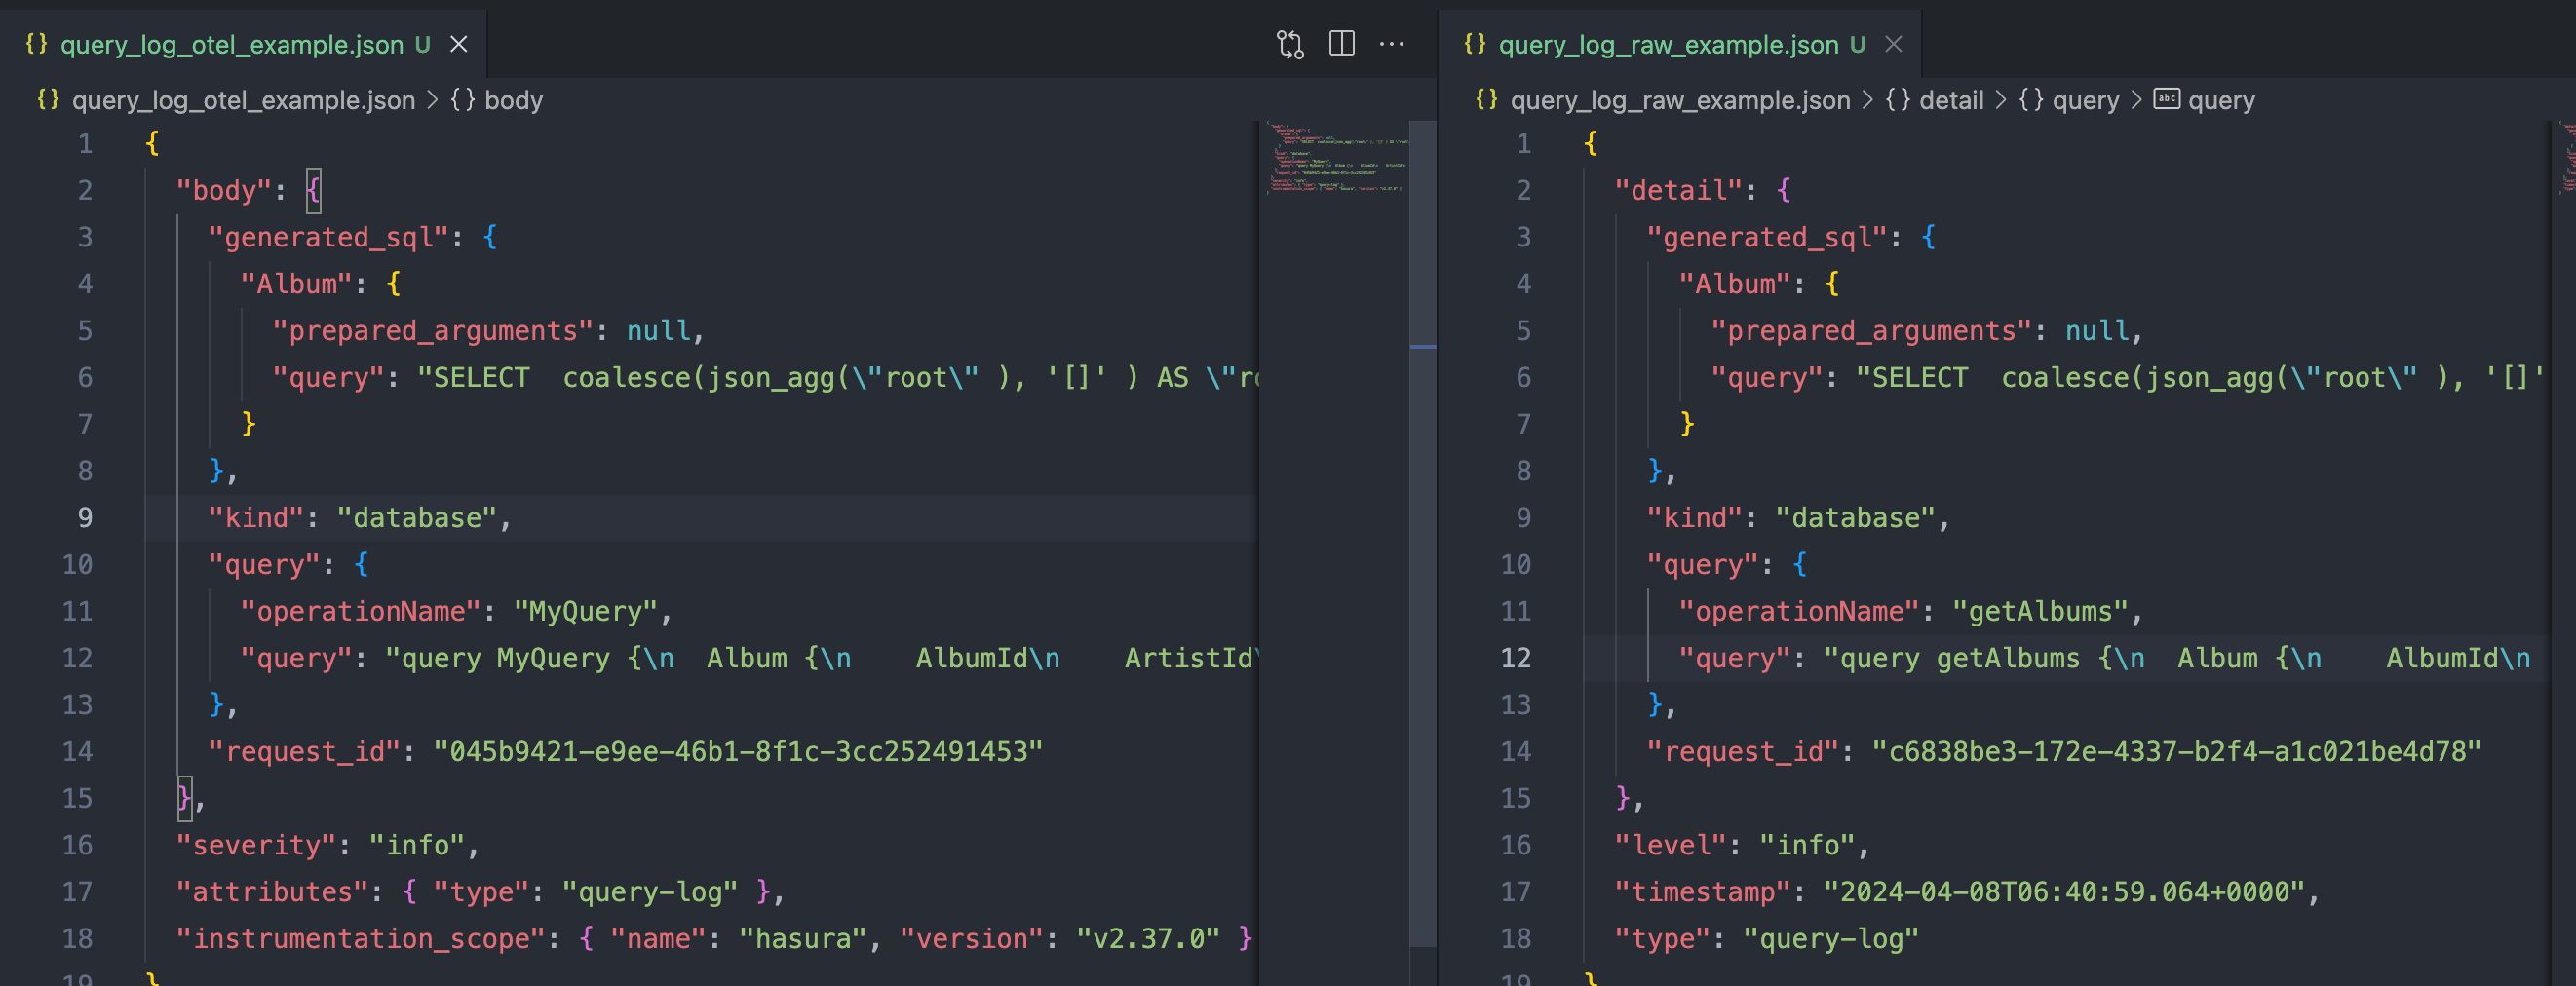
The overall structure of OpenTelemetry logs is similar to standard GraphQL Engine logs. However, several minor changes are made to be compatible with the specification of OpenTelemetry Logs Data Model.
| Standard | OpenTelemetry |
|---|---|
detail | body |
level | severity |
type | attributes.type |
Configurations
All logs which are printed to the output stream are exported to OpenTelemetry receivers. Therefore, besides native OpenTelemetry configurations, these configurations take effect to OpenTelemetry logs as well:
New Relic
New Relic can parse the body in JSON string format only. If you export logs directly to public OpenTelemetry endpoints of New Relic the body content will be removed. The workaround is using the OpenTelemetry collector with a transform processor to convert the log body to string.
receivers:
  otlp:
    protocols:
      grpc:
      http:

exporters:
  otlp/newrelic:
    endpoint: otlp.nr-data.net:4317
    headers:
      api-key: ${NEW_RELIC_API_KEY}

processors:
  transform/new_relic_logs:
    log_statements:
      - context: log
        statements:
          - set(body, Concat([body, ""], ""))

service:
  pipelines:
    logs:
      receivers: [otlp]
      processors: [transform/new_relic_logs]
      exporters: [otlp/newrelic]
Connect Logs and Traces
Trace and Span ID are included in the root of the log body. GraphQL Engine follows OpenTelemetry's data model so that OpenTelemetry-compliant services can automatically correlate logs with Traces. However, some services need extra configurations.
Jaeger
Grafana can link Jaeger with log data sources such as Loki, Elasticsearch, Splunk, etc... To do that, you need to
configure Trace to logs in Jaeger's data source settings.
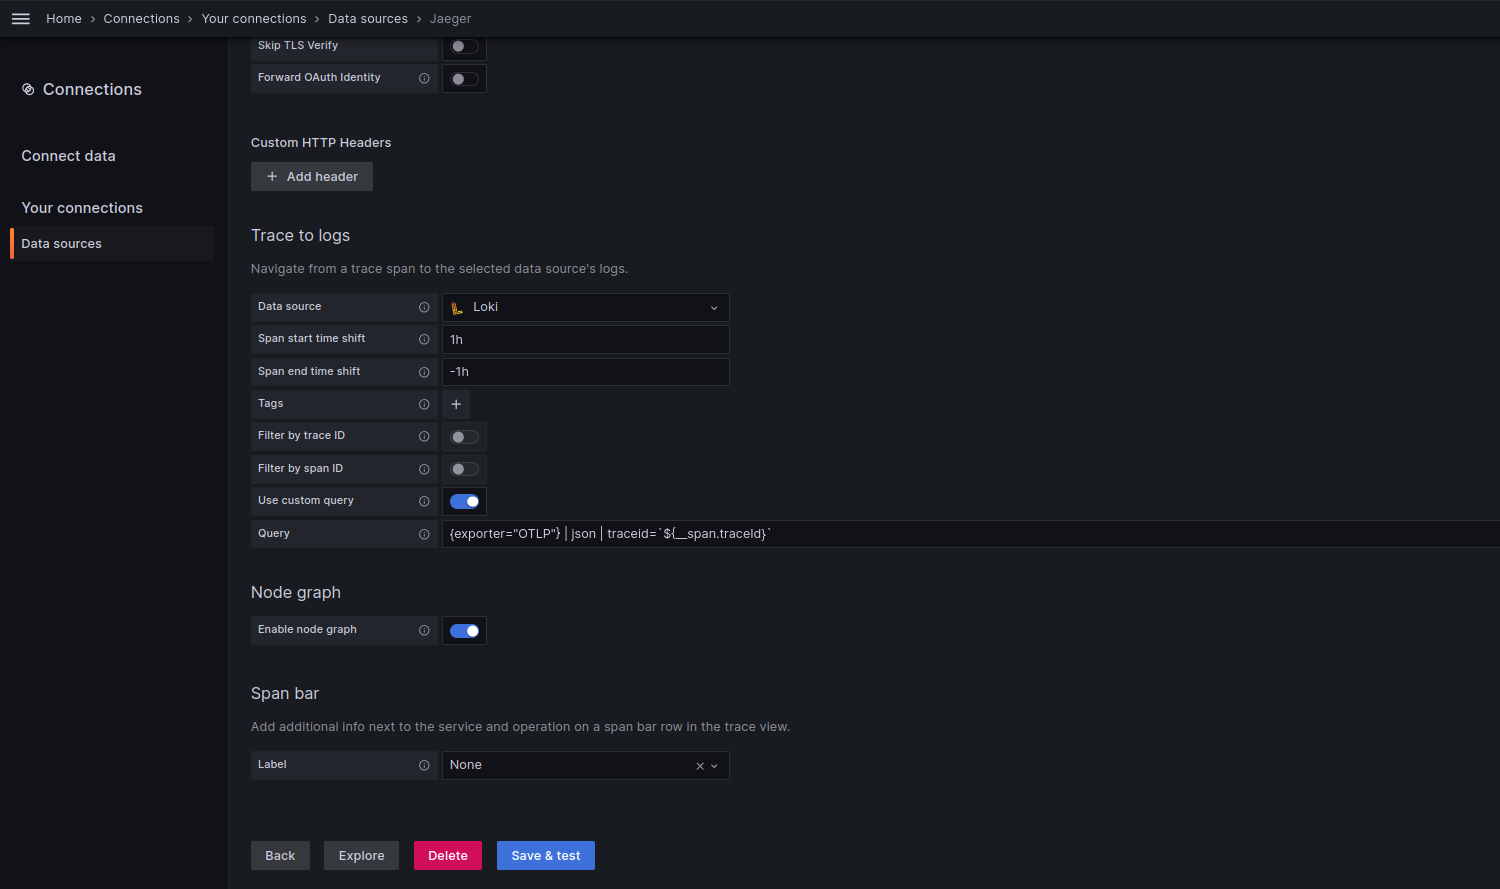
In this example, Traces are linked to Loki logs by the traceid. You also can copy the below configuration to the data
source file.
datasources:
  - name: Jaeger
    type: jaeger
    url: http://jaeger:16686/
    jsonData:
      tracesToLogsV2:
        datasourceUid: 'Loki'
        spanStartTimeShift: '1h'
        spanEndTimeShift: '-1h'
        filterByTraceID: false
        filterBySpanID: false
        customQuery: true
        query: '{exporter="OTLP"} | json | traceid=`$${__span.traceId}`'
      traceQuery:
        timeShiftEnabled: true
        spanStartTimeShift: '1h'
        spanEndTimeShift: '-1h'
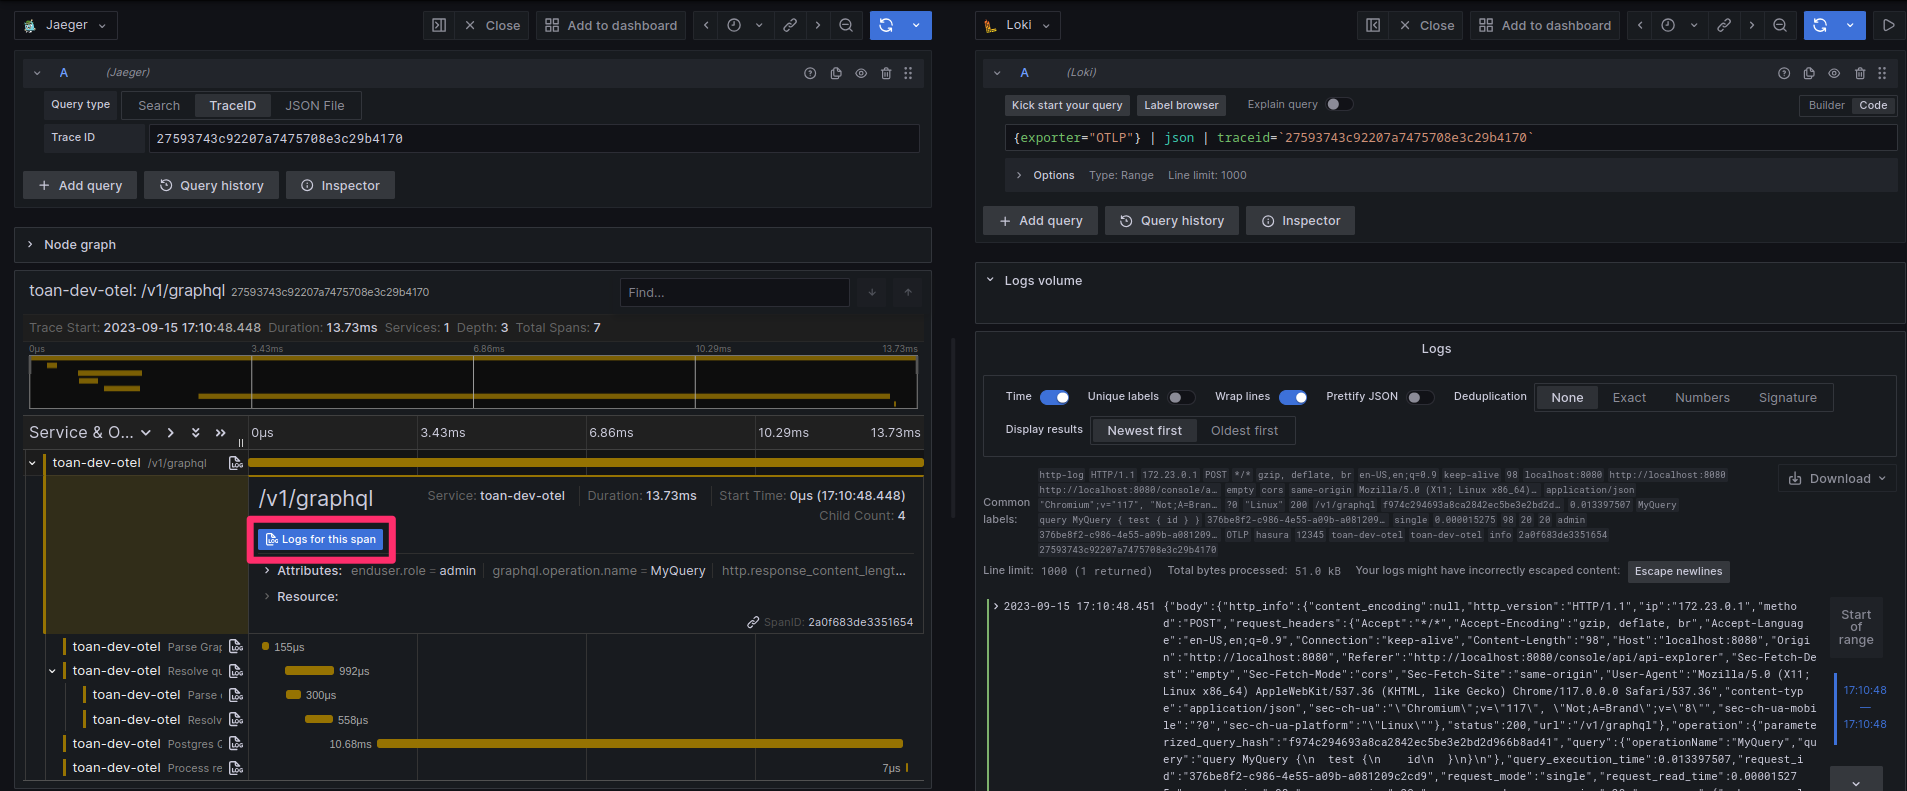
You will see the Logs for this span button enabled when exploring the trace detail.
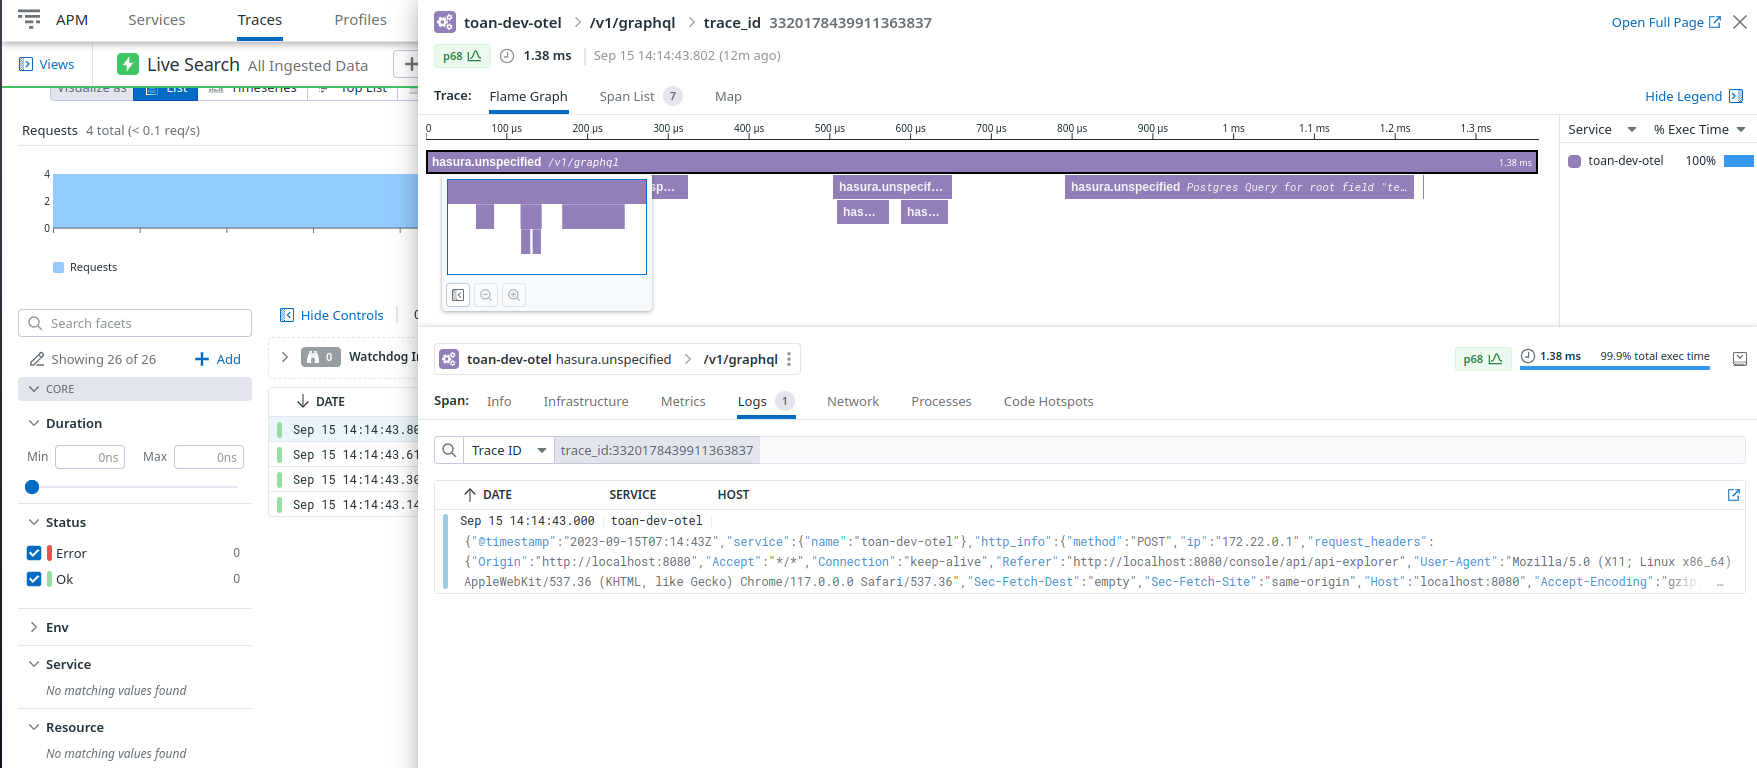
Datadog
If Datadog can't correlate between traces and logs, you should verify the Trace ID attributes mapping. Read more at the troubleshooting section on Datadog.
Honeycomb
Traces and logs can't correlate together if they are exported to different datasets. Note that Honeycomb will use the
service.name attribute as the dataset where logs are exported. Therefore the x-honeycomb-dataset header must be
matched with that attribute.
Examples
Check out the enterprise observability boilerplate.