Observability & Performance Tuning
Subscription Execution
For serving subscription requests, Hasura optimizes the subscription execution to ensure it is as fast as possible while not overloading the database with concurrent queries.
To achieve this, Hasura uses a combination of the following techniques:
- Grouping same queries into "cohorts" : Hasura groups subscriptions with the same set of query and session variables into a single cohort. The subscribers in a cohort are updated simultaneously.
- Diff-checking: On receiving response from the database, Hasura checks the diff between the old and new values and sends the response only to the subscribers whose values have changed.
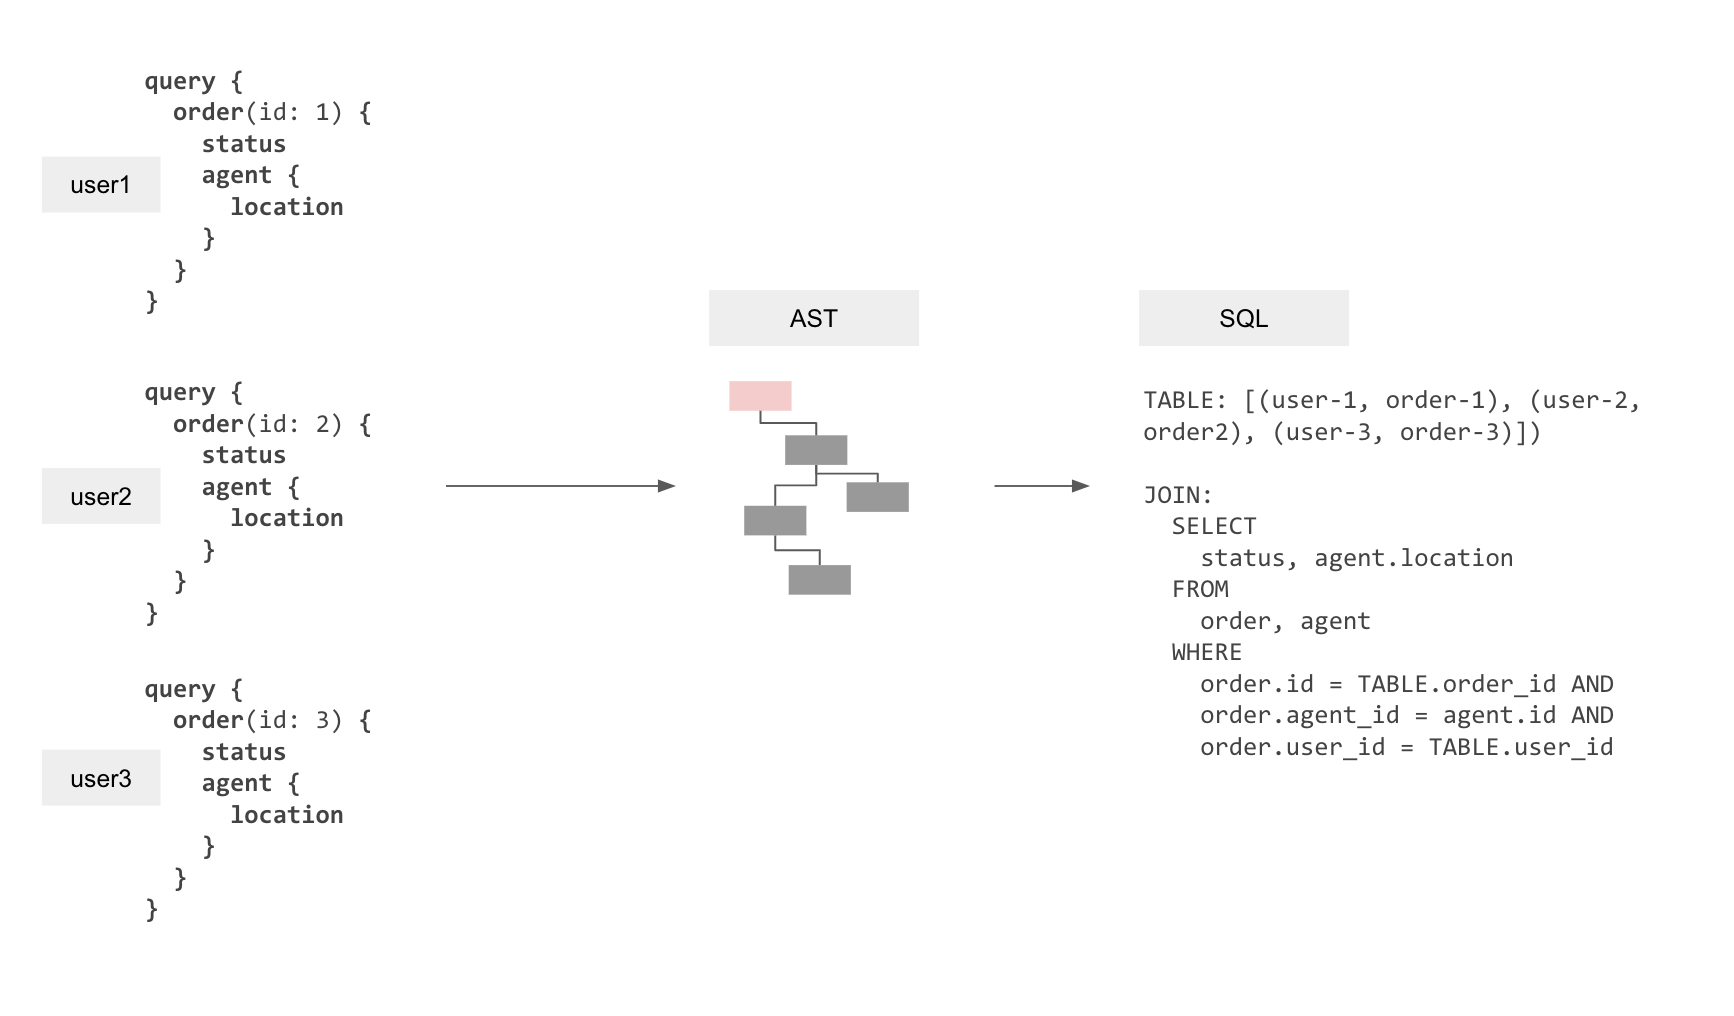
- Multiplexing: Hasura groups similar "parameterized" subscriptions together and additionally splits them into
batches for efficient performance on the database. The batch size can be configured using the
HASURA_GRAPHQL_LIVE_QUERIES_MULTIPLEXED_BATCH_SIZEenvironment variable. You can read more about multiplexing here. For example, in the image below, we are grouping the three subscriptions into a single multiplexed query.
For more details on how Hasura executes subscriptions, refer to the live query or streaming subscription documentation.
Observability
Hasura EE exposes a set of Prometheus Metrics that can be used to monitor the subscriptions system and help diagnose performance issues.
To find out more about observability, including best practices, check out observability docs section.
The following metrics can be used to monitor the performance of subscriptions:
hasura_active_subscriptionshasura_active_subscription_pollershasura_active_subscription_pollers_in_error_statehasura_subscription_db_execution_time_secondshasura_subscription_total_time_seconds
Golden Signals for subscriptions
You can perform Golden Signals-based system monitoring with Hasura's exported metrics. The following are the golden signals for subscriptions:
Latency
The latency of a subscription is defined as the time taken to complete one fetch cycle for the subscription. To monitor
latency, you can monitor the hasura_subscription_total_time_seconds metric.
If the value of this metric is high, then it may be an indication that the multiplexed query is taking longer to execute
in the database, verify this with
hasura_subscription_db_execution_time_seconds metric. If the value of this
metric is high as well, you can do the following:
- Check if any database index can help improve the performance of the query, analyzing the GraphQL query will show the generated multiplexed query.
- Avoid querying unnecessary fields that translate to joins or function calls in the GraphQL query.
- Consider adding more read replicas to the database and running subscriptions on them.
Traffic
The traffic of a subscription is defined as the number of subscriptions that are active at any given point of time. To
monitor traffic, you can monitor the hasura_active_subscriptions metric.
If the value of this metric is high (and above your established baseline), then you may want to consider increasing the number of Hasura instances to handle the load.
Errors
Errors in subscriptions can be monitored using the following metrics
hasura_graphql_requests_total{type="subscription",response_status="error"}: Total number of errors that happen before the subscription is started (i.e. validation, parsing and authorization errors).hasura_active_subscription_pollers_in_error_state: Number of subscription pollers that are in error state.
If the value of the hasura_active_subscription_pollers_in_error_state
is non-zero, you should consider investigating the livequery-poller-log logs (this will include the error message) to
debug the failing subscription.
Saturation
Saturation is the threshold until which the subscriptions can run smoothly; once this threshold is crossed, you may see performance issues, and abrupt disconnections of the connected subscribers.
To monitor the saturation for subscriptions, you can monitor the following:
- CPU and memory usage of Hasura instances.
- For postgres backends, you can monitor the
hasura_postgres_connectionsmetric to see the number of connections opened by Hasura with the database. - P99 of the
hasura_subscription_total_time_secondsmetric.
If the number of database connections is high, you can consider increasing the max_connections of the database.
You can also consider scaling the Hasura instances horizontally and vertically to handle the load.
Tuning subscription performance
Hasura GraphQL Engine is designed to scale to handle millions of concurrent subscriptions. However, due to misconfigurations or inefficient queries, the performance of subscriptions can be impacted. This section describes how to analyze and tune the performance of subscriptions.
Analyze
Using the Analyze button on GraphiQL API Explorer of the Hasura Console, you can see the generated multiplexed SQL and
its query plan. The query plan can reveal the bottlenecks in query execution and appropriate indexes can be added to
improve performance.
In addition to these, simplifying the subscription to avoid unnecessary joins or avoiding fetching fields which are not going to change can also help improve performance.
Performance tuning
The parameters governing the performance of subscriptions in terms of throughput, latency and resource utilization are:
HASURA_GRAPHQL_LIVE_QUERIES_MULTIPLEXED_REFETCH_INTERVAL- Time interval between Hasura multiplexed queries to the DB for fetching changes in subscriptions data, default = 1 sec
- Increasing this reduces the frequency of queries to the DB, thereby reducing its load and improving throughput while increasing the latency of updates to the clients.
HASURA_GRAPHQL_LIVE_QUERIES_MULTIPLEXED_BATCH_SIZE- Number of similar subscriptions batched into a single SQL query to the DB, default = 100
- Increasing this reduces the number of SQL statements fired to the DB, thereby reducing its load and improving throughput while increasing individual SQL execution times and latency.
- You should reduce this value if the execution time of the SQL generated by Hasura after multiplexing is more than the refetch interval.
max_connectionsof the source- Max number of connections Hasura opens with the DB, default = 50 (configurable via update source metadata API)
- Increasing this increases the number of connections Hasura can open with the DB to execute queries, thereby improving concurrency but adding load to the database. A very high number of concurrent connections can result in poor DB performance.
The default values offer a reasonable trade-off between resource utilization and performance for most use cases. For scenarios with heavy queries and a high number of active subscriptions, you need to benchmark the setup and these parameters need to be iterated upon to achieve optimal performance.