Integration Guide for SigNoz
Introduction
SigNoz is an open source, OpenTelemetry-native observability platform that keeps traces, metrics and logs in one application. Because Hasura's OpenTelemetry Exporter speaks OTLP over HTTP, you can point it straight at SigNoz without running a collector in between.
This guide walks through exporting traces, metrics and logs from Hasura GraphQL Engine and its data connectors to SigNoz, then verifying that the data arrives. SigNoz maintains a companion version of this guide at OpenTelemetry Hasura Integration, which is kept up to date with their endpoints and console.
Step 1: Get your SigNoz endpoint and ingestion key
Log in to SigNoz Cloud, or create an account. Go to Settings > Ingestion Settings and note two values:
- Ingestion key, which authenticates every request Hasura sends.
- Region, which determines the host you send to.
| Region | OTLP endpoint host |
|---|---|
| US | https://ingest.us.signoz.cloud:443 |
| EU | https://ingest.eu.signoz.cloud:443 |
| India | https://ingest.in.signoz.cloud:443 |
For more detail, see the SigNoz ingestion overview.
If you run SigNoz yourself, use your own OTLP receiver as the host, for example http://<signoz-host>:4318, and omit
the ingestion key header in the next step. Self-hosted SigNoz does not require one.
Step 2: Configure the OpenTelemetry Exporter in Hasura
- Console
- CLI
Go to the Settings tab (⚙) in the Console and click on OpenTelemetry Exporter. Select HTTP/Protobuf as the
connection type, select the data types you want to export, and set the endpoint for each:
- Traces Endpoint:
https://ingest.<region>.signoz.cloud:443/v1/traces - Metrics Endpoint:
https://ingest.<region>.signoz.cloud:443/v1/metrics - Logs Endpoint:
https://ingest.<region>.signoz.cloud:443/v1/logs
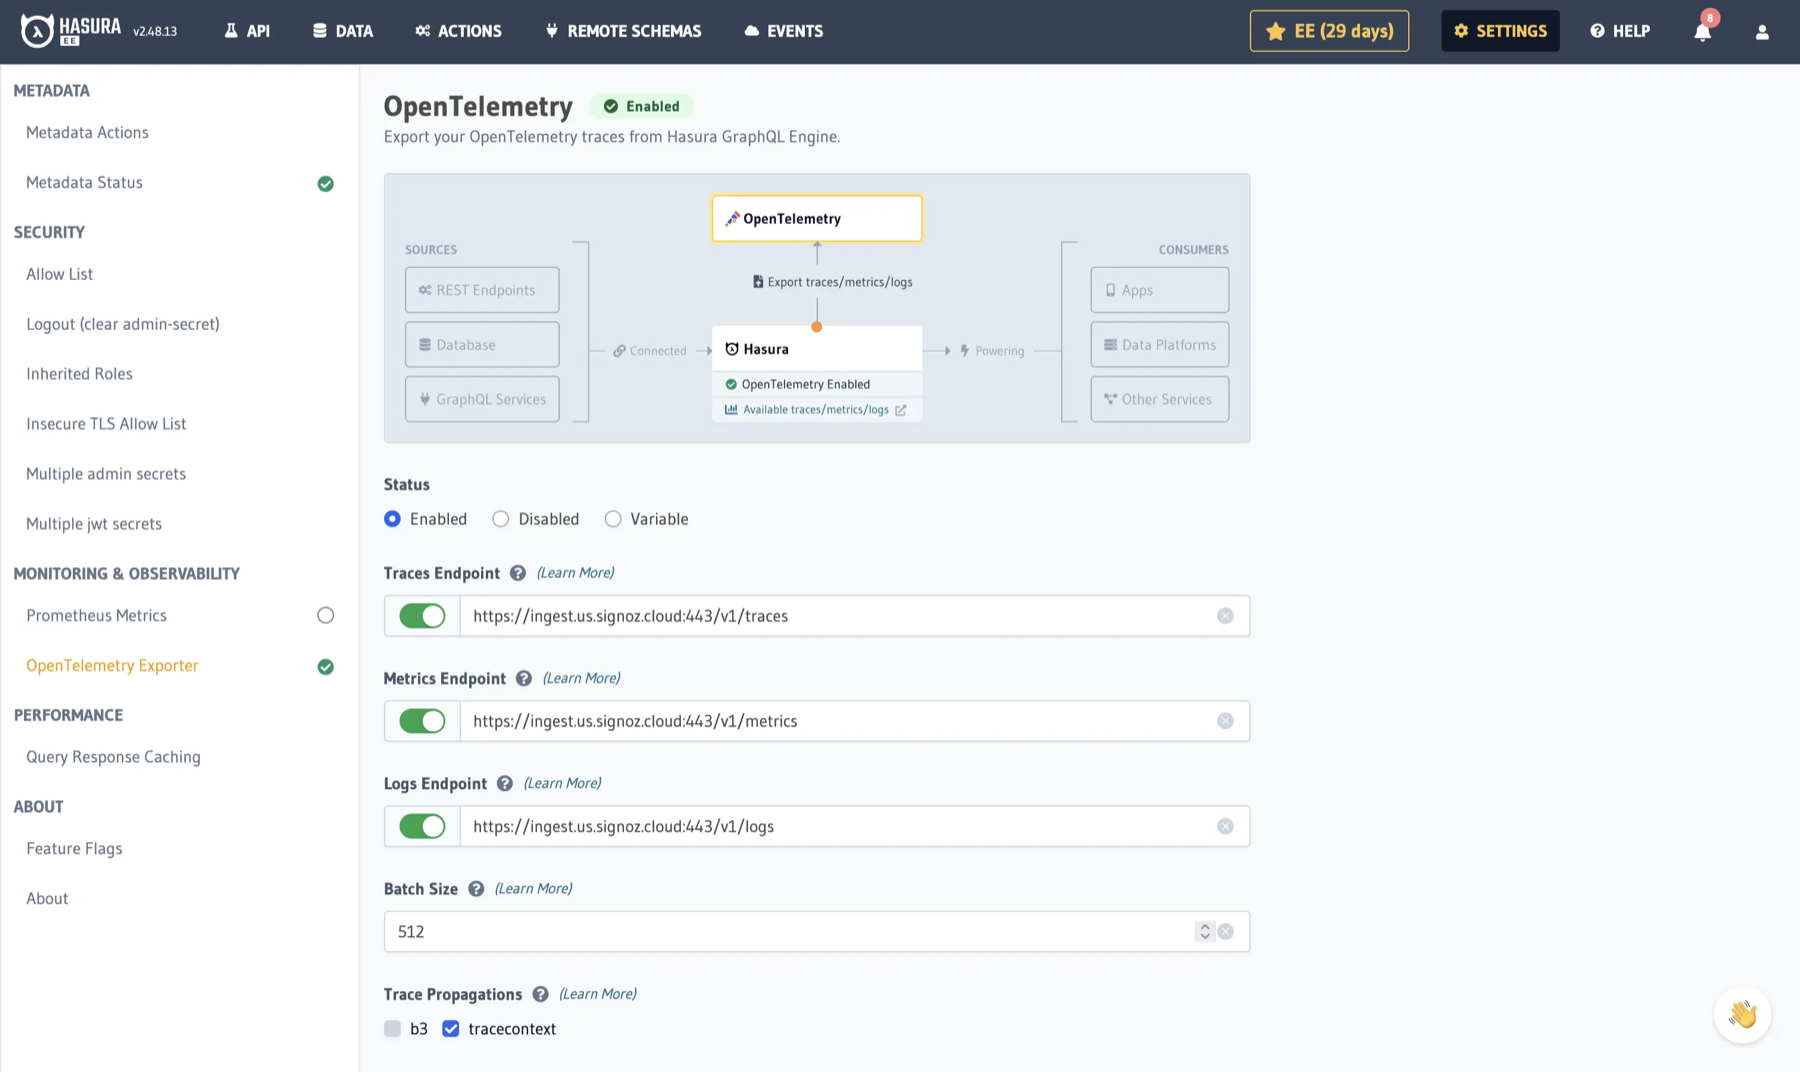
Under Headers, add your ingestion key:
- Name:
signoz-ingestion-key - Value: your SigNoz ingestion key
Under Attributes, set service.name to something that identifies this instance, for example hasura-prod. If you
run more than one Hasura instance against the same SigNoz account, give each a distinct service.name so you can filter
them apart later.
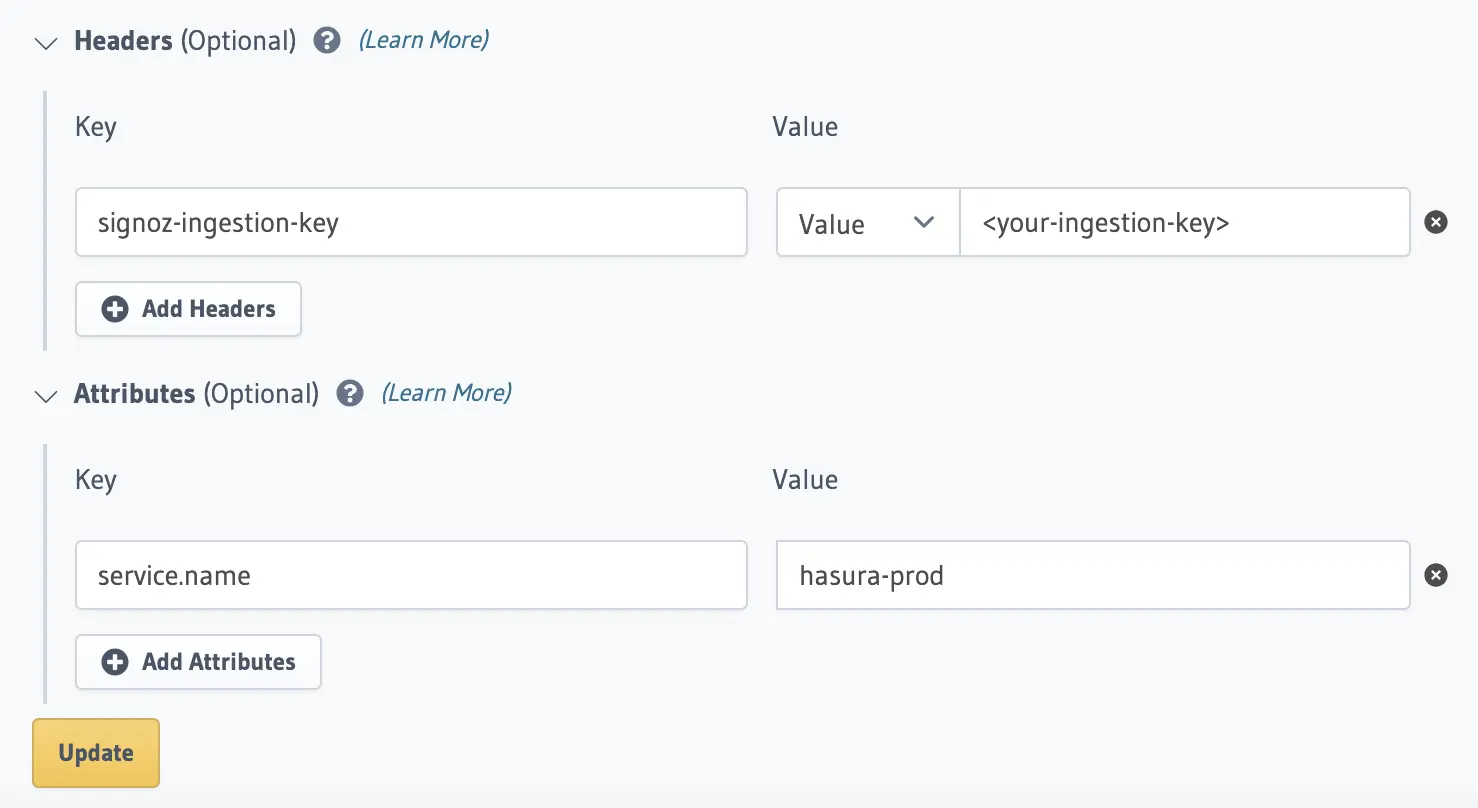
Click Update, then toggle the Status button to enable the integration.
Create or update the file opentelemetry.yaml inside the metadata directory:
status: enabled
data_types:
  - traces
  - metrics
  - logs
exporter_otlp:
  headers:
    - name: signoz-ingestion-key
      value_from_env: SIGNOZ_INGESTION_KEY
  resource_attributes:
    - name: service.name
      value: hasura-prod
  otlp_traces_endpoint: https://ingest.<region>.signoz.cloud:443/v1/traces
  otlp_metrics_endpoint: https://ingest.<region>.signoz.cloud:443/v1/metrics
  otlp_logs_endpoint: https://ingest.<region>.signoz.cloud:443/v1/logs
  protocol: http/protobuf
  traces_propagators:
    - tracecontext
batch_span_processor:
  max_export_batch_size: 512
Apply the Metadata by running:
hasura metadata apply
Traces are supported from v2.18.0, metrics from v2.31.0 and logs from v2.35.0, so run v2.35.0 or later to export
all three signals. For the full parameter reference, see
Export Traces, Metrics and Logs.
Two things to keep in mind while filling in the endpoints. Hasura does not append the signal path for you, so each
endpoint has to end in /v1/traces, /v1/metrics or /v1/logs. And gRPC is not supported, so use the
HTTP/Protobuf connection type against the paths above.
Step 3: Export traces from your data connectors
Data connectors run as separate services alongside the GraphQL Engine, and are configured independently of it. They export traces only. Configuring them is what lets a single trace cover both the GraphQL request and the database execution underneath it, so it is worth doing if you want to see where time is actually spent.
- GraphQL Data Connectors
- Mongo Data Connector
The GraphQL Data Connectors, which power Athena, MariaDB, MySQL, Oracle, Redshift and Snowflake among others, are built on Quarkus. Set these environment variables on the connector container:
QUARKUS_OTEL_EXPORTER_OTLP_ENDPOINT="https://ingest.<region>.signoz.cloud:443"
QUARKUS_OTEL_EXPORTER_OTLP_PROTOCOL="http/protobuf"
QUARKUS_OTEL_EXPORTER_OTLP_HEADERS="signoz-ingestion-key=<your-ingestion-key>"
QUARKUS_OTEL_RESOURCE_ATTRIBUTES="service.name=hasura-graphql-connector"
The Mongo Data Connector uses the standard OpenTelemetry environment variables:
OTEL_EXPORTER_OTLP_TRACES_ENDPOINT="https://ingest.<region>.signoz.cloud:443/v1/traces"
OTEL_EXPORTER_OTLP_TRACES_PROTOCOL="http/protobuf"
OTEL_EXPORTER_OTLP_HEADERS="signoz-ingestion-key=<your-ingestion-key>"
OTEL_SERVICE_NAME="hasura-mongo-connector"
OTEL_PROPAGATORS="tracecontext"
For more detail, see Export OTEL information for data connectors.
Step 4: Verify the integration
Run a few operations against your Hasura API to generate telemetry, then open SigNoz. Data should start appearing within a few minutes.
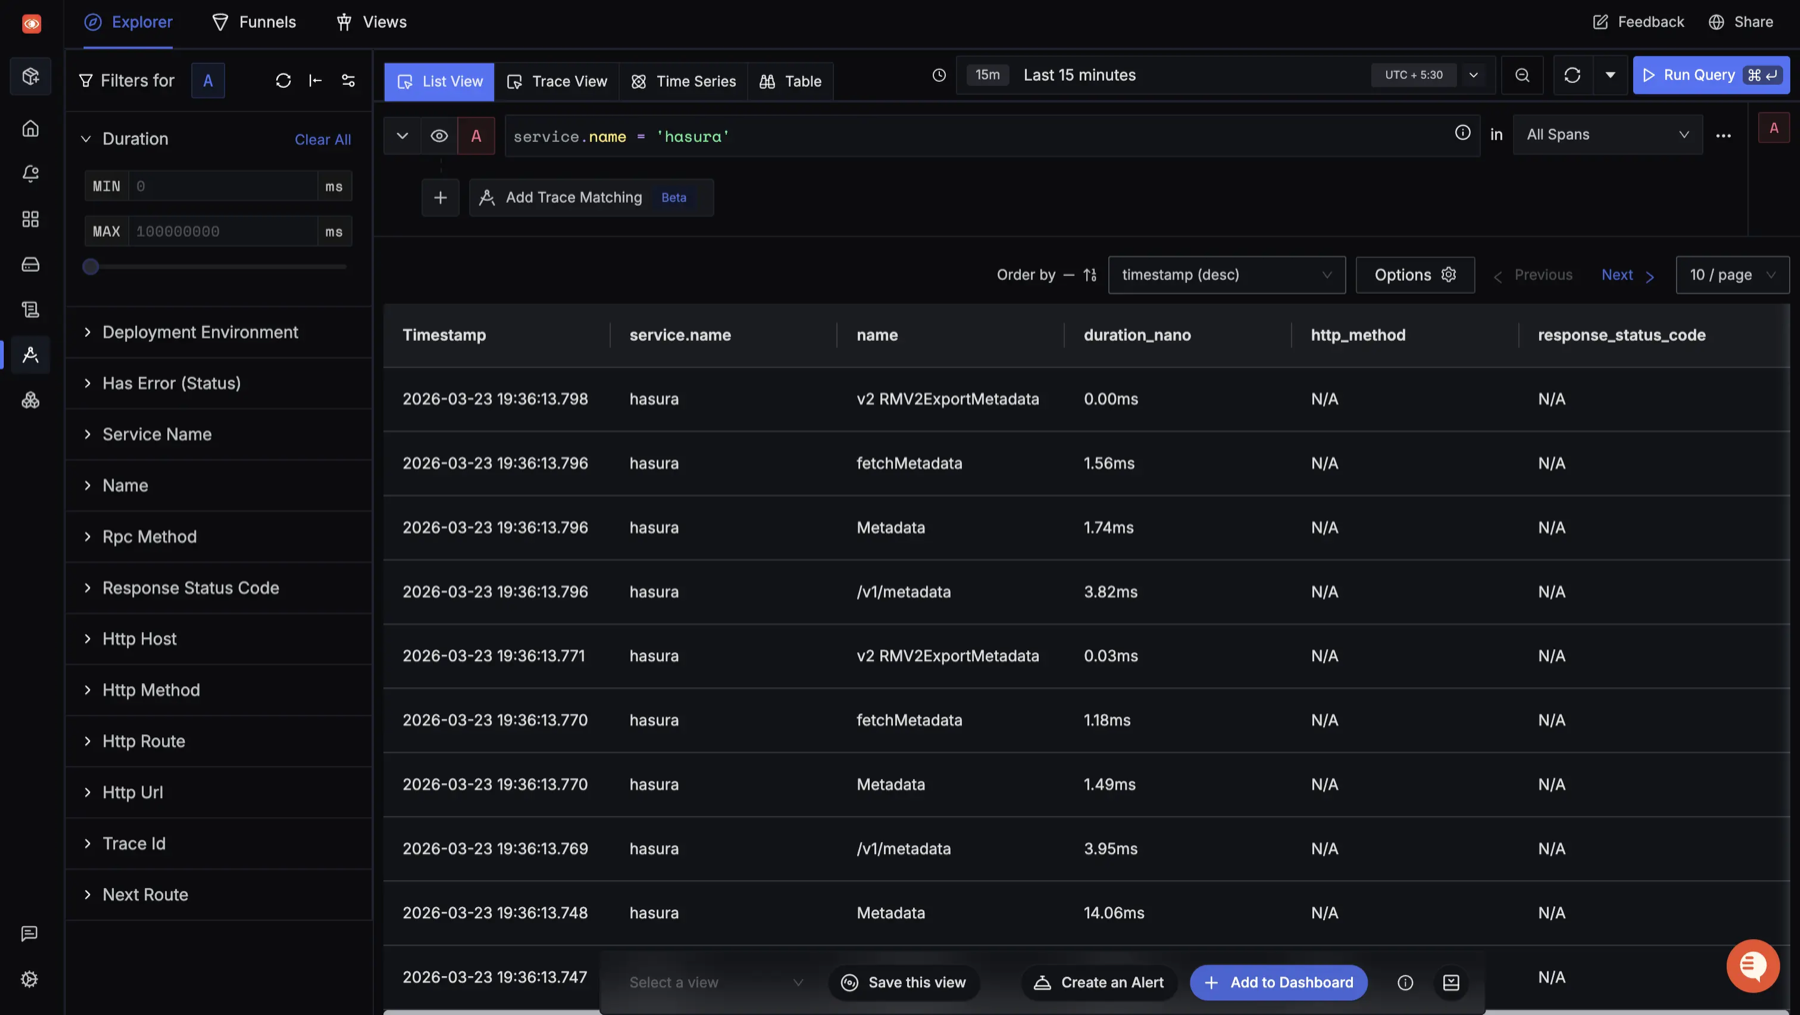
In the Traces explorer you will see spans for your GraphQL API, metadata and schema APIs, event triggers and scheduled triggers. Operations that belong to the same request share a trace ID, and requests that touch a configured data connector show the database execution as child spans.
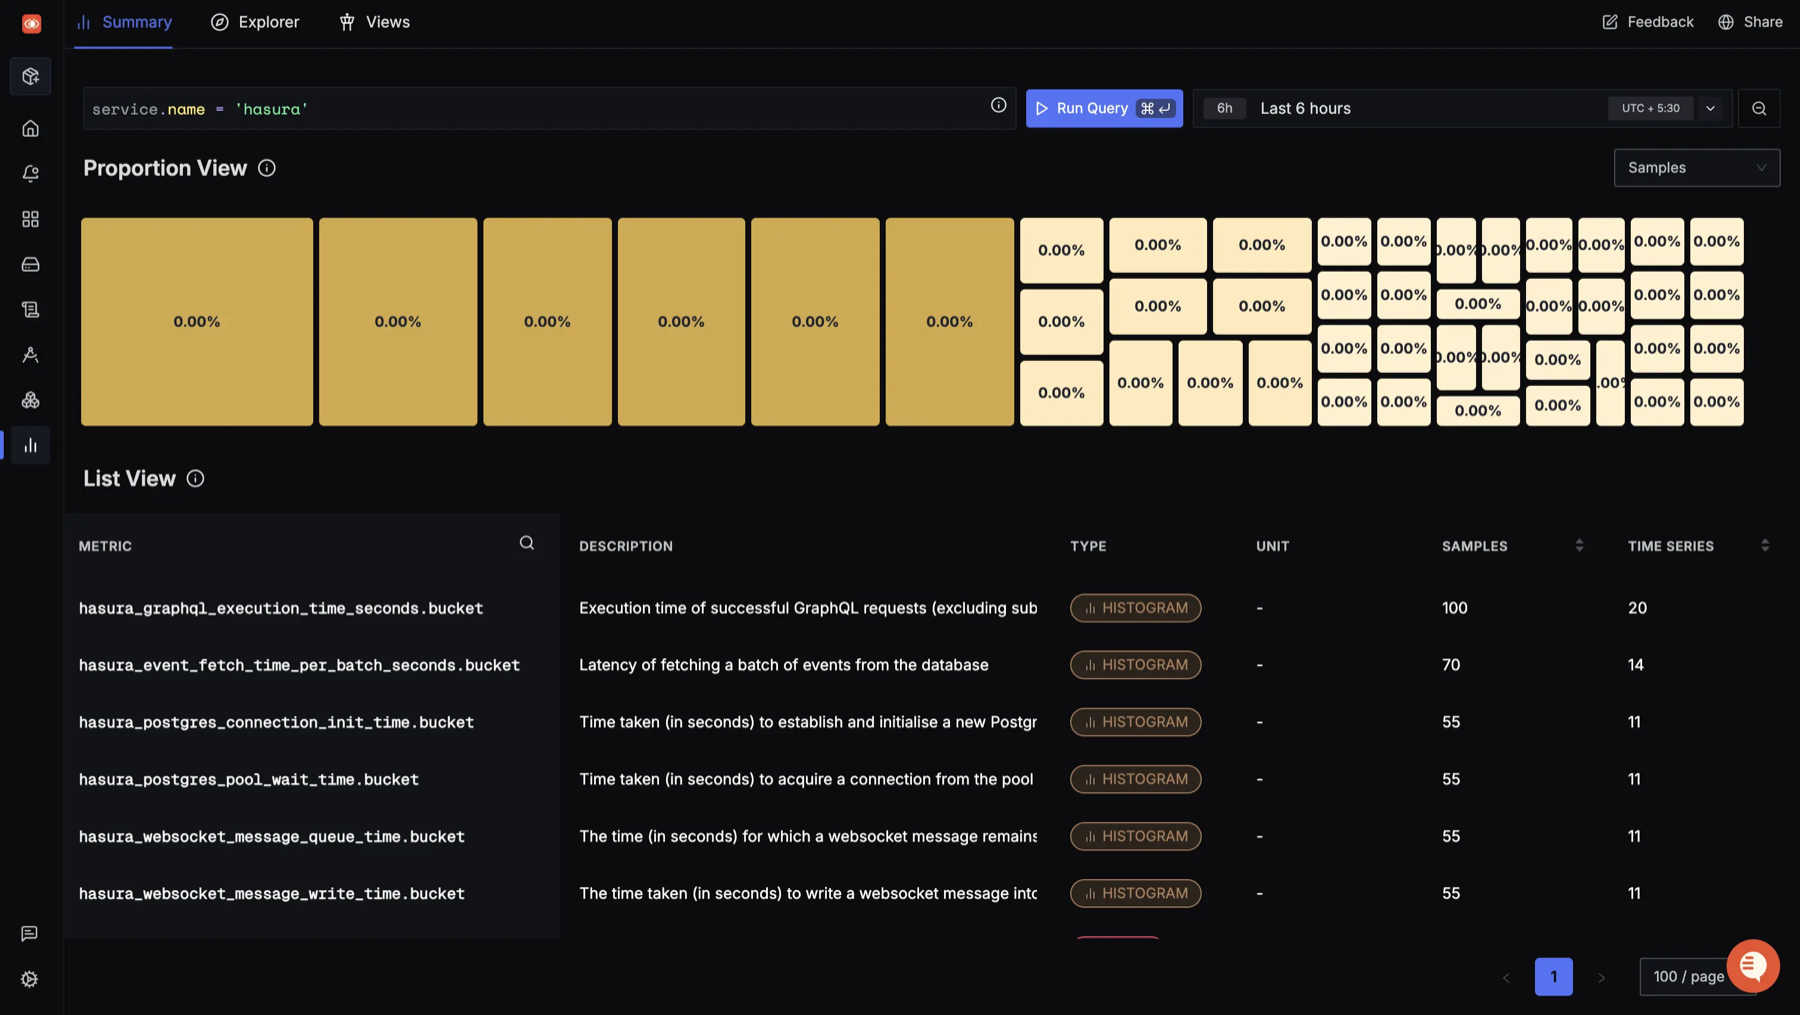
In Metrics Explorer you can query the exported metrics. These are the same set available over Prometheus, covering request rates and latencies, query execution times, event trigger performance and connection pool statistics. See Metrics for the full list.
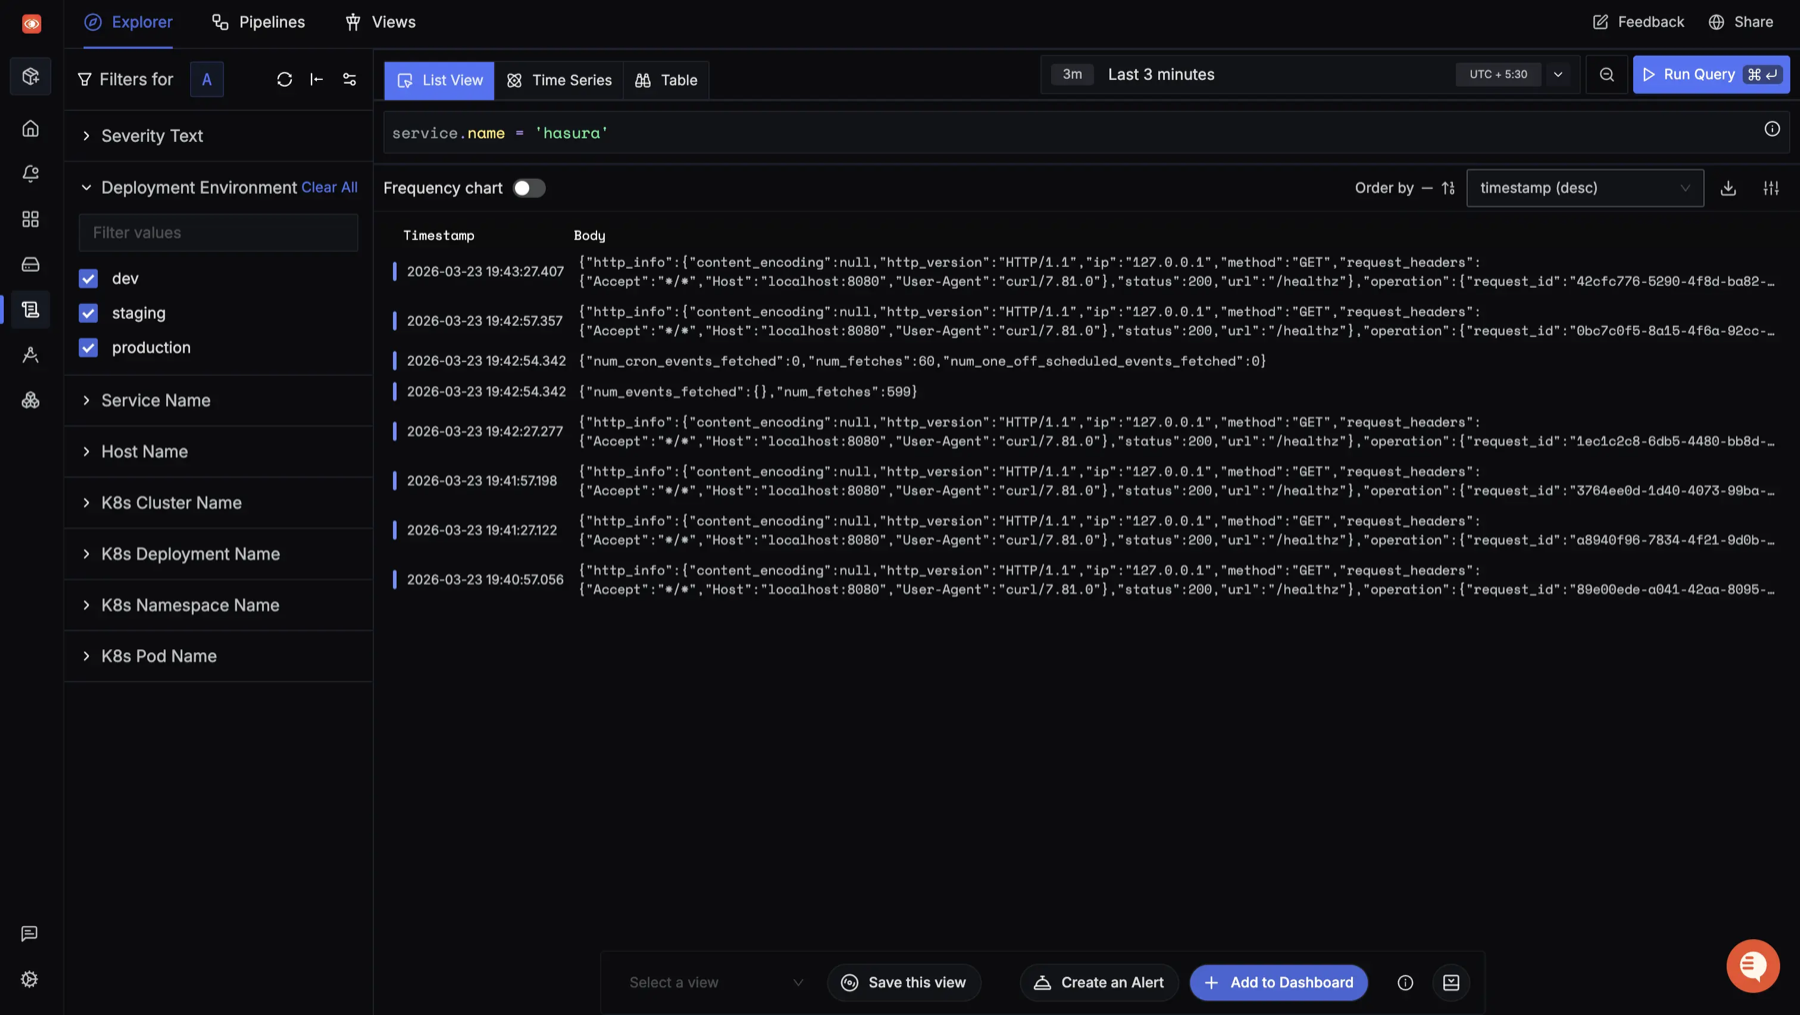
In the Logs explorer, filter by the service.name you set. Everything Hasura prints to its output stream is
exported, following the OpenTelemetry logs data model: the message is in body, the log level is in severity, and
Hasura's own log type is in attributes.type, so you can narrow to a single category such as http-log, query-log or
webhook-log.
Step 5: Build dashboards and alerts
Once data is flowing, you can build dashboards on the Hasura metrics and set alerts on them, for example on GraphQL request error rates or p95 latency. Because traces, metrics and logs land in the same place, you can move from an alert to the traces behind it without changing tools.
- Manage dashboards to visualise Hasura performance
- Alerts management to alert on error rates or high latency
- Distributed tracing to find bottlenecks across the GraphQL request
- Logs query builder to query the exported logs
For guidance on what to configure and what to watch on the Hasura side, see OpenTelemetry best practices.
Troubleshooting
If no data appears in SigNoz, check the following:
- Endpoint paths. Each endpoint must end in
/v1/traces,/v1/metricsor/v1/logs. Hasura does not add these for you. - Ingestion key. Confirm the header name is exactly
signoz-ingestion-keyand that the key is active. - Region. The region in the endpoint host has to match the region of your SigNoz account.
- Version. Metrics need
v2.31.0or later and logs needv2.35.0or later. On an older version the exporter will send traces only. - Signal selection. A signal is only exported if its data type is selected in the exporter configuration, in addition to having an endpoint set.