Troubleshooting Guide for logs
Logs are critical for monitoring, debugging, and ensuring the stability of your Hasura-powered applications. By reviewing logs, you can gain insights into the behavior of your GraphQL API, diagnose errors, and monitor performance trends.
Configuring Logs in Hasura
To enable logs, you must configure the following environment variable:
HASURA_GRAPHQL_ENABLED_LOG_TYPES
You can find detailed information about different log types supported by Hasura in the Hasura Documentation. Grafana provides a filter that allows you to filter different log types.
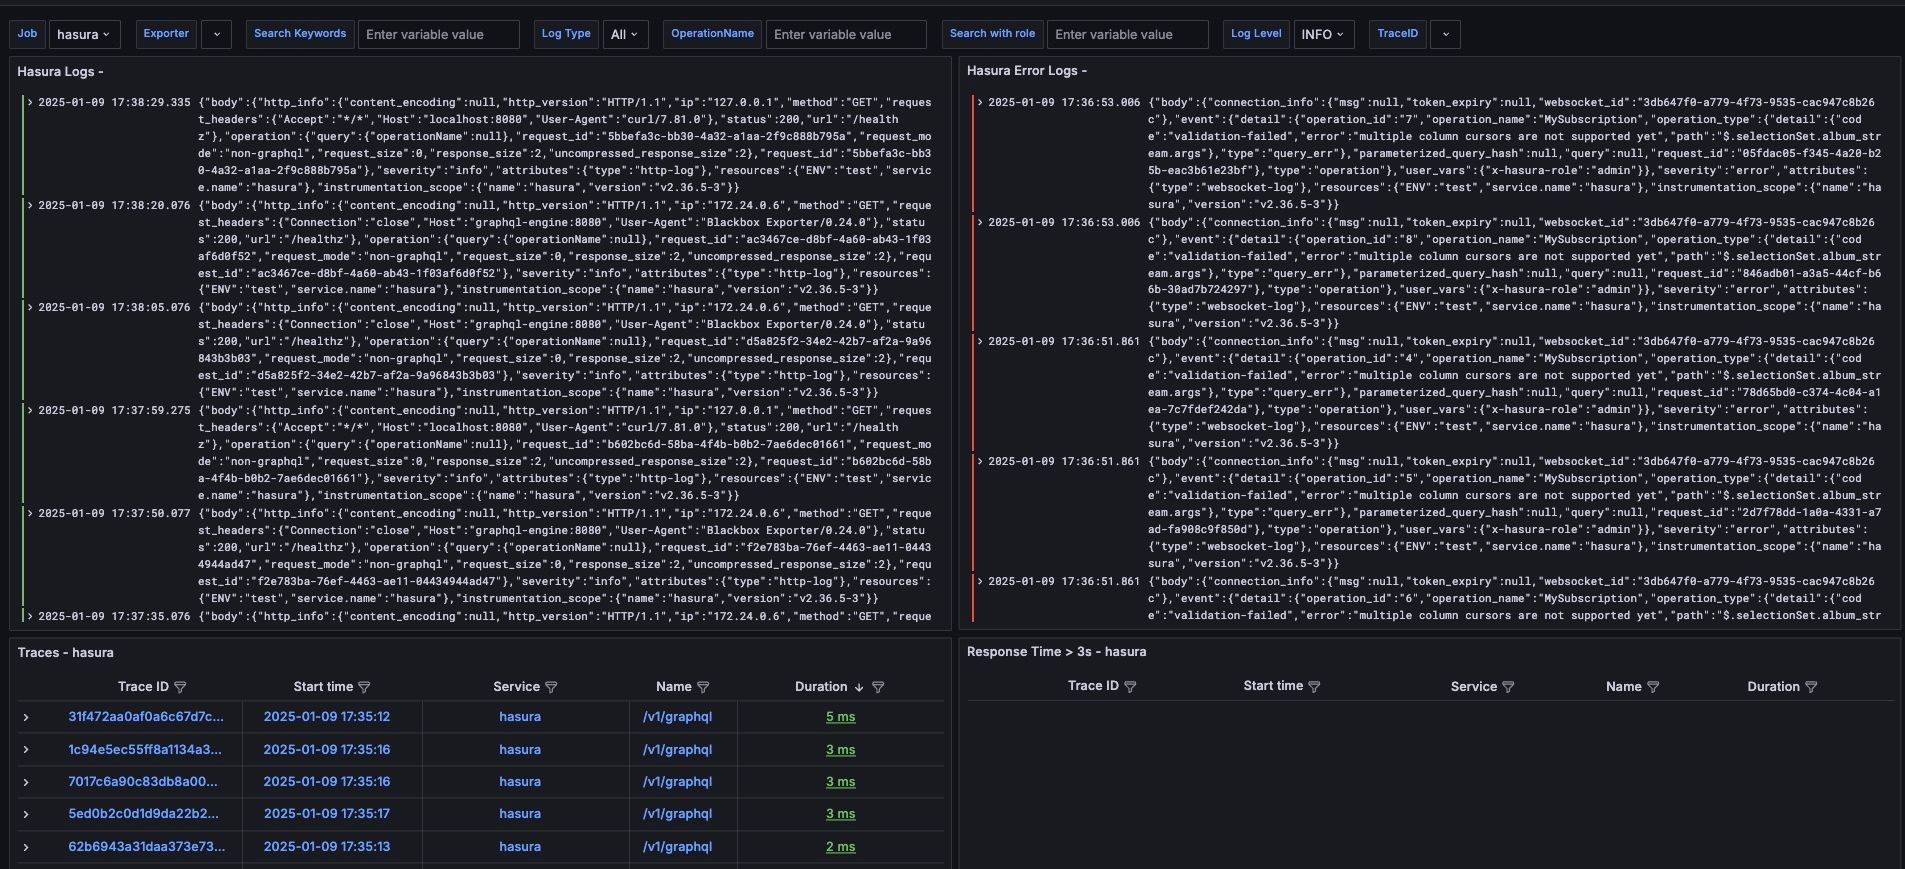
Searching Logs in Grafana
You can perform searches in Grafana using the search bar. Example searches include:
OperationNamerequest_iderror
Separate Logs for Errors and Successes
- For effective troubleshooting, it's recommended to separate error logs and success logs. This makes it easier to pinpoint issues when they arise.
- You can add custom filters to your log searches for faster identification of issues. Examples include:
OperationNameRoles
How to Troubleshoot a Query Using Logs
To troubleshoot a query, focus on the following important attributes:
attributes_typebody_operation_error_errorbody_operation_query_operationNamebody_operation_query_querybody_http_info_urlbody_operation_error_code
Steps to Troubleshoot
- Collect Request ID and Trace ID: These identifiers are crucial for tracking and diagnosing issues.
- Check
operationName: Look underbody_operation_query_operationNameand, if enabled, checkbody_operation_query_queryfor the GraphQL query. - Check Database Queries: You can find database query details in the trace logs.
Issues with Loki?
If you're encountering issues with Loki, consider the following configuration suggestions:
- Suggested Configuration: Ensure that your Loki configuration aligns with your system's requirements and optimizations. More details are available in the Loki Documentation.
Sample Loki Queries
- Filter by error messages:
{service_name="hasura"} |= "error" - Filter by validation errors:
{service_name="hasura"} |= "validation-failed"
Examples
Check out the enterprise observability boilerplate.