Troubleshooting Guide for Traces
Troubleshooting Traces
Traces are invaluable for debugging, performance analysis, and understanding request flows. This section explains how to
leverage traces, including their integration with Error TraceQL queries, alerts, and how to use request_id and
trace_id for pinpointing issues.
Understanding Traces
To fully understand and utilize traces, refer to the following resources:
Traces provide valuable insights into the flow of requests and performance bottlenecks. They typically list spans with details such as operation execution time, database queries, and the request lifecycle.
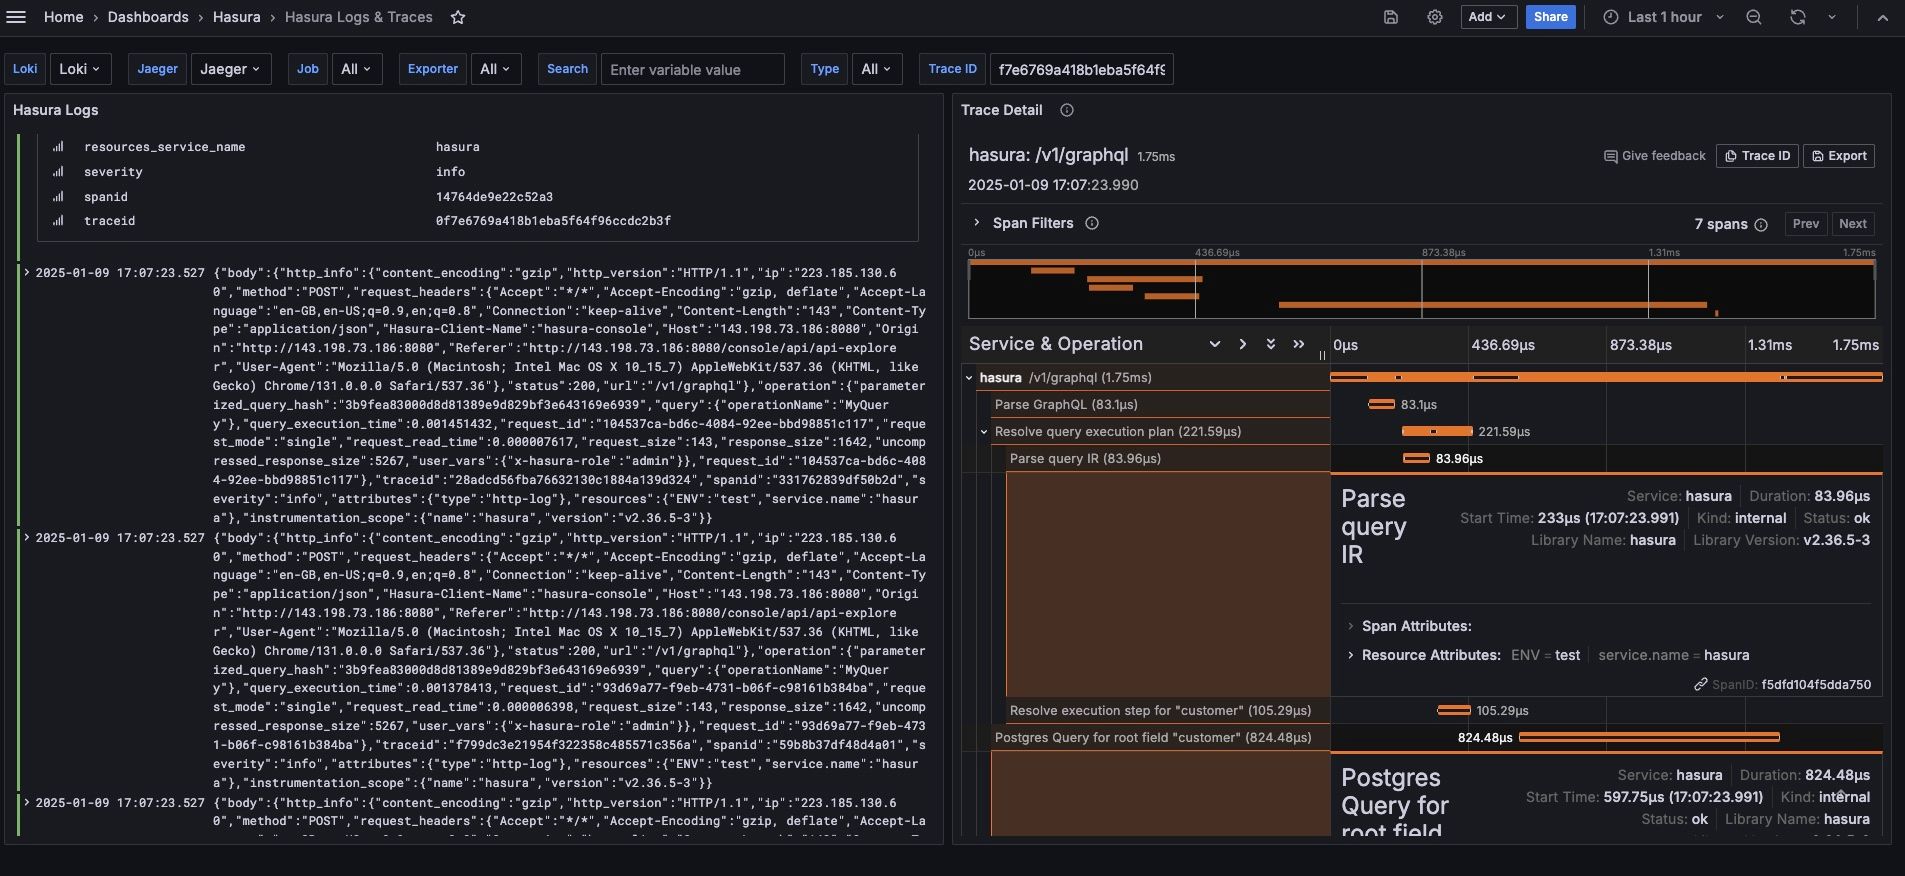
Major Spans in Hasura
/v1/graphql: Responsible for executing the GraphQL query.- Resolve Query Execution Plan: Includes parsing and planning of the GraphQL query.
Common Tags in Traces
db.query: SQL queries performed on the database.db.system: Database system name.enduser.role: The role of the end user.graphql.operation.type: The type of GraphQL operation.graphql.operation.name: The name of the GraphQL operation.graphql.query: The GraphQL query from the client.request_id: The unique request identifier.service.name: The name of the GraphQL service.source.kind: The source of the database.status: The query's status.
Filtering Traces
You can filter traces using any of the above tags. Here are some examples:
- Gather traces for admin role:
{resource.service.name="hasura" && span.enduser.role="admin"} - Gather traces for a specific operation name:
{resource.service.name="hasura" && span.graphql.operation.name="test"} - Gather traces for mutations:
{resource.service.name="hasura" && span.graphql.operation.type="mutation"} - Filter traces with duration greater than 3 seconds:
{resource.service.name="hasura" && name="/v1/graphql" && duration > 3s}
How to Use Traces Effectively
Traces are invaluable for debugging, performance analysis, and understanding request flows. This section explains how to
leverage traces, including their integration with Error TraceQL queries, alerts, and how to use request_id and
trace_id for pinpointing issues.
Error TraceQL Queries
Error TraceQL queries allow you to filter and analyze traces based on specific error conditions in your GraphQL operations. With TraceQL, you can:
- Identify failed operations and their causes.
- Filter traces by operation name, error type, or error message.
- Perform root cause analysis by following the flow of failed requests.
Request ID and Trace ID
Both request_id and trace_id are critical for tracking and debugging GraphQL operations. They provide a unique way
to trace the request lifecycle across various services, helping you isolate issues.
Visualizing Traces
Traces provide a comprehensive view of GraphQL errors and performance. They help you:
- Visualize where the request failed (e.g., authorization, SQL execution).
- Understand dependencies between nested GraphQL fields and operations.
- Debug complex issues involving multiple layers (e.g., resolvers, remote schemas).
SQL Query Insights
Traces reveal the exact SQL queries generated by Hasura, which is crucial for debugging database issues or optimizing performance. Traces help you:
- Identify slow database queries.
- Track the execution time of queries at various stages.
- Optimize query performance based on trace data.
Identifying Long-Running Database Processes
Traces help identify long-running queries, which are critical for performance optimization. By pinpointing which parts of the request consumed the most time in the database, you can optimize slow-performing queries and improve overall system efficiency.
Examples
Check out the enterprise observability boilerplate.