


Query performance
Table of contents
Introduction
Sometimes queries can become slow due to large data volumes or levels of nesting. This page explains how to identify the query performance, how the query plan caching in Hasura works, and how queries can be optimized.
Analysing query performance
Let’s say we want to analyse the following query:
query {
   authors(where: {name: {_eq: "Mario"}}) {
      rating
   }
}
In order to analyse the performance of a query, you can click on the Analyze button on the Hasura console:

The following query execution plan is generated:
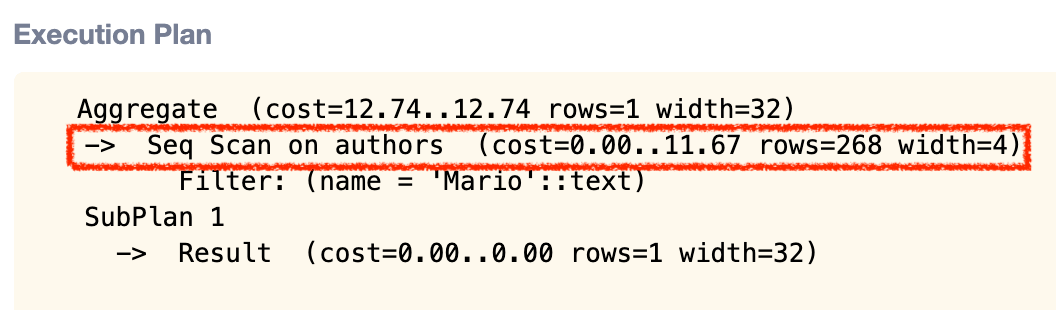
We can see that a sequential scan is conducted on the authors table. This means that Postgres goes through every row of the authors table in order to check if the author’s name equals “Mario”.
The cost of a query is an arbitrary number generated by Postgres and is to be interpreted as a measure of comparison rather than an absolute measure of something.
Read more about query performance analysis in the Postgres explain statement docs.
Query plan caching
How it works
Hasura executes GraphQL queries as follows:
- The incoming GraphQL query is parsed into an abstract syntax tree (AST) which is how GraphQL is represented.
- The GraphQL AST is validated against the schema to generate an internal representation.
- The internal representation is converted into an SQL statement (a prepared statement whenever possible).
- The (prepared) statement is executed on Postgres to retrieve the result of the query.
For most use cases, Hasura constructs a “plan” for a query, so that a new instance of the same query can be executed without the overhead of steps 1 to 3.
For example, let’s consider the following query:
query getAuthor($id: Int!) {
   authors(where: {id: {_eq: $id}}) {
      name
      rating
   }
}
With the following variable:
{
   "id": 1
}
Hasura now tries to map a GraphQL query to a prepared statement where the parameters have a one-to-one correspondence to the variables defined in the GraphQL query. The first time a query comes in, Hasura generates a plan for the query which consists of two things:
- The prepared statement
- Information necessary to convert variables into the prepared statement’s arguments
For the above query, Hasura generates the following prepared statement (simplified):
select name, rating from author where id = $1
With the following prepared variables:
$1 = 1
This plan is then saved in a data structure called Query Plan Cache. The next time the same query is executed,
Hasura uses the plan to convert the provided variables into the prepared statement’s arguments and then executes the statement.
This will significantly cut down the execution time for a GraphQL query resulting in lower latencies and higher throughput.
Caveats
The above optimization is not possible for all types of queries. For example, consider this query:
query getAuthorWithCondition($condition: author_bool_exp!) {
   author(where: $condition)
      name
      rating
   }
}
The statement generated for getAuthorWithCondition is now dependent on the variables.
With the following variables:
{
   "condition": {"id": {"_eq": 1}}
}
the generated statement will be:
select name, rating from author where id = $1
However, with the following variables:
{
   "condition": {"name": {"_eq": "John"}}
}
the generated statement will be:
select name, rating from author where name = 'John'
A plan cannot be generated for such queries because the variables defined in the GraphQL query don’t have a one-to-one correspondence to the parameters in the prepared statement.
Query optimization
Using GraphQL variables
In order to leverage Hasura’s query plan caching (as explained in the previous section) to the full extent, GraphQL queries should be defined with variables whose types are non-nullable scalars whenever possible.
To make variables non-nullable, add a ! at the end of the type, like here:
query getAuthor($id: Int!) {
   authors(where: {id: {_eq: $id}}) {
      name
      rating
   }
}
If the ! is not added and the variable is nullable, the generated query will be different depending on whether an id is passed or whether the variable is null
(for the latter, there is no where statement present). Therefore, it’s not possible for Hasura to create a reusable plan for a query in this case.
Note
Hasura is fast even for queries which cannot have a reusable plan. This should concern you only if you face a high volume of traffic (thousands of requests per second).
Using PG indexes
Postgres indexes are special lookup tables that Postgres can use to speed up data lookup. An index acts as a pointer to data in a table, and it works very similar to an index in the back of a book. If you look in the index first, you’ll find the data much quicker than searching the whole book (or - in this case - database).
Let’s say we know that authors table is frequently queried by name:
query {
   authors(where: {name: {_eq: "Mario"}}) {
      rating
   }
}
We’ve seen in the above example that by default Postgres conducts a sequential scan i.e. going through all the rows. Whenever there is a sequential scan, it can be optimized by adding an index.
The following statement sets an index on name in the authors table.
CREATE INDEX ON authors (name);
Data -> SQL tab in the Hasura console.Create a migration manually and add your create index statement to the up.sql file.
Also, add an SQL statement to revert that statement to the down.sql file in case you need to roll back the migration.
Apply the migration by running:
hasura migrate apply
You can add an index by making an API call to the run_sql metadata API:
POST /v1/query HTTP/1.1
Content-Type: application/json
X-Hasura-Role: admin

{
   "type": "run_sql",
   "args": {
      "sql": "<create index statement>"
   }
}
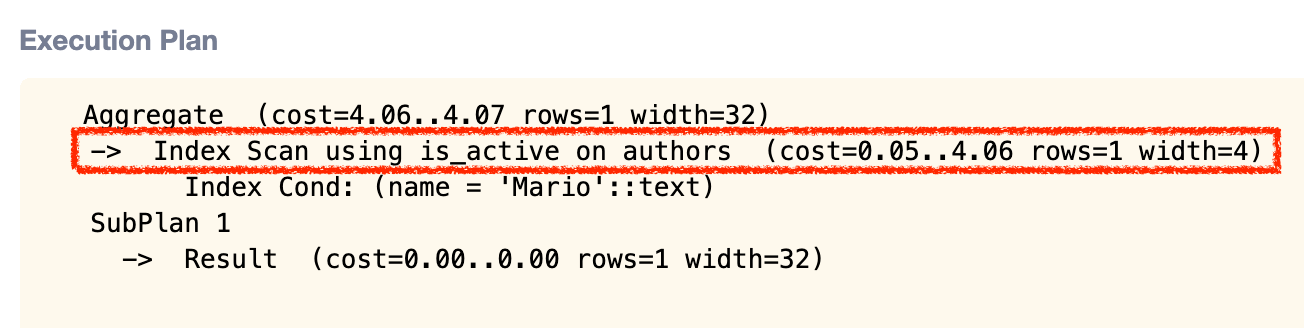
Let’s compare the performance analysis to the one before adding the index.
What was a sequential scan in the example earlier is now an index scan. Index scans are usually more performant than sequential scans.
We can also see that the cost of the query is now lower than the one before we added the index.
Note
In some cases sequential scans can still be faster than index scans, e.g. if the result returns a high percentage of the rows in the table. Postgres comes up with multiple query plans and takes the call on what kind of scan would be faster.
 Thank you for subscribing to our newsletter!