Pre-built Dashboards
Available on: Self-Hosted Enterprise
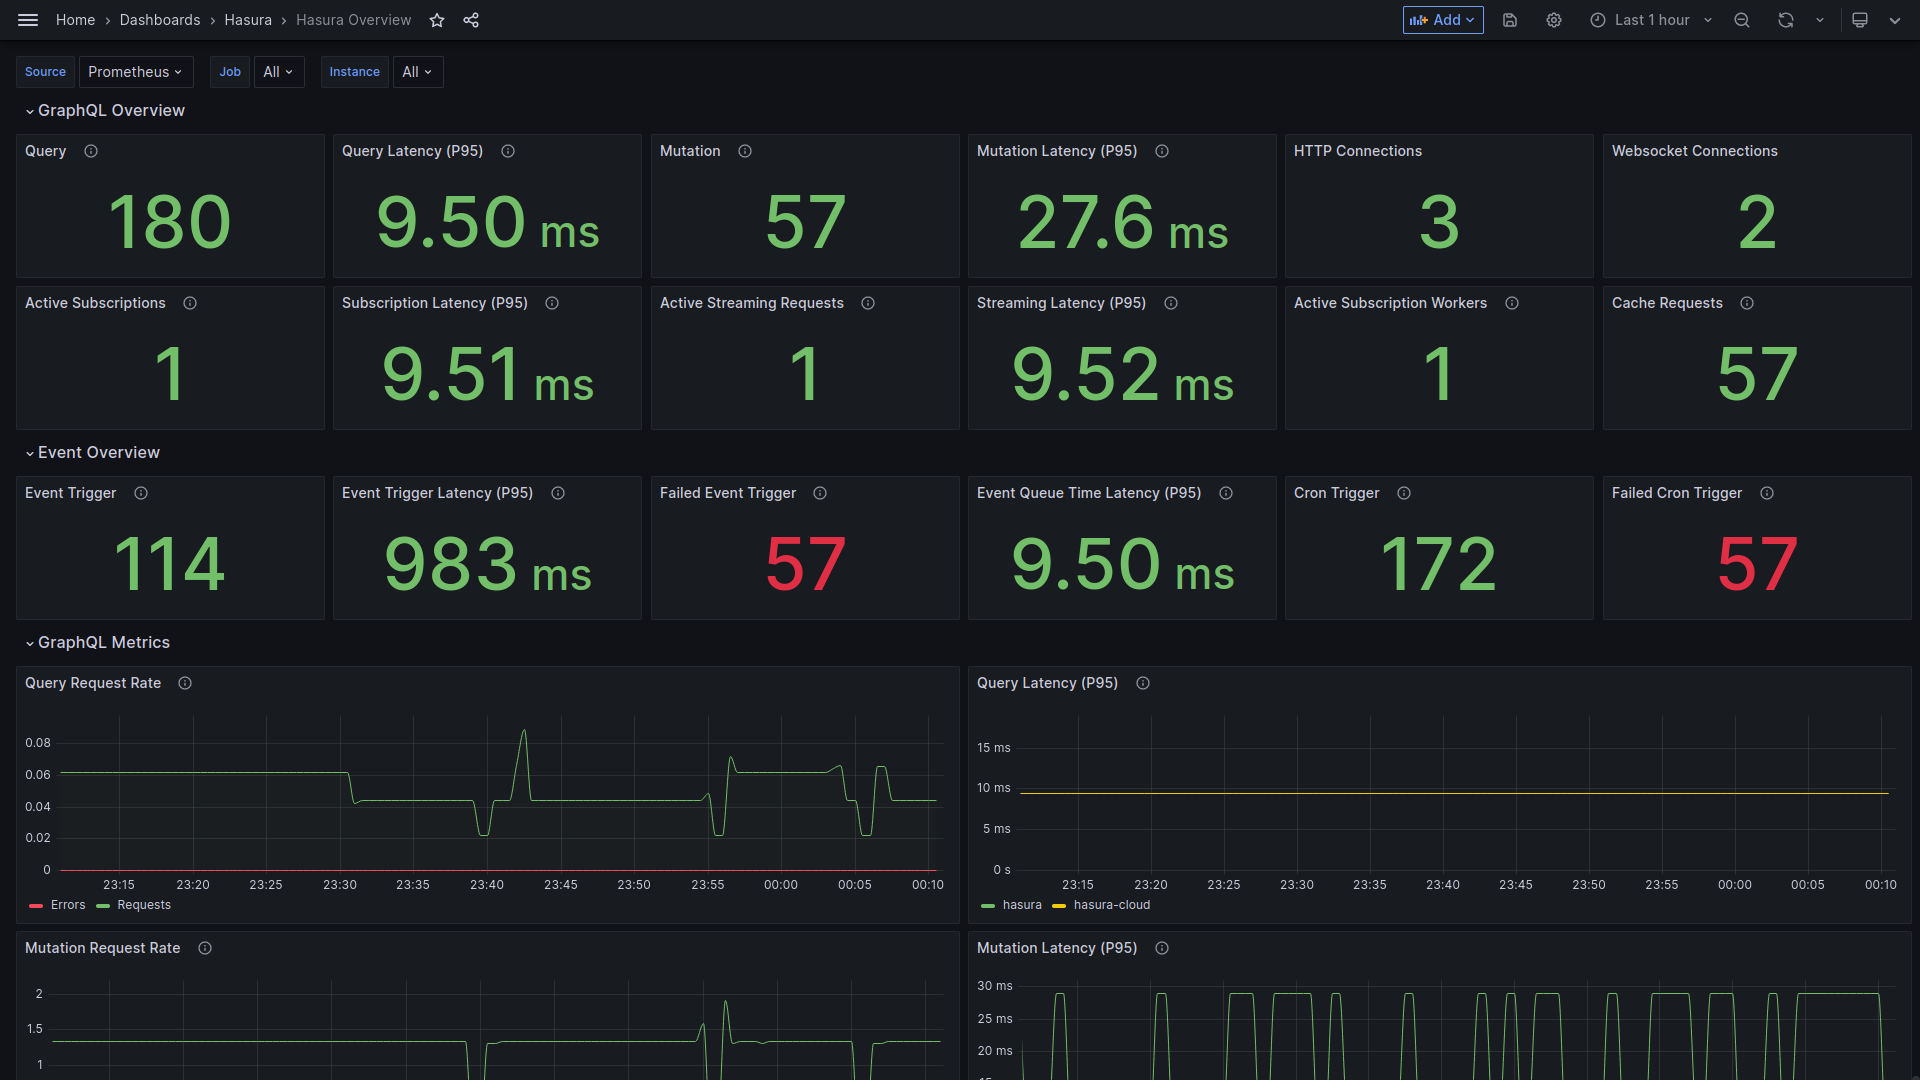
Grafana Dashboards
You can download dashboards on the Hasura organization page on Grafana Cloud, or from the demo repository below.
Demo
Introduction
If you're running Hasura EE yourself, you have metrics available over a Prometheus endpoint, Traces available over OpenTelemetry and Logs available over stdout. We have set up a boilerplate folder where we have configured Hasura along with:
- Prometheus for metrics collector.
- Jaeger for Traces collector.
- Alert Manager and regular alert rules.
- Node Exporter for system metrics.
- Blackbox Exporter for HTTP health checks.
- Grafana with a few sample dashboards.
- Loki and Promtail for logging collector.
- Hasura migrations, metadata examples and enterprise enabled services (Caching, Read Replicas, Data Connectors).
The repository helps you quickly start and explore the latest observability feature updates, dashboards, and alert templates for monitoring in production.
Get Started
Clone the observability boilerplate to your local machine, copy the sample environment file dotenv to .env, and edit the enterprise
license key (HGE_EE_LICENSE_KEY) and secrets. The demo uses Docker Compose to
setup container services.