
GraphQL Performance Benchmarks: Hasura vs Apollo with Oracle RDS
In this blog post, we dive deep into a benchmarking project designed to showcase the performance characteristics of Apollo and Hasura GraphQL Engine connected with Oracle RDS when handling large datasets. The goal is to provide you with insights and a clear understanding of their capabilities under heavy loads.
Also, feel free to skip to the benchmark results below to analyze how Hasura GraphQL API outperforms a DIY Node.js GraphQL API written in Apollo Server.
TLDR
This benchmark guide covers everything from setting up an Oracle database and creating a GraphQL server to building a comprehensive test suite using the K6 framework and visualizing the results with Chart.js, so that you can run these on your own for your specific workloads and use case.
The instructions allow you to (with relative ease):
- Spin up an Oracle database
- Create the DB schema, populate it with a large data set, then create keys and indexes
- Create two GraphQL servers (Apollo and Hasura)
- Build a fully functional TEST suite, leveraging the K6 framework
- Create relevant visualizations based on the K6 data using Chart.js
Also, we published a benchmark about how Hasura is faster than DIY Node.js GraphQL server connected to a PostgreSQL Database.
Pre-requisites
You'll need to have at least the following ready:
- Databases - located as close to the EC2 or other instance as is feasible.
- An Oracle database with at least 50GB disk, decent IOPS, memory and bandwidth provisioned and ready.
- A PostgreSQL database (used only to host Hasura metadata).
- An EC2 or other instance from which to run the two GraphQL servers.
- A container orchestration and management platform for Hasura - Docker will do, K8s is best!
- Node.js & NPM installed. Node is required for the Apollo Server, the k6 test suite, and the char/viz tools.
Database design/setup
I chose the commonly used TPC-H schema, as it matches a reasonable use-case, coveres primary and foreign key relationships and indexes with a relatively good approximation of in an industry standard data-set. In addition, TPC-H has very good, well published and open source data-generation tooling, making it easy to create arbitrarily large amounts of data to populate the schema with.
For more info on TPC, TPC-H and data-generation tools, visit the TPC-H Official Website
For more on the TPC-H DBGEN tooling – have a look at the article on Deister Cloud which does a rather good job explaining it's compilation and use.
I have included a Zip file (in the TPCH directory) with CSVs. There are a TON of ways to import CSV data to your Oracle DB. I ended up using Oracle's SQLDeveloper tool, due to the very simple, graphical interface and minimal setup requirement. You can download SQLDeveloper (and pre-requisites) here. Importing CSVs is super easy with the tool – but if you need a hint, look here. Using the CSVs will populate your TPC-H schema with 8.7GB data.
GraphQL servers
As metioned in the description above, the test-suite expects two GraphQL Servers. A Node.js based Apollo server and Resolvers/Data-Loaders appropriate for querying an Oracle RDS TPC-H data-source are included in this package (in the apollo directory). You'll need to download/deploy Hasura separately (inks/instructions below). K8s is preferred, but Docker is also sufficient (and what I used for my testing).
GraphQL caching
- Apollo
- NO caching is explicitly used as data-loaders are re-created for each query.
- Hasura
- Hasura has query caching capabilities when used with an Enterprise License and a Redis database, but neither will be used for these tests.
Configure the GraphQL servers
Apollo
Apollo-server may be run/tested by executing npm start from the apollo directory. You should then be able to open the Apollo GraphQL Query interface by navigating to http://[hostbname]:4000 Run a few test queries from this interface to ensure Apollo is running properly.
- Database Connection: Open apollo/index.js and configure the database connection information, located on lines 12 and 13.: mypw and oracleHost.
- No other configuration is required. The included test execution scripts will handle start/stop of the NPM application.
Hasura
- Install Hasura
- Use the docker quickstart and get Hasura up and running on the same instance with Apollo Server.
- Alternatively, deploy Hasura to your k8s cluster, on the same instance with the Apollo Server.
- Ensure appropriate ENV settings for connection to PostgreSQL and ports for the GraphQL server, and data-connectors.
- Make sure Hasura is running (Docker or K8s), and navigate to http://[hostname]:8080 using the host/port configured.
- Configure the database connection for Hasura, then add/track all tables and relationships.
- Execute one or two queries to validate your configuration.
The Test Suite
The test suite config and visualizations/chart code is all located in the ./k6 directory. The k6/k6QuerySamples directory contains four JS files, each showcasing an example of an individual k6 test script. Take note of the slight differences in the way the GraphQL queries are written, and the port/urls used. The test scripts all use "localhost" and port 4000 (Apollo) or 8080 (Hasura). I may revisit and make this configurable in future. Apollo scripts (appropriately named) and HGE scripts, for Hasura.
Large Payload Tests
The largePayloadTests directory contains queries against Hasura only, for the lineitem table to test how Hasura handles large payloads. These can be adapted to perform the same tests for Apollo quite easily. I do, however, recommend you use a VERY large cluster/server config. I have typically seen that, as payload size increases, the memory utilization/requirements of the GraphQL Server increase. Be sure you run appropriate hardware monitoriing - should you choose to use/execute these tests.
Tests
The primary scripts used in this test suite are located in the k6/tests directory. These scripts adhere to the following naming convention:
- [Server (Apollo/Hasura)]-[QueryDepth(COLPS)]-[NumberOfVirtualUsers/Concurrency]-[TestLengthInMinutes].js
- It's worth noting...
- C - Customer Table
- O - Customer Related Orders
- L - Order Related LineItems
- P - LineItem Related Parts
- S - LineItem Related Suppliers
- L - Order Related LineItems
- O - Customer Related Orders
- C - Customer Table
- The Above Query structure illustrates well how both GraphQL servers handle the N+1 problem as the query depth of related/nested entities grows.
- It's worth noting...
Test execution
Inside k6/tests you will find exeSuite.sh This is a simple shell script, designed to execute each of the tests (Apollo/Hasura js files included in the directory).
At the top of execSuite.sh you'll find a function definition "_evalBg". This function is called prior to execution of all tests. It finds and kills the node process responsible for Apollo-server, and restarts it to In order to ensure that the Apollo-Server, and associated Node server are running well, and not blocked or hung (as can easily happen with this kind of load testing, especially on servers with limited resources).
Apollo tests execute first, followed by Hasura tests. All tests write raw test results to k6/tests/output/[test-name].json When test execution is complete, you'll note (on the last line of execSuite.sh), the k6/tests/process-metrics.ts script is executed. This script parses the raw k6 JSON data for specific metrics we wish to visualize. With the current configution, we track the following:
- vus: summary.metrics.vus_max.value - the number of maximum "virtual users" configured for the test
- rps: summary.metrics.iterations.rate - the rate, or "requests per second" achieved by the test
- httpTtfbAvg: summary.metrics.http_req_waiting.avg - the "time to first byte", or time it took before ANY data was returned by the query.
- errors: summary.metrics.http_req_failed.value - the error rate. did all queries succeed? what percentage failed?
These values are aggregated by process-metrics.ts and written to k6/chart/src/data.json for use with Chart.js, an NPM visualization tool we use to display the results of our tests!
Test results
Test results can be easily viewed using the included Node Chart.js application found in k6/Chart.
- Navigate to k6/chart on the command line.
- Run "node run build" to create/compile the required HTML files.
- Run "node run dev" to start the http server, then navigate to the address/port provided in the output to view your charts!!
Sample output charts
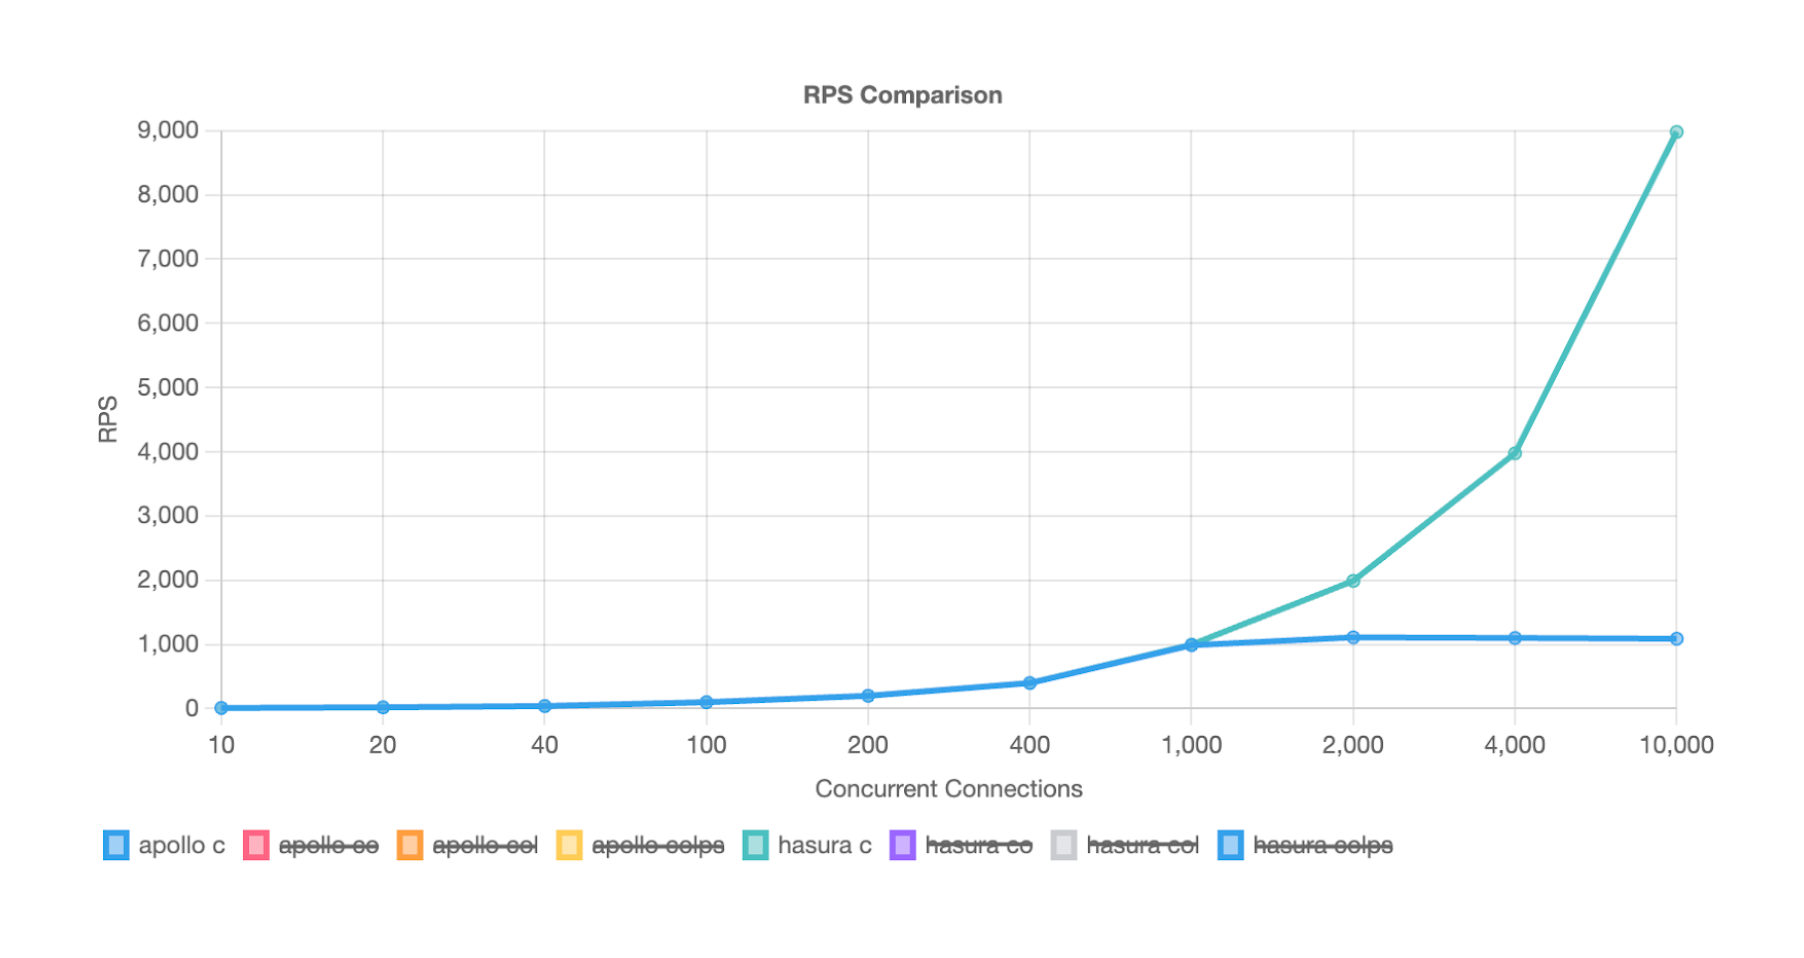
For a single customer, with no nested/related data, query performance was consistent until we reach 1k concurrent users.
In this result, Apollo would require 9x Nodes to accomplish similar performance!!
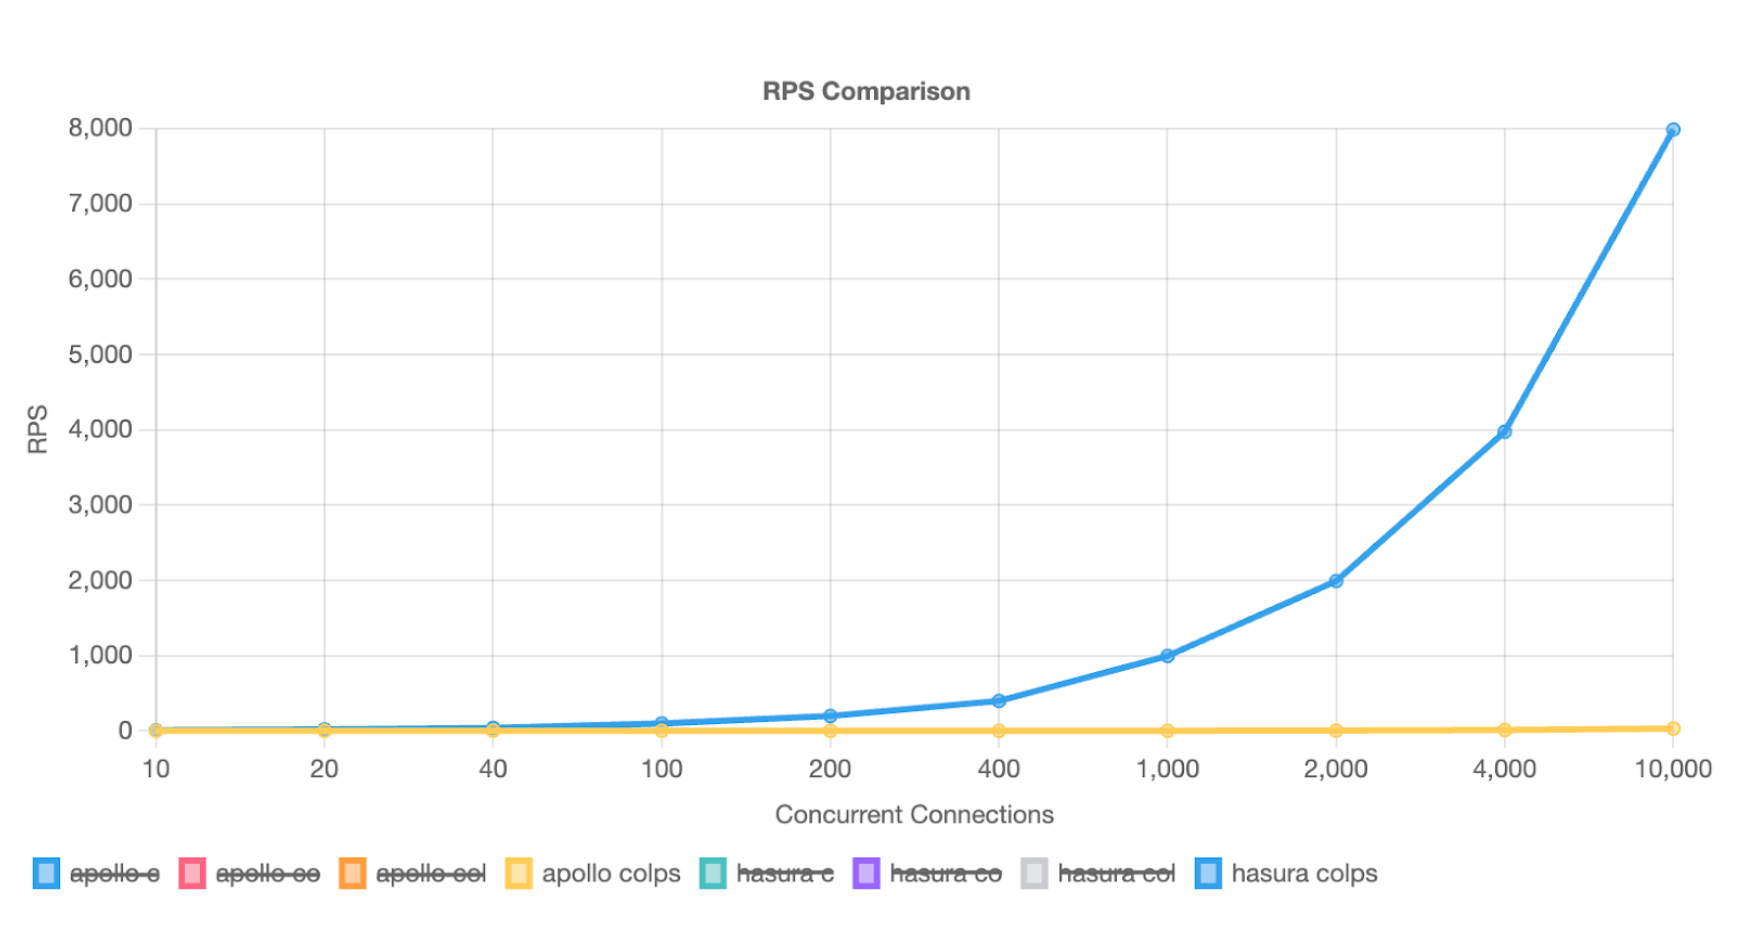
Asking for one customer and related orders, line-items, parts and suppliers (a 41k payload), we see significant RPS differences starting at only 100 concurrent users.
Resources for k6 benchmarks