Parts of Hasura's infrastructure runs on Google Kubernetes Engine (GKE). This includes around microservices which power the Hasura website among other internal services.
Last month, we started noticing delayed API responses and connection refused errors. The errors were more significant if the response body size is larger. For e.g. downloading a file became extremely slow, as slow as ~5kbps, and sometimes will time out altogether without even downloading a single byte.
This post outlines how I debugged the issue.
TL;DR
API responses were flaky, sudden slowdowns, occasional timeouts, ERR_CHUNKED_ENCODING HTTP errors
Kubernetes services/pods/endpoints were all fine, reporting healthy, but network connectivity was flaky seemingly without a pattern
All nodes were reporting healthy (as per kubelet)
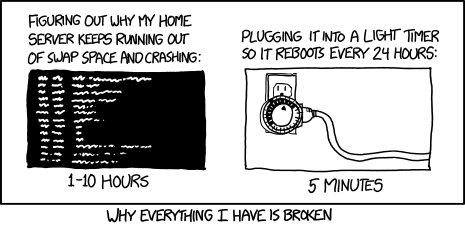
thockin recommended checking dmesg logs on each node
One particular node was running out of TCP stack memory
Lesson learned: for failures that are hard to detect, check underlying nodes
https://www.xkcd.com/1495/
We run hasura.io on the Hasura platform itself. First, I checked out the API gateway powered by Nginx, which routes requests to the corresponding microservices. Connections proxied from gateway to certain pods times out. It was as if the network performance of the entire cluster has degraded. Little to no connectivity among certain pods.
All Hasura platform components are grouped together in hasura namespace, while all custom workloads are in the default namespace. While trying to establish a correlation between these pods, I restarted all the pods in default namespace and everything started working normally. I had no clue of what the root cause was, but everything was back up as if nothing had happened. My initial assumption was this has something to do with k8s endpoints.
Two days later, it happened again, certain pages on the our docs page were not loading along with some assets on other services as well. This time, I didn’t restart all the pods, but tried to find out a correlation between the pods that were having the network connectivity issue. I kubectl exec-ed to many pods and tried to ping/download data from each other. But, nothing was making sense. Endpoints are fine, DNS is fine, services are discoverable, pods are running, no issues from localhost, yet, communication between some them were timing out, or stays hung forever.
We found a similar issue earlier where if a request hits a k8s service, but the endpoint is not available, it just hangs, instead of showing connection refused. The discussions can be found at the Github issue:
Having tried everything, I took it to twitter to get some help on debugging this issue. I tweeted out tagging a few of the core K8s developers.
How do you usually debug network issues (slow/no connection) between pods in Kubernetes clusters❓We have been experiencing this on #GKE. Restarting the pod or service works though ?
That helped! Kris Nova, Tim Hockin and Bowei Du got involved with the debugging. thockin suggested that it might likely be conntrack exhaustion and asked to check dmesg. Kubernetes and GKE says all nodes are healthy and ready. But, on checking nodes one by one, one of the node’s dmesg had many lines saying:
TCP: out of memory -- consider tuning tcp_mem
Googling around to see what tcp_mem does revealed that this error can happen when a machine’s TCP stack runs out of memory pages allocated by the kernel or when there are lot of orphaned/open sockets. Next step was to checkout TCP stack memory usage and figure out who was using it up.
The following command shows how many kernel pages can be allocated to TCP stack. When max is hit, things won’t go well.
Clearly, some program was eating up all the memory pages available to the TCP stack. Identifying the component was pretty easy since restarting it clearly brought the numbers back to normal. The program was a task queue which opens a lot of TCP sockets, but doesn’t close them under particular edge cases.
This is when it hit me, underlying machines are also part of the equation. I have been checking everything on the Kubernetes layer, nodes, deployments, pods, services, endpoints etc., but did not think about going beneath that. Since kubelet said the node was healthy, I did not bother to think beyond. It’s easy to miss fundamental issues like kernel TCP memory pages while working with higher level abstractions like Docker and Kubernetes. As thockin said:
There are still things that are not perfectly containerized. It's sort of a game of whack-a-mole, and will be for a while.
kubelet is the component responsible for monitoring health of a node. It continuously watches node’s CPU, memory and disk, and report the status to API server, and if an unhealthy status is reported API server can mark the node as non-schedulable. Fundamentally, the node was unhealthy in this case, but kubelet was not monitoring the network health. Small network packets were going through, so the node was reporting ready status to API server. But, connections with larger payloads were getting lost.
I opened an issue for kubelet to monitor tcp_mem also, since it is an important factor affecting node health, along with CPU/RAM/disk. There could be other factors like conntrack etc. that affects network performance/health. You can join the discussion here: