GraphQL Observability with Hasura GraphQL Engine and Honeycomb
Observability (in software world) means you can answer any questions about what’s happening on the inside of the system just by observing metrics from outside of the system, without having to modify the working deployment to support this.
GraphQL Observability with Honeycomb and Hasura
Why an Observable System?
Without an observable system, it would be difficult to understand what is going wrong with the system unless you are monitoring for known issues. At any point of time, you should be able to ask any arbitrary question about how your application works.
response status codes of queries/mutations/subscriptions
graphql server version
ip_address from which the query originated
and specifically in the case of Hasura GraphQL Engine, you might want to capture context like
user_id of the user who made the query
role of the user
metadata of the query
With this external information available, you can ask meaningful questions in a production deployment to find what went wrong internally, or why your GraphQL backend is behaving the way it is. For example, if you see anomalies in query execution time for a particular query hash, you can try to identify what is wrong with the query (may be there is a database bottleneck that you need to optimise).
Just having this information set up for monitoring also might not be enough. To make it meaningful, you can set up alerts — for example: triggers for requests/min, errors/min with thresholds and get notified when the server is behaving differently.
By the end of this tutorial, you should be able to setup Hasura GraphQL Engine with an observable system, Honeycomb in this case, and help you understand, optimise and control your GraphQL server. Here’s a preview of what you will get at the end.
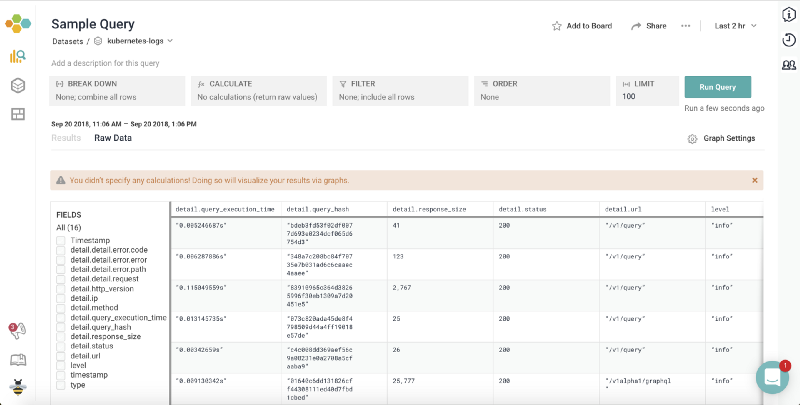
Honeycomb Dashboard with GraphQL Engine Logs
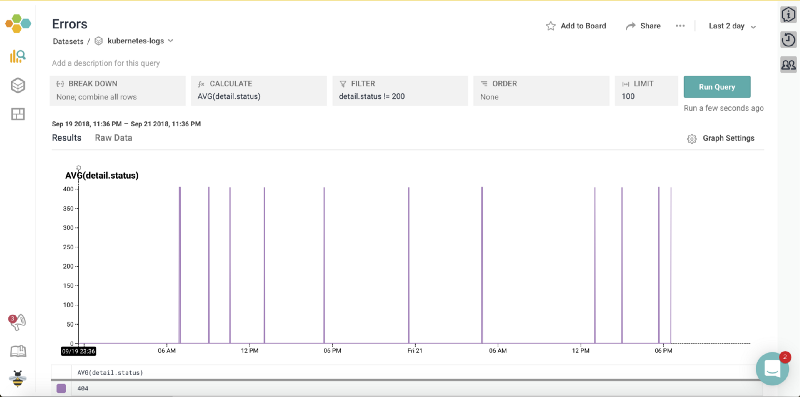
You can also choose to create a visual view of your logs based on filters. For example, to monitor error codes across a given time interval.
Error Code Capturing across 2 day time interval
Set up Hasura GraphQL Engine on GKE
This documentation assumes that you have Hasura GraphQL Engine installed on Google Kubernetes Engine. Instructions for deployment is available here.
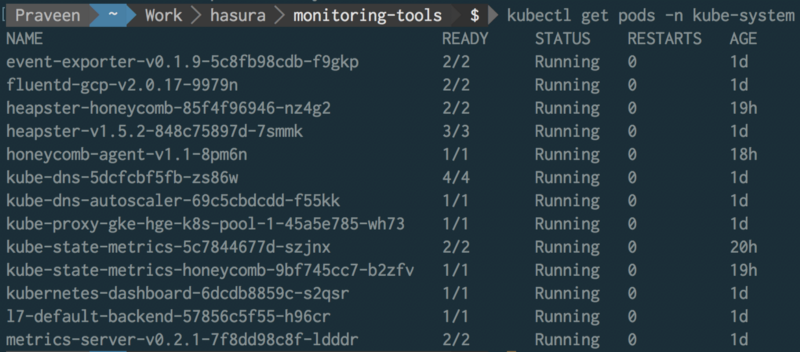
Set up Honeycomb Agent on Kubernetes
Signup on Honeycomb to start the Kubernetes agent setup. Honeycomb uses kubernetes secret to store the API key. This will be available on Honeycomb after Signing up.
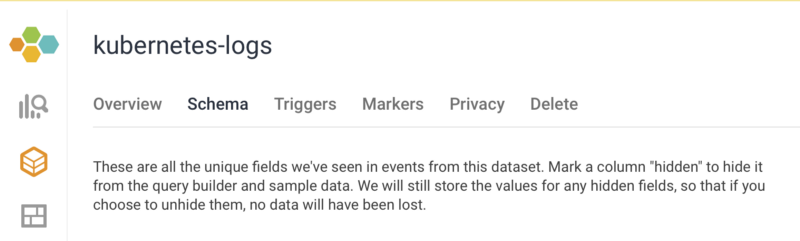
In the Honeycomb UI, go to the kubernetes-logs dataset and open the Schema tab.
Schema tab — Honeycomb Dashboard
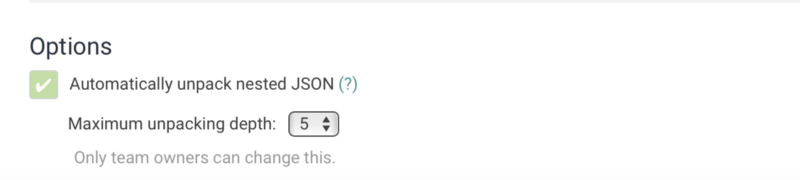
Scroll down to see options. Check the `Automatically unpack nested JSON` and select the level of nesting to `5`.
Unpack nested JSON to get detailed parsing of GraphQL Engine logs
You can now get detailed report on the logs / apply filters depending on the requirements.
You can see query_execution_time, query_hash, response_size, status code etc for inspection.
Dashboard Filters
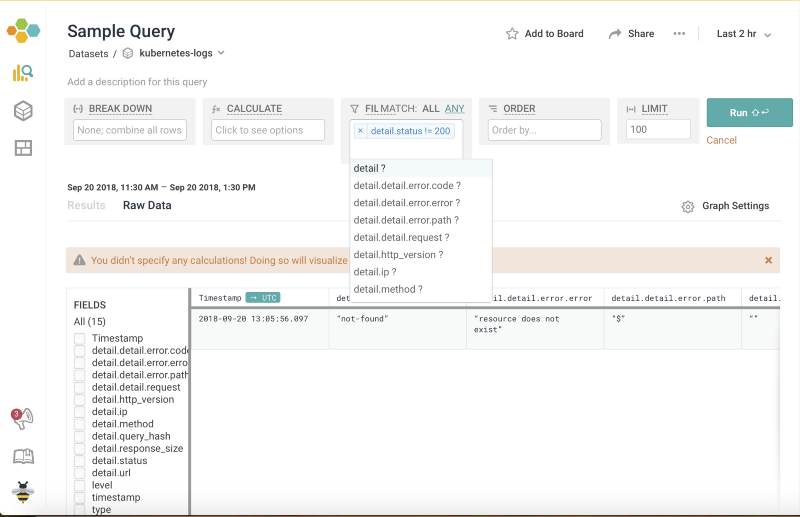
Now start apply filters to get granular details. Lets apply a filter to get all queries which resulted in an error. The filter would be detail.status != 200 . Here’s what the dashboard looks like.
Status code != 200 in GraphQL Engine
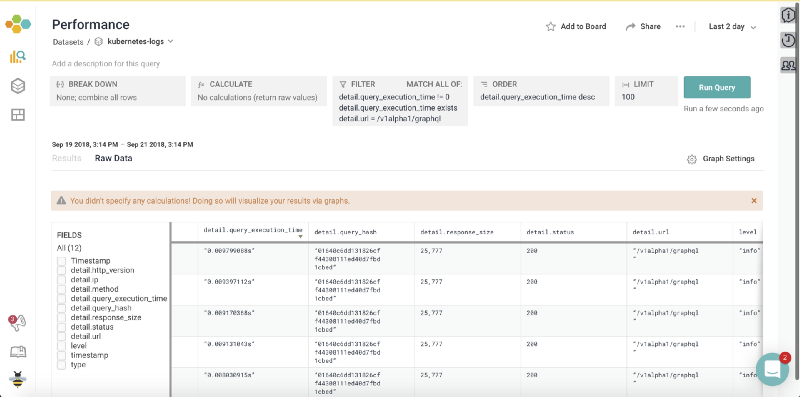
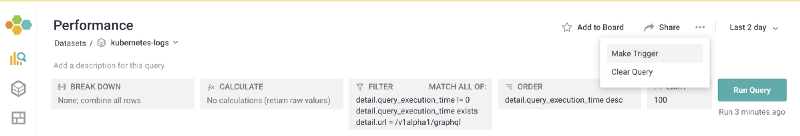
Now, lets get a performance overview by filtering/sorting queries using query_exection_time column. Here’s what a typical filter/sort would look like:
Sort most time consuming queries
Alerts for Anamolies
Now that we have got a holistic view of your GraphQL queries, let’s set up an alert to get notified via Email when something is wrong.
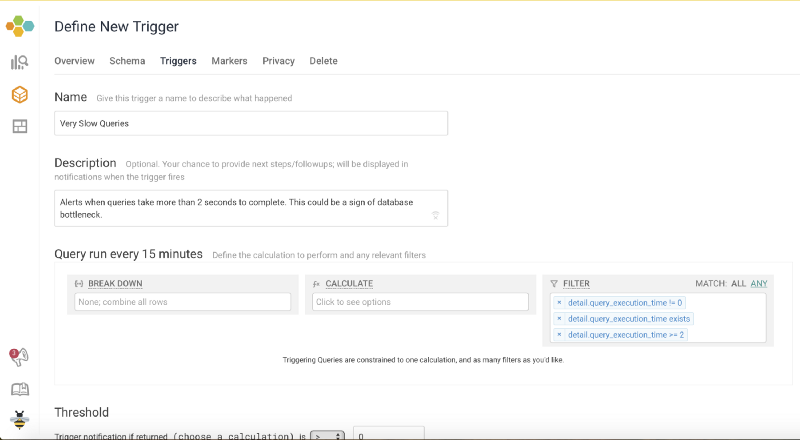
Make a Trigger
We can apply a filter for query_execution_time ≥2 to get notified for slow queries. This is just an example. You can tweak the number of seconds to a desired value depending on the application requirements.
Now, the focus can be on the application development and this observable system setup could notify us on whats going wrong with the unpredictable parts of your GraphQL server.
For further reference, refer to Honeycomb’s kubernetes integration docs