Building a GenAI-powered SRE assistant with ClickHouse and Hasura
What is an SRE assistant?
Site Reliability Engineers (SREs) are entrusted with the critical task of minimizing downtime and disruptions, often requiring them to navigate through a deluge of data flowing in from all directions. However, the stress and pressure of these scenarios and the overwhelming influx of data and signals can hamper an SRE's effectiveness and result in a cascade of service interruptions.
Imagine a solution that could provide SREs with a dedicated assistant capable of seamlessly synthesizing all this information to provide useful insights about incidents and other events as they take place. For example, we could provide aggregated telemetry data to LLM and ask to provide root cause analysis (RCA) for an incident.
Enter the concept of an SRE assistant: a conversational bot supercharged by Large Language Models (LLMs) designed to effectively manage the wide variety of inputs and challenges encountered in this high-stakes environment.
While LLMs excel at comprehending and engaging in natural language, they do encounter limitations when confronted with novel problems.
To leverage LLMs and build an SRE assistant, we must augment the business context (of being an SRE) to LLMs by prompt engineering.
What is ClickHouse?
ClickHouse is a fast, open source, column-oriented database management system that’s designed for real-time analytics using SQL queries.
Storing huge volumes of telemetry data and retrieving relevant context becomes possible through ClickHouse, which can crunch millions of records in a fraction of a second because of its distributed processing capabilities. The ability to retrieve data quickly from huge volumes of data at inference time, makes Clickhouse an ideal data store for GenAI applications.
What is Hasura?
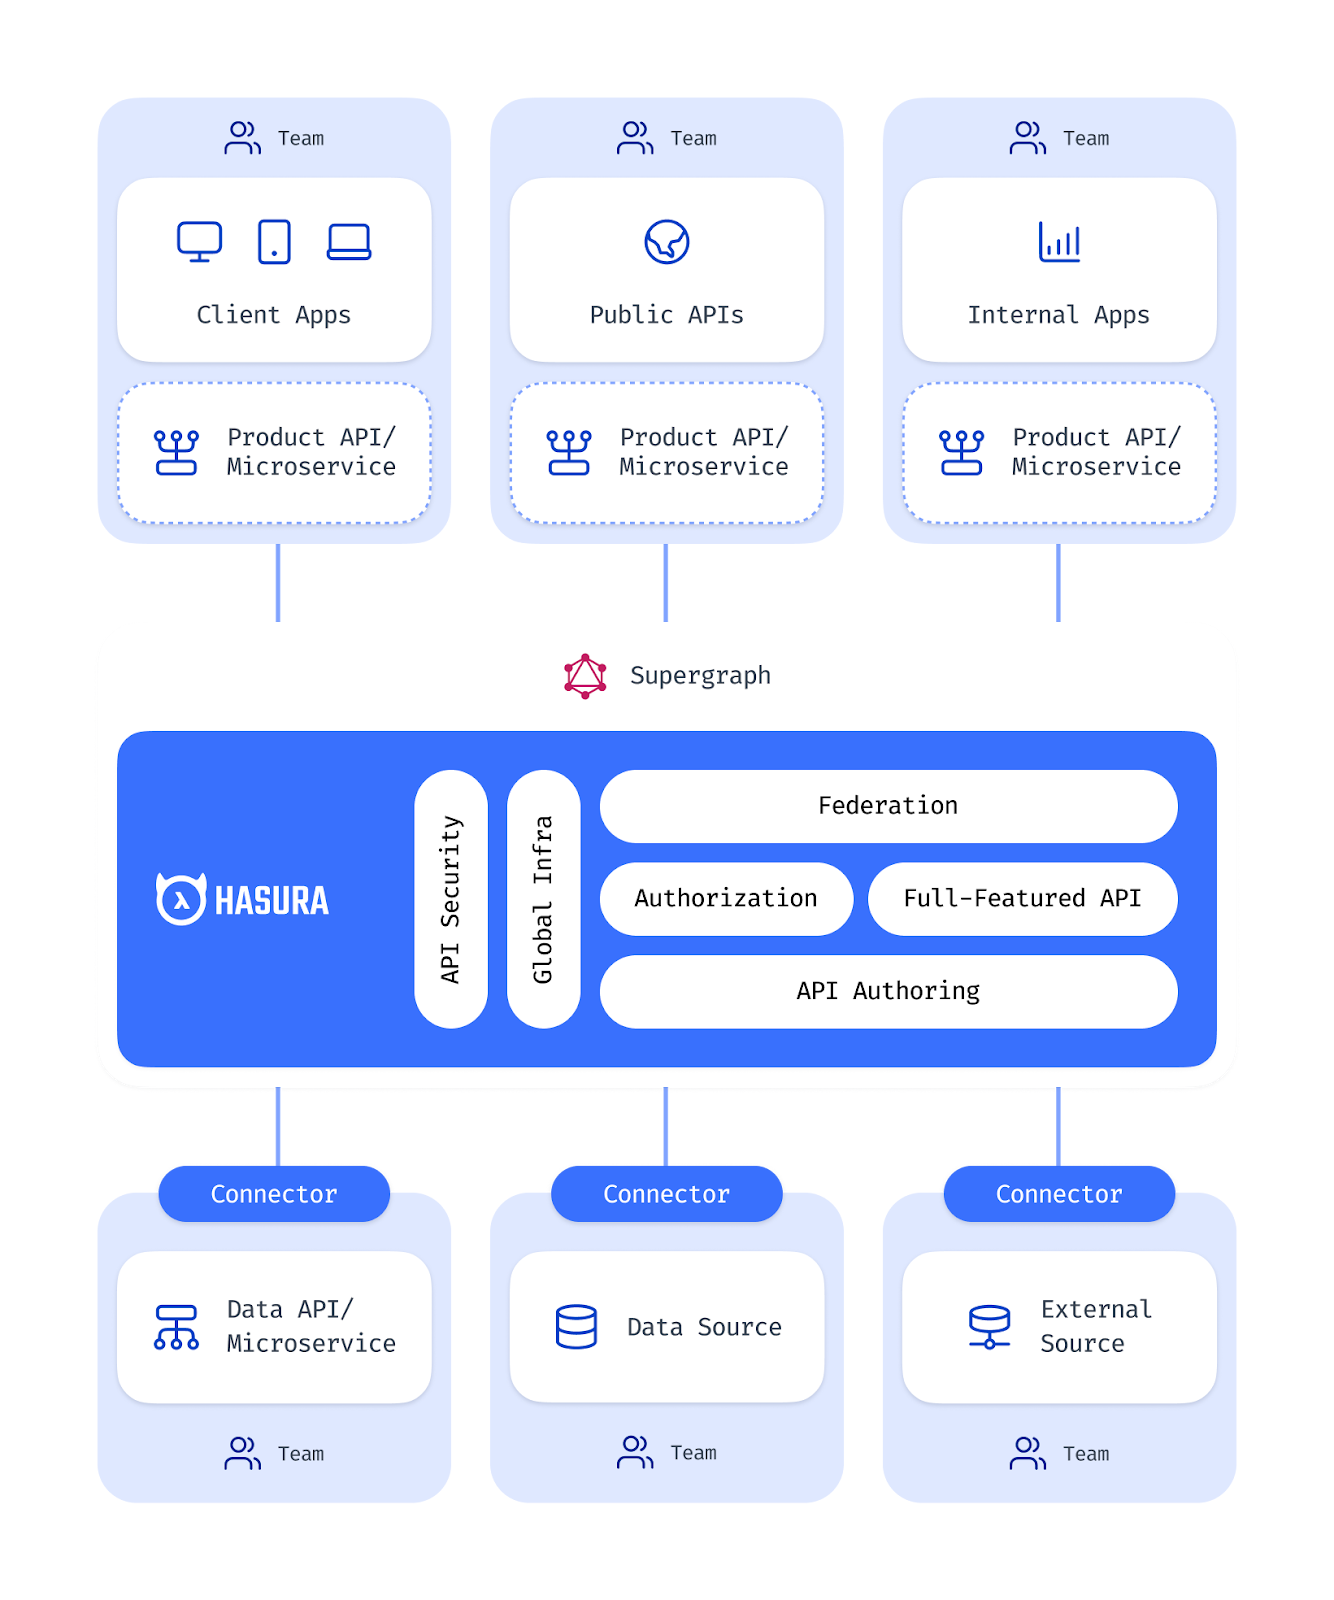
Hasura is a platform to build secure production-grade data APIs in no time with role-based access control (RBAC). You can use native connectors or create your own custom connector.
Hasura enables you to prototype rapidly with a Notebook. You can get started quickly and incrementally add value.
Data and consumers
Within this environment, distinct teams need access to specific data as dictated by their permissions, aligning with the granular nature of modern data management.
Further, the origin of the data, whether from mobile or web platforms, holds significance in determining the permissions governing its access, adding an additional layer of context to the process.
Data layer challenges
To build highly performant microservices, we need to develop high-concurrency, low-latency data APIs with security and RBAC. Building data APIs is time-consuming and not the best use of a developer’s time in the fast-paced GenAI environment.
Why Hasura + ClickHouse?
Hasura's enterprise-ready API management and RBAC features simplify the adoption of new databases such as ClickHouse. Users can enjoy ClickHouse's ability to perform analytical queries over billions of rows in milliseconds, without needing a deep understanding of the data structure and schema.
Conversely, ClickHouse users can exploit Hasura's ability to provide a data agnostic query layer in front of ClickHouse – simplifying the adoption and allowing rapid prototyping through automatically generated JSON APIs.
To demonstrate this value, we build an example application below.
Tutorial: SRE assistant
Consider a scenario where we are operating a web application, receiving an average traffic of around 100 requests per minute. To effectively manage this load, our infrastructure consists of 10 servers, each assigned a portion of the incoming requests through a round-robin distribution.
However, there are instances when hardware issues come into play, leading to a delay in the request execution and subsequently causing increased latency.
Our system is configured to monitor latency closely, and any sudden surge beyond the hypothetical threshold of 20 milliseconds triggers an automatic incident creation mechanism. This proactive approach ensures that performance anomalies are promptly addressed, maintaining a seamless user experience even during periods of heightened demand.
In response to the volume of potential incidents that could arise, we want to develop an SRE assistant with the primary goal of swiftly uncovering valuable insights and helping to restore service. These insights are derived through the utilization of an LLM, which is thoughtfully equipped with pertinent incident context via a prompt.
By feeding the assistant this contextual information, we enable it to effectively generate meaningful insights in a timely manner.
We will execute the following steps to build an SRE assistant:
ClickHouse account creation
Generate synthetic data and load it into ClickHouse
Connect ClickHouse to Hasura
Build a secure data API with Hasura
Build an SRE assistant using LangChain via Hasura Notebook
Prerequisites
1. Hasura CLI If this is your first time using Hasura CLI, you will need to install it. Follow the installation instructions in this document.
2. Hasura Notebook Follow the steps in the document to initiate your Hasura Notebook.
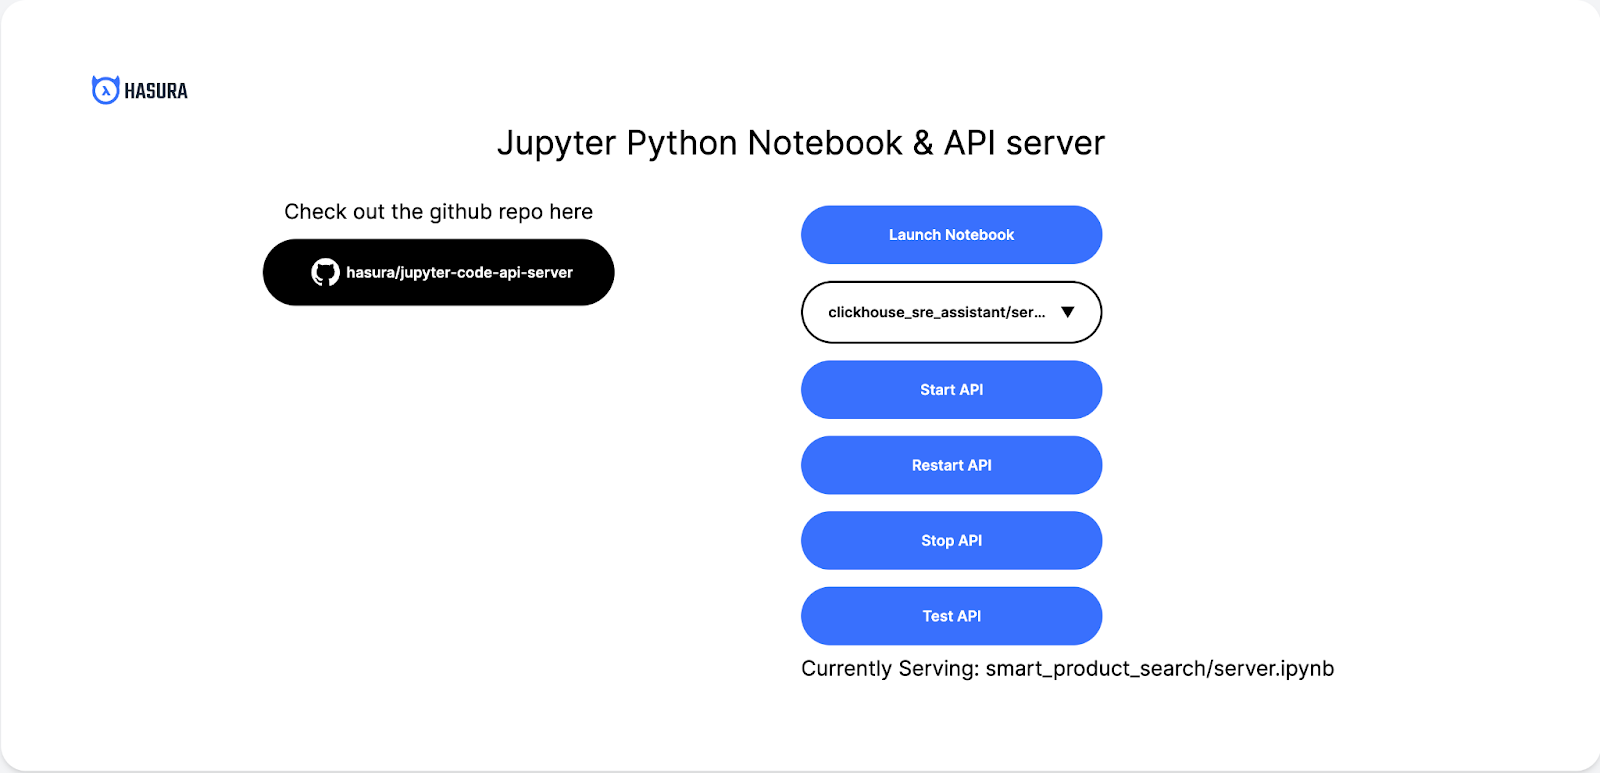
You will know you are ready when you are able to access the Hasura Notebook with a landing page that looks like this on your Hasura Notebook URL. Let’s get building! 🚀
Getting started with ClickHouse
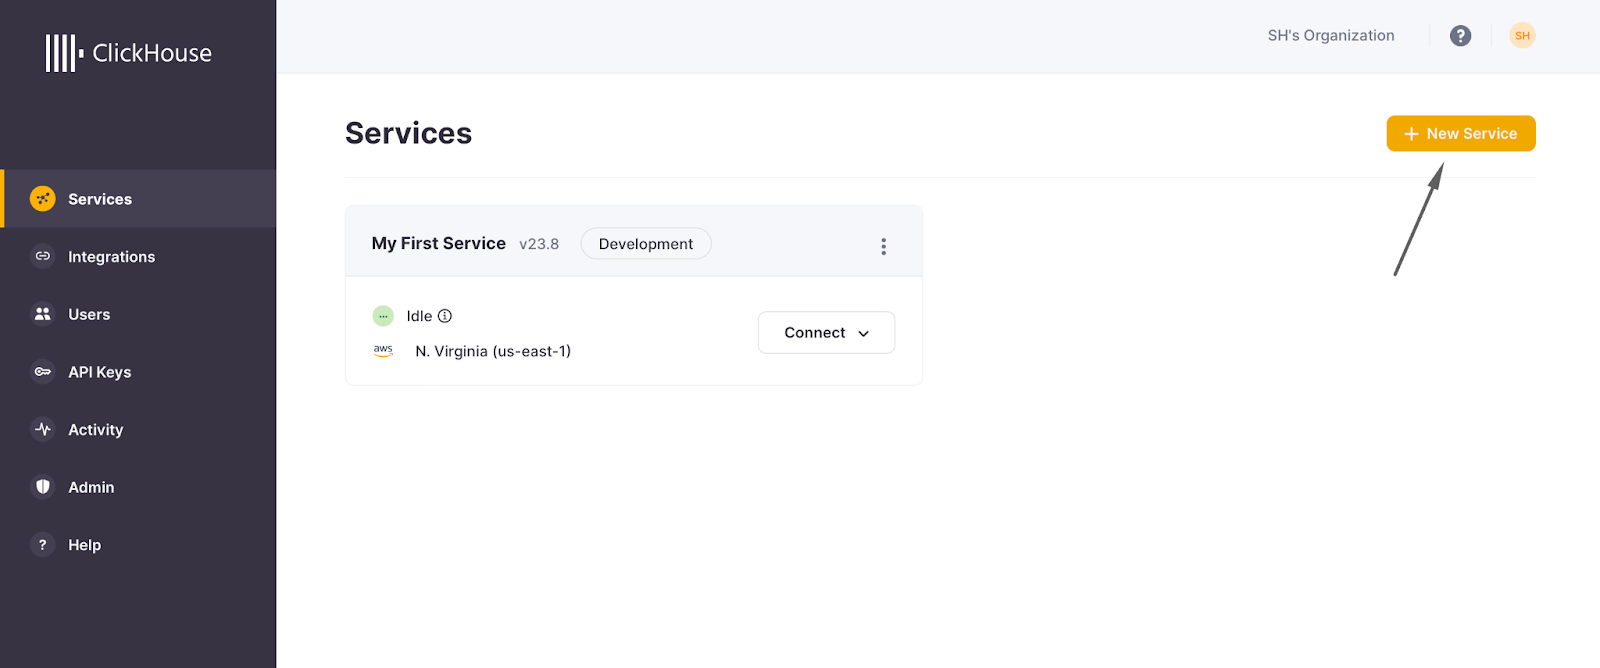
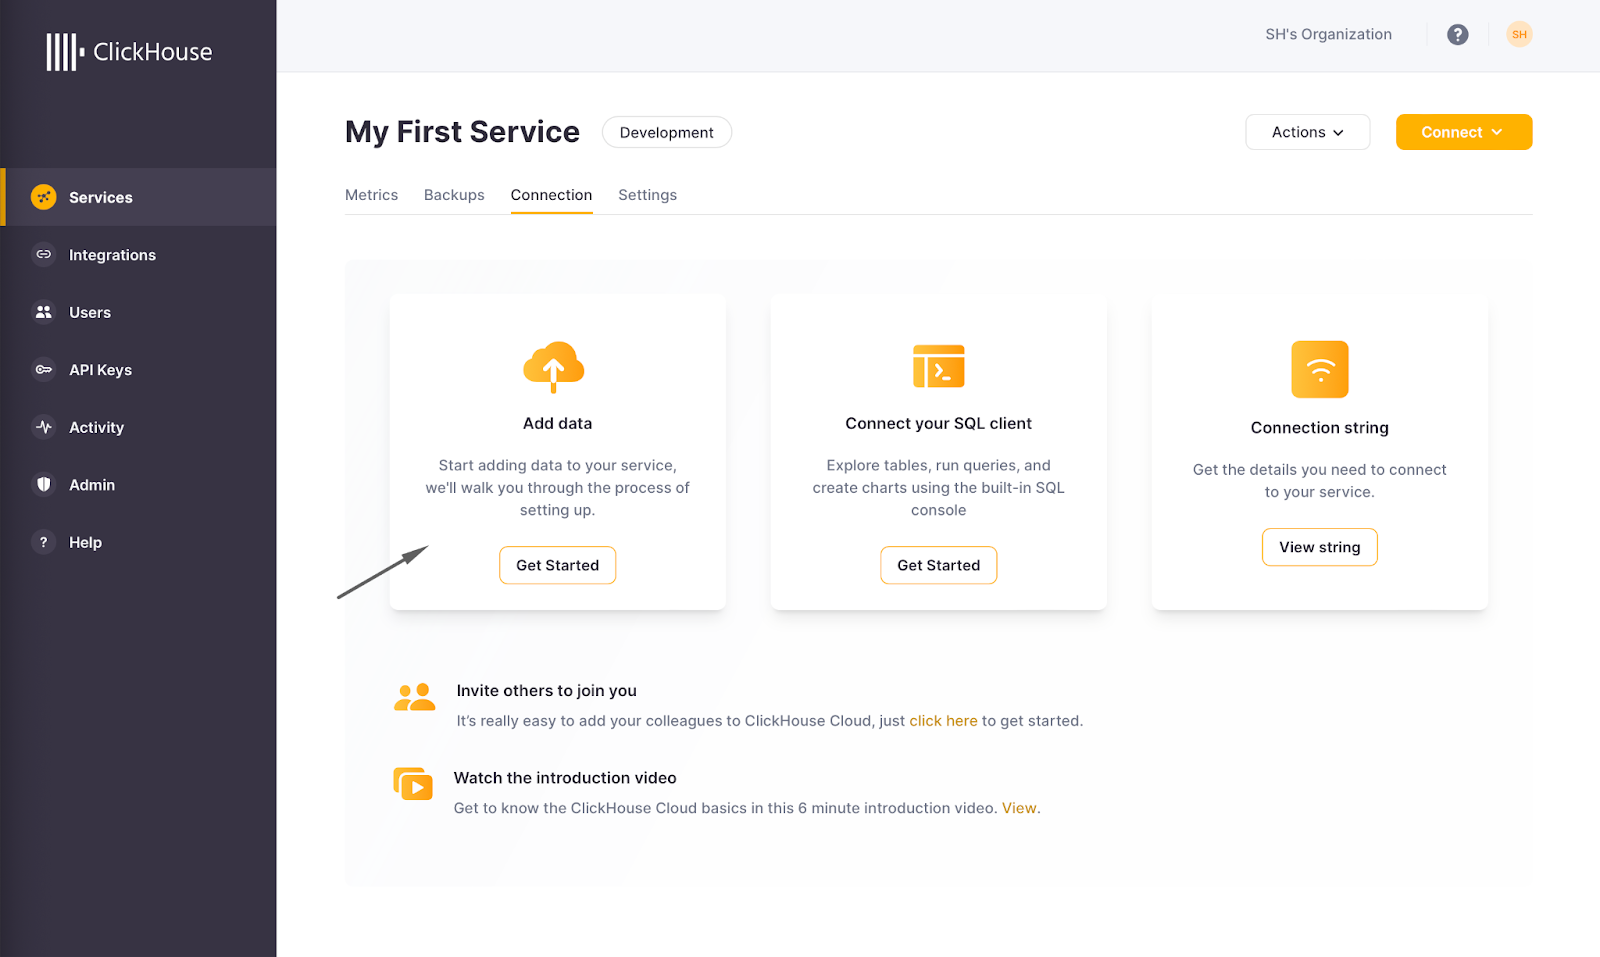
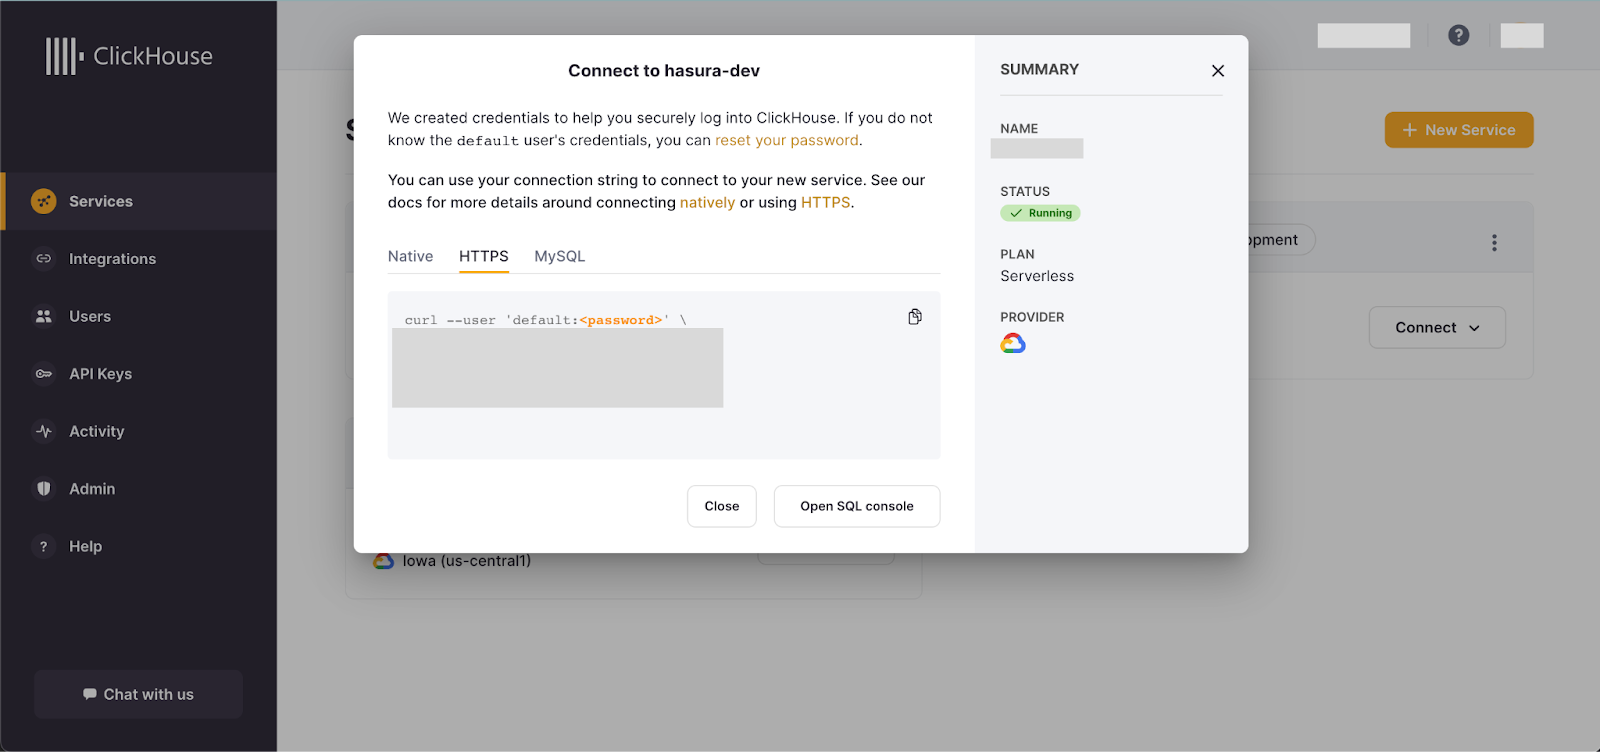
Create a ClickHouse account if you don’t already have one. Login into the console and start a new service.
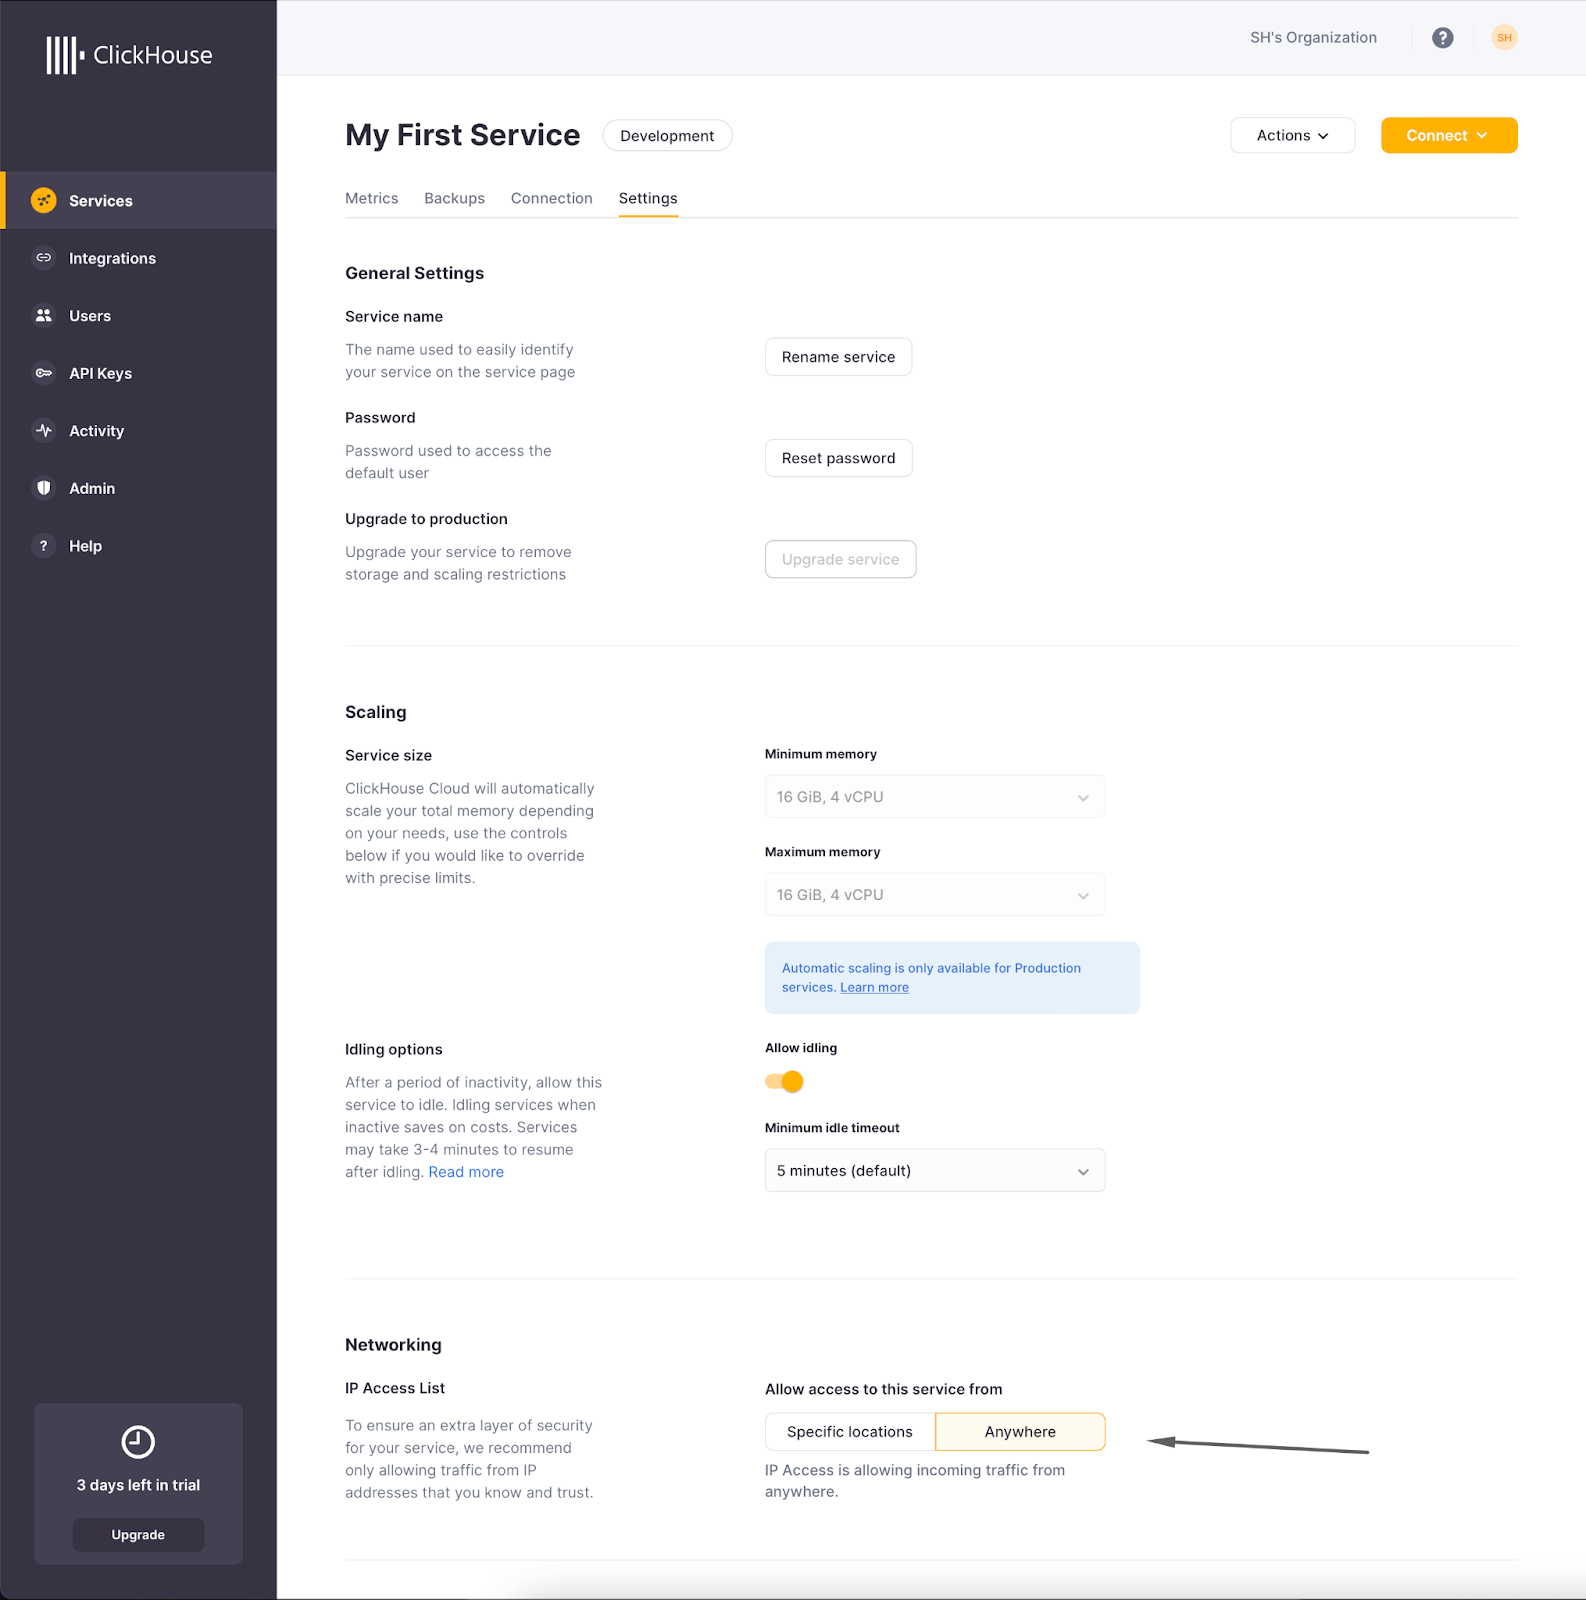
During service creation you will be prompted to specify from where to allow connections. For this demo application, and to simplify getting started, ensure you select “Anywhere.”
Generate synthetic data and load it into the ClickHouse DB
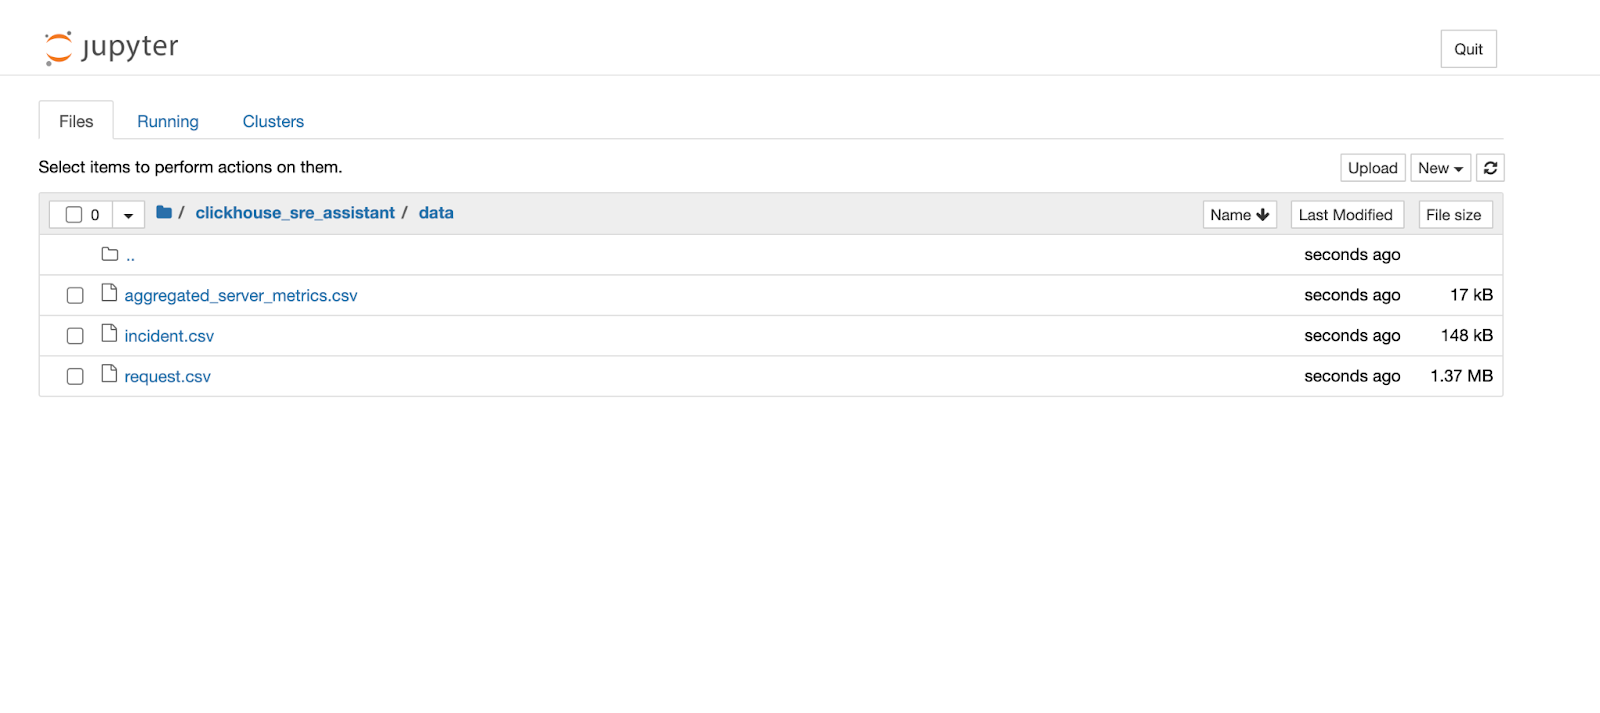
Launch notebook.
Open clickhouse_sre/synthetic_data.ipynb. Execute all the cells to generate the synthetic data. You’ll find a data folder generated, if not already available, under the current location with three files.
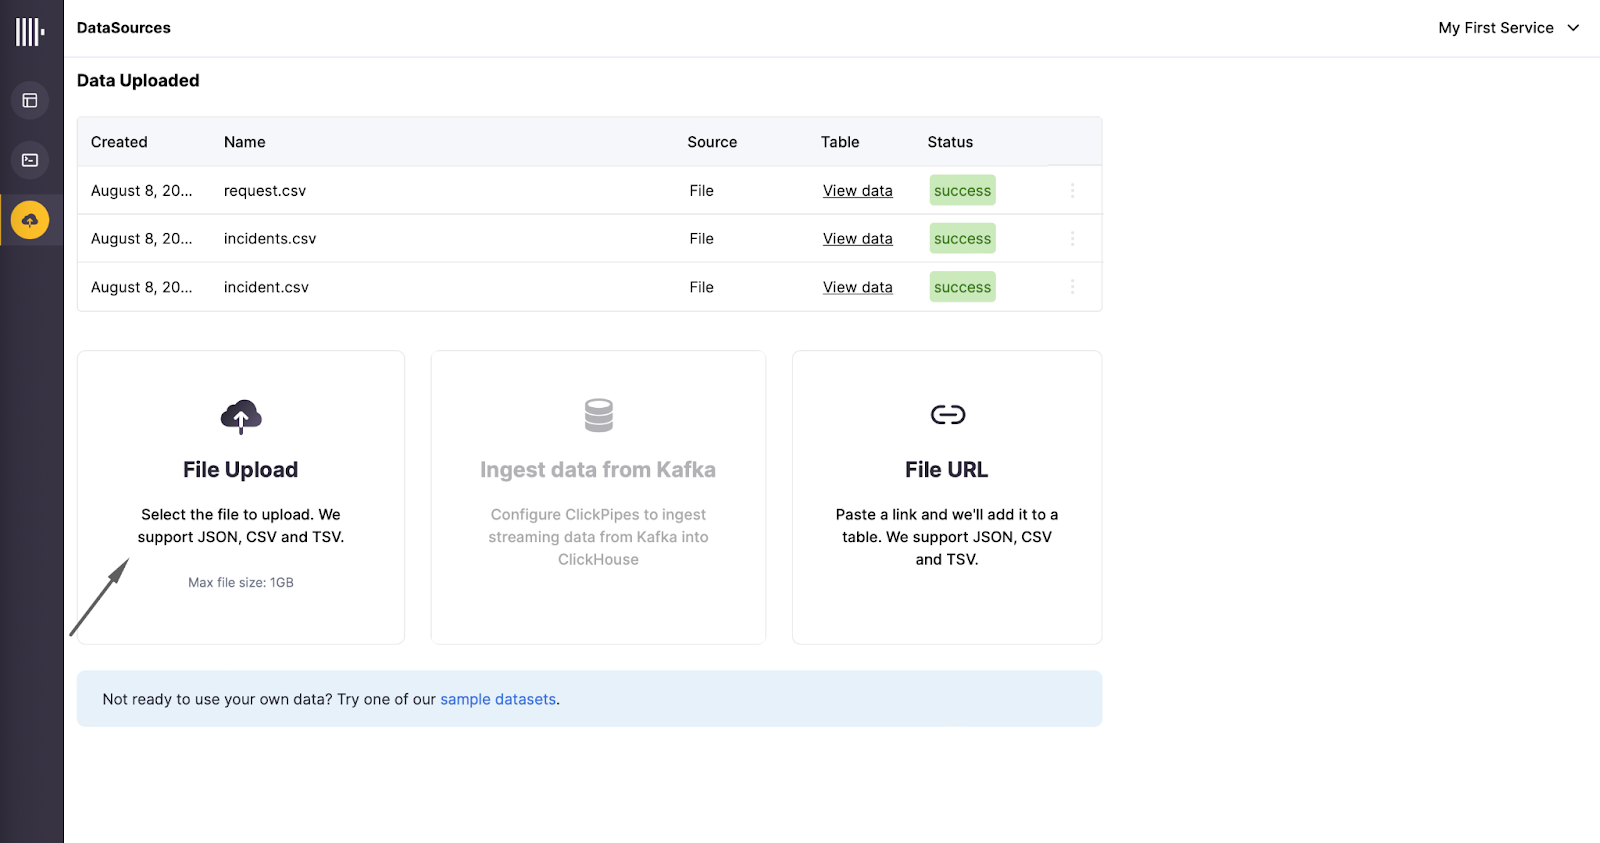
We can upload these files to ClickHouse using the file upload feature.
Review all details. The types of data will be automatically detected and a schema proposed. Please don’t forget to define Sort key for efficient querying. request.csv Sort key: request_id
incident.csv Sort key: incident_id
aggregated_server_metrics.csv Sort key: server_id
Tables are now ready in ClickHouse with synthetic data.
Getting started with Hasura
To get started, head over to cloud.hasura.io. Create a project and then click Launch Console.
Connect ClickHouse DB to Hasura
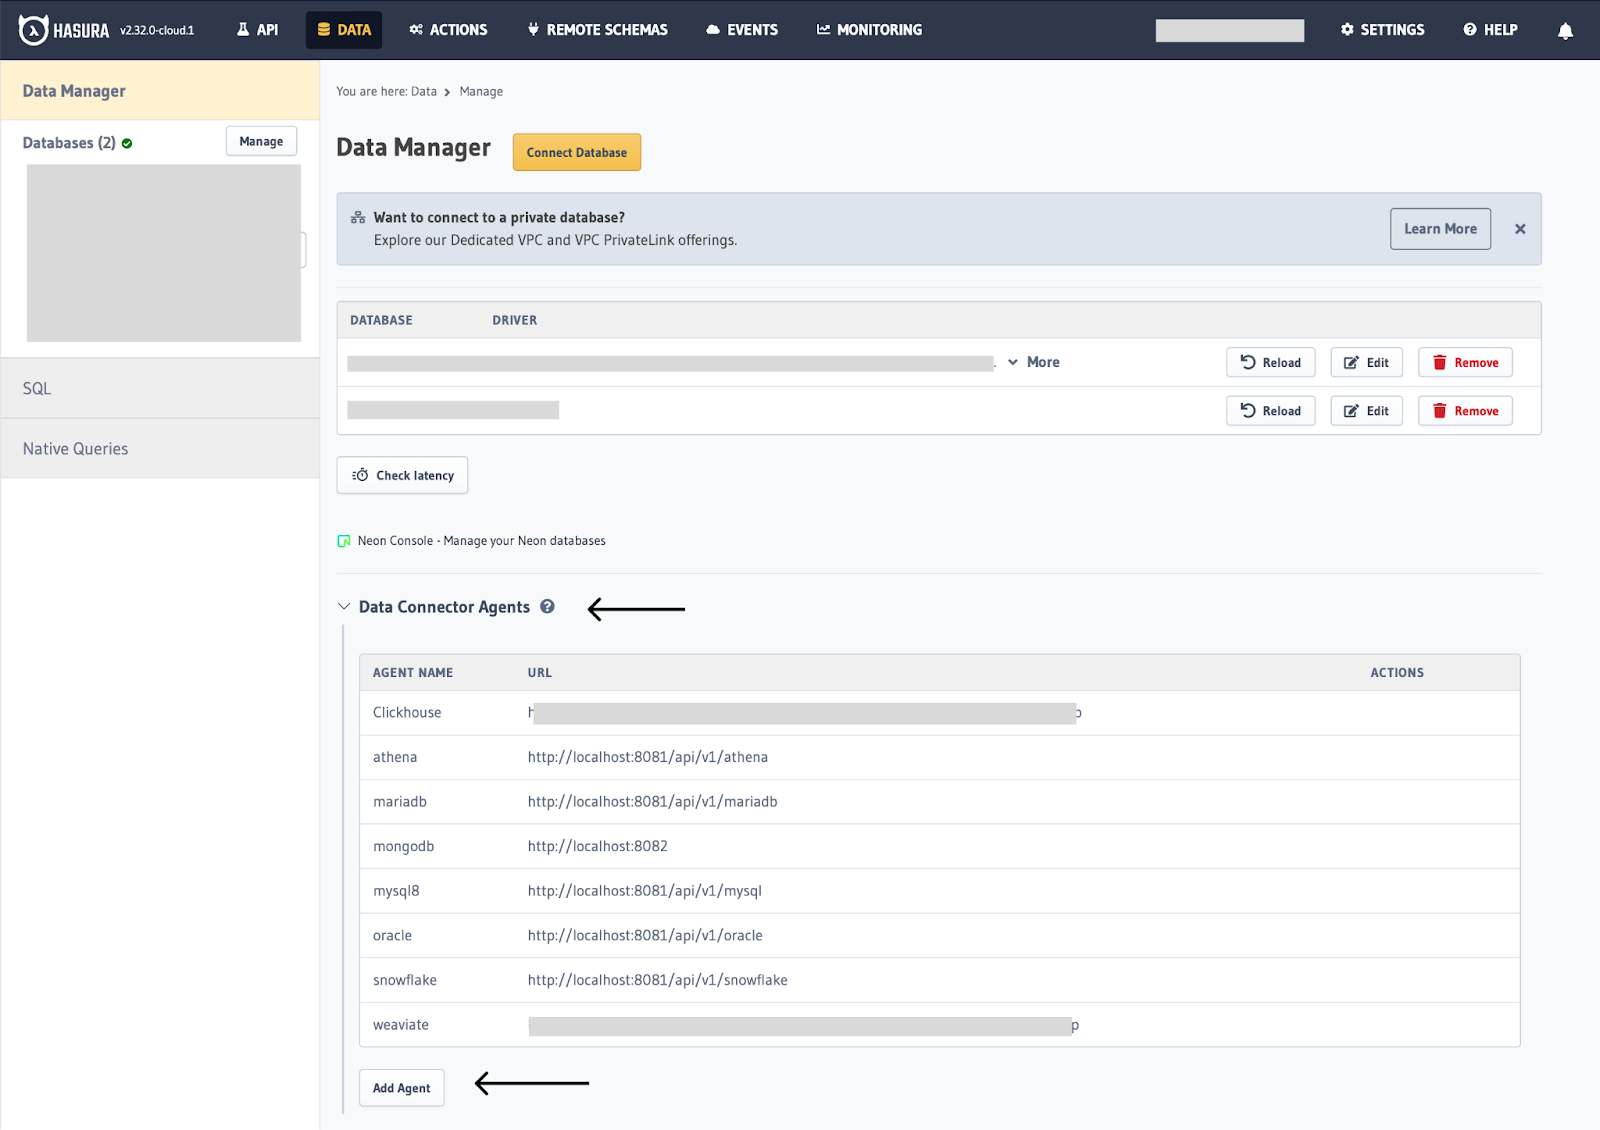
Next, go to the Data tab to connect ClickHouse with Hasura.
Click on Data Connector Agents and then click Add Agent.
You are presented with a form that requires you to add your connector endpoint.
Follow the below commands to deploy the ClickHouse connector and fetch the endpoint.
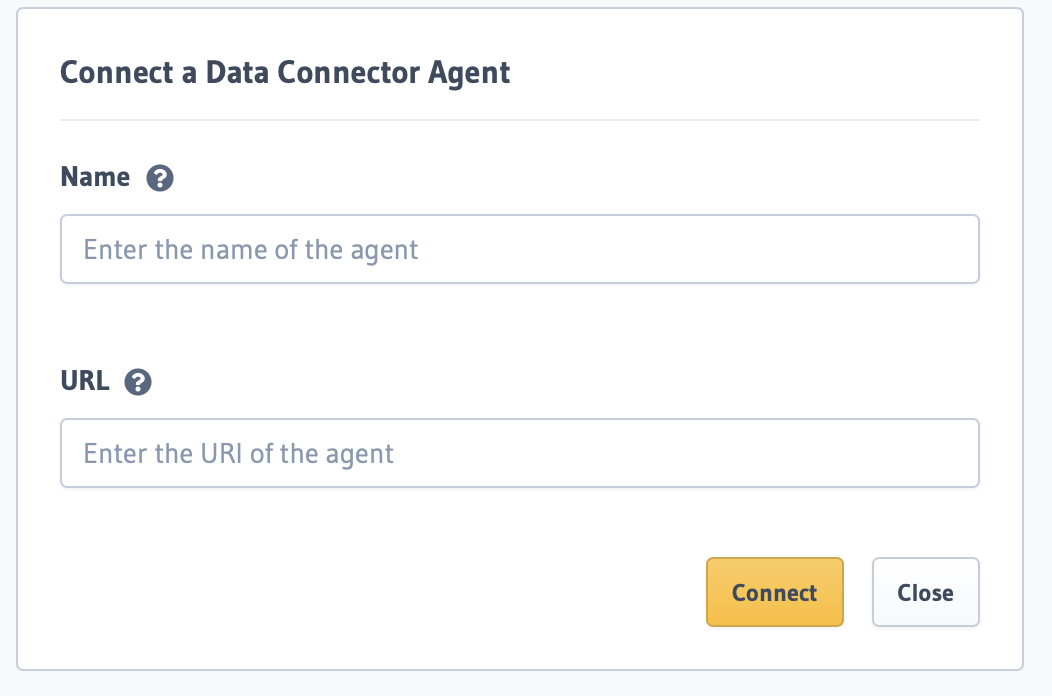
Once you have the ClickHouse connector deployed you can fill and submit the form to Connect a Data Connector Agent.
Name - name to identify the connector URL - endpoint of your deployed connector.
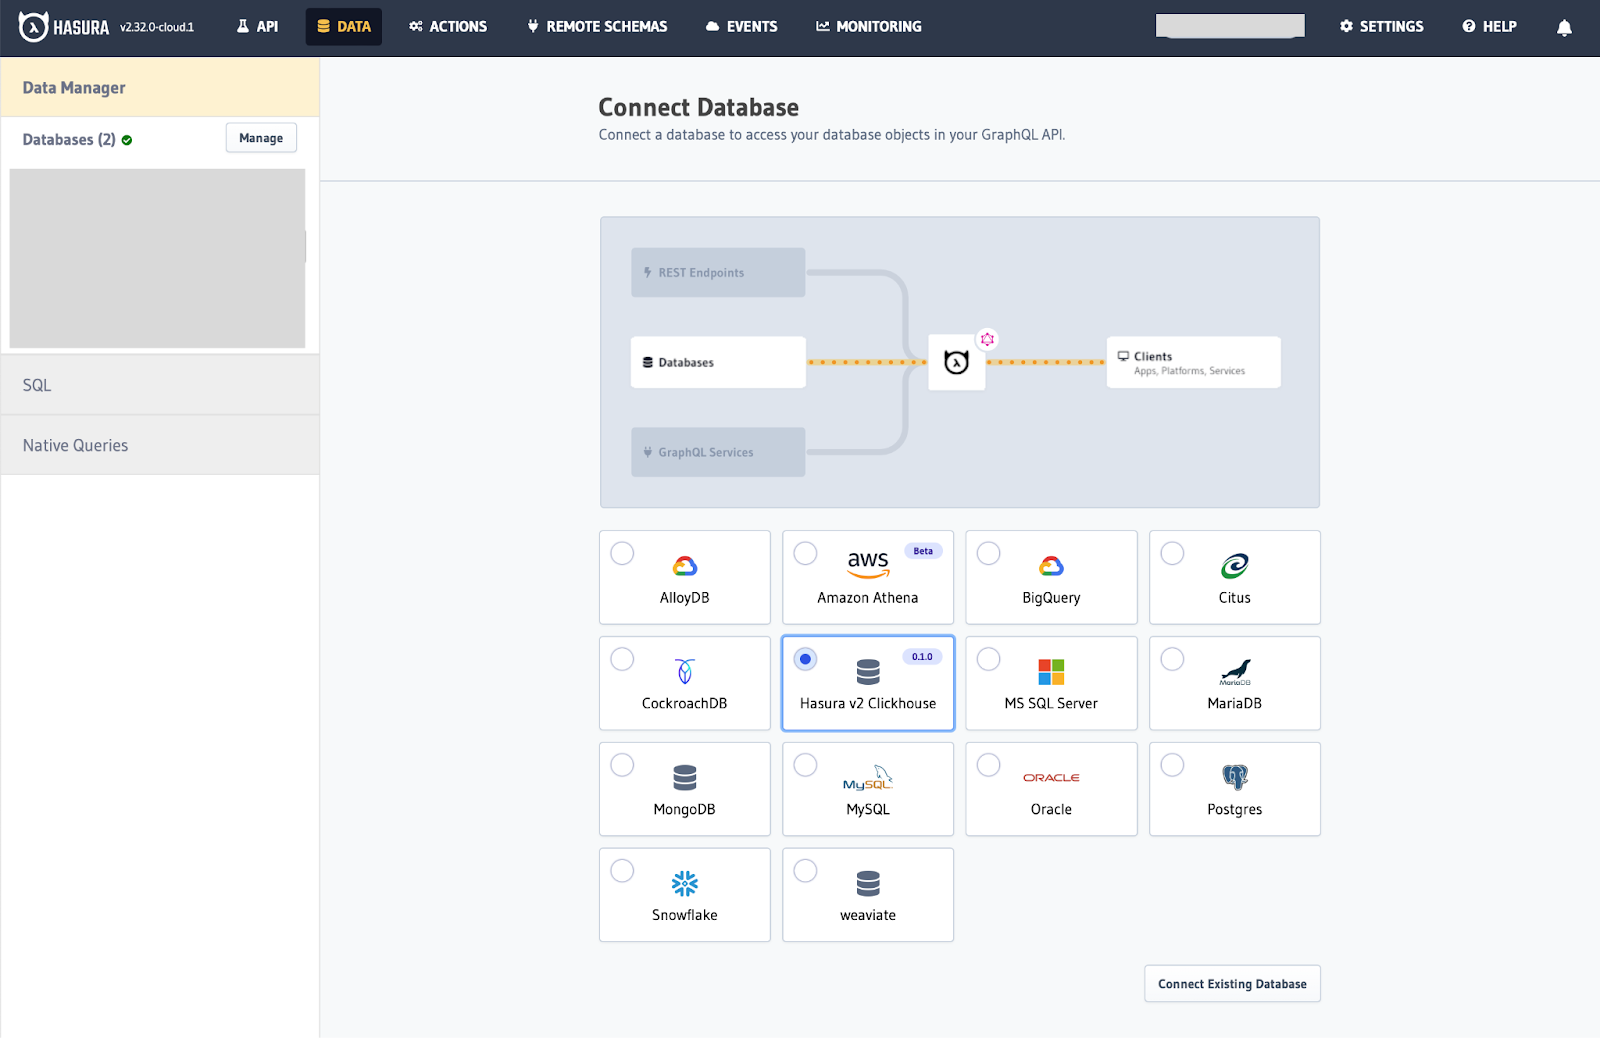
Now, click Connect Database at the top of the page and select ClickHouse to connect the existing database.
Add the connection details with the database name as SRE. You can fetch the connection details from the ClickHouse console.
Now you can find the SRE ClickHouse database and track all the tables on Hasura Console.
Great, now we have the database connected to ClickHouse.
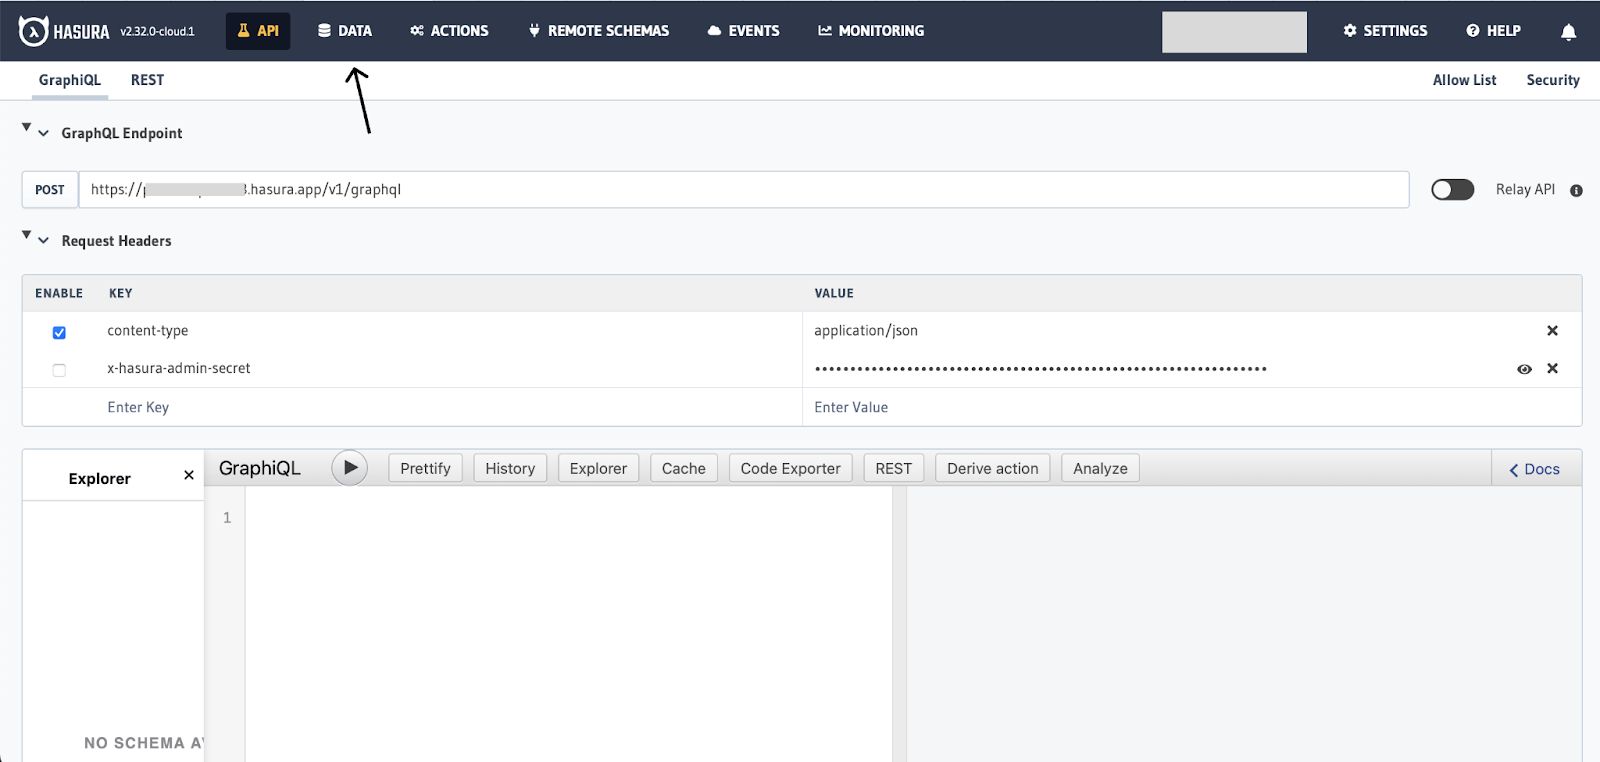
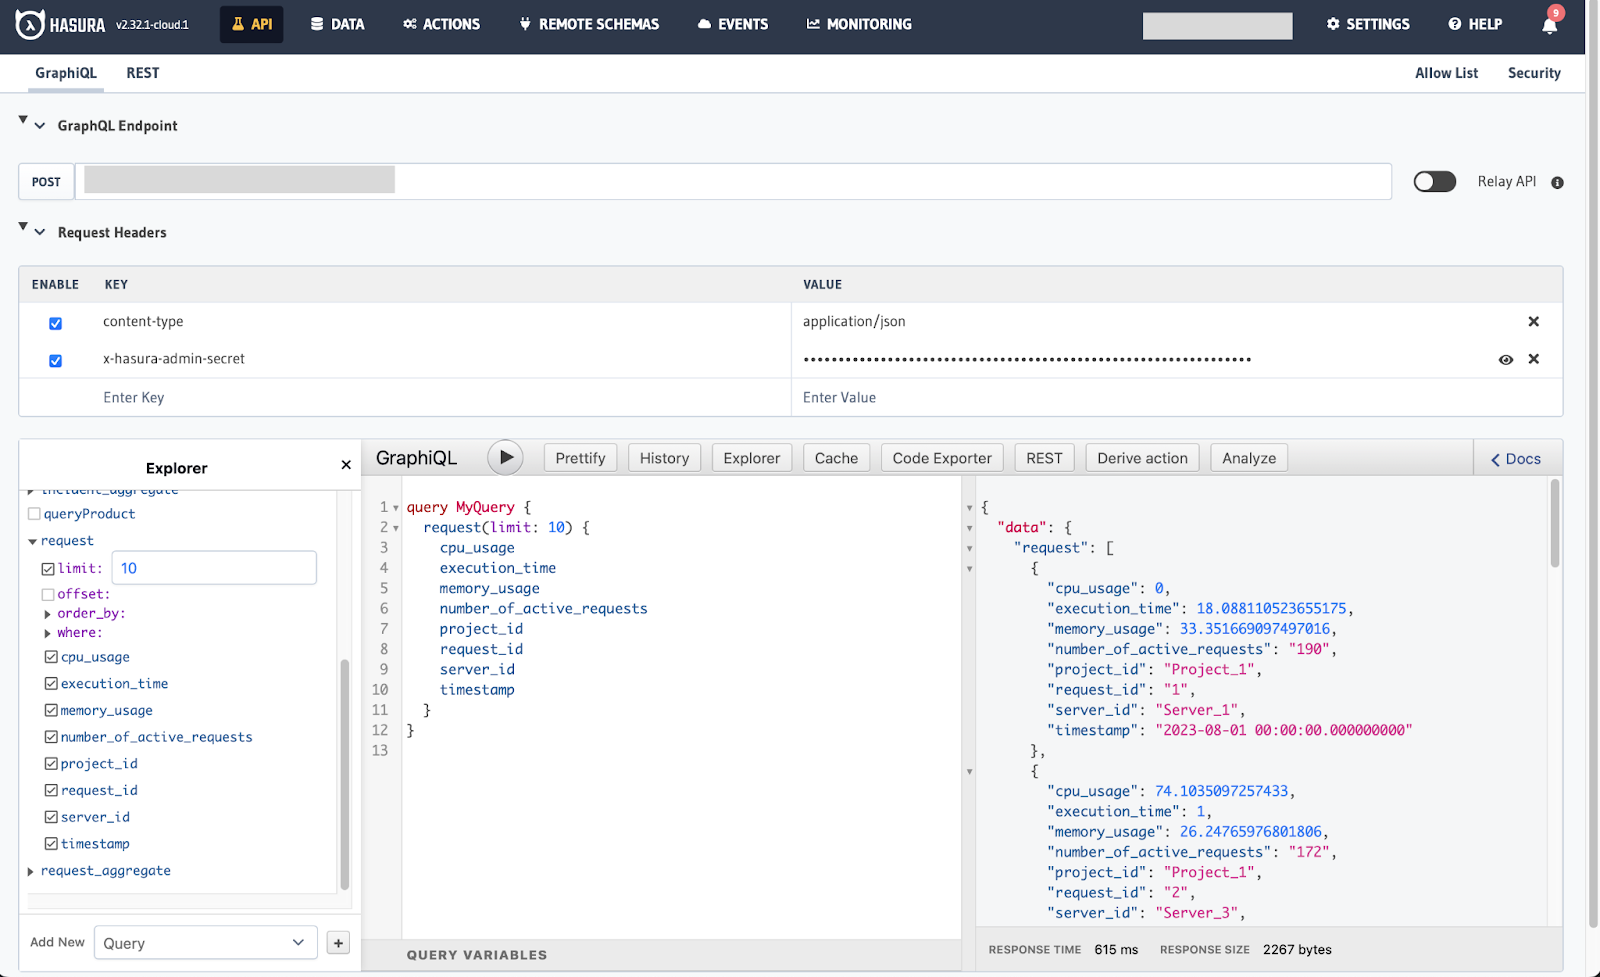
Congratulations! 🎉You are through the first part of setting up the systems. Let’s verify by heading to the API tab and executing a query to fetch records from any of the three tables.
We can see that the data is now accessible through the Hasura console.
Note how we’ve integrated ClickHouse into our data stack without writing a single line of SQL!
Setting role-based access control
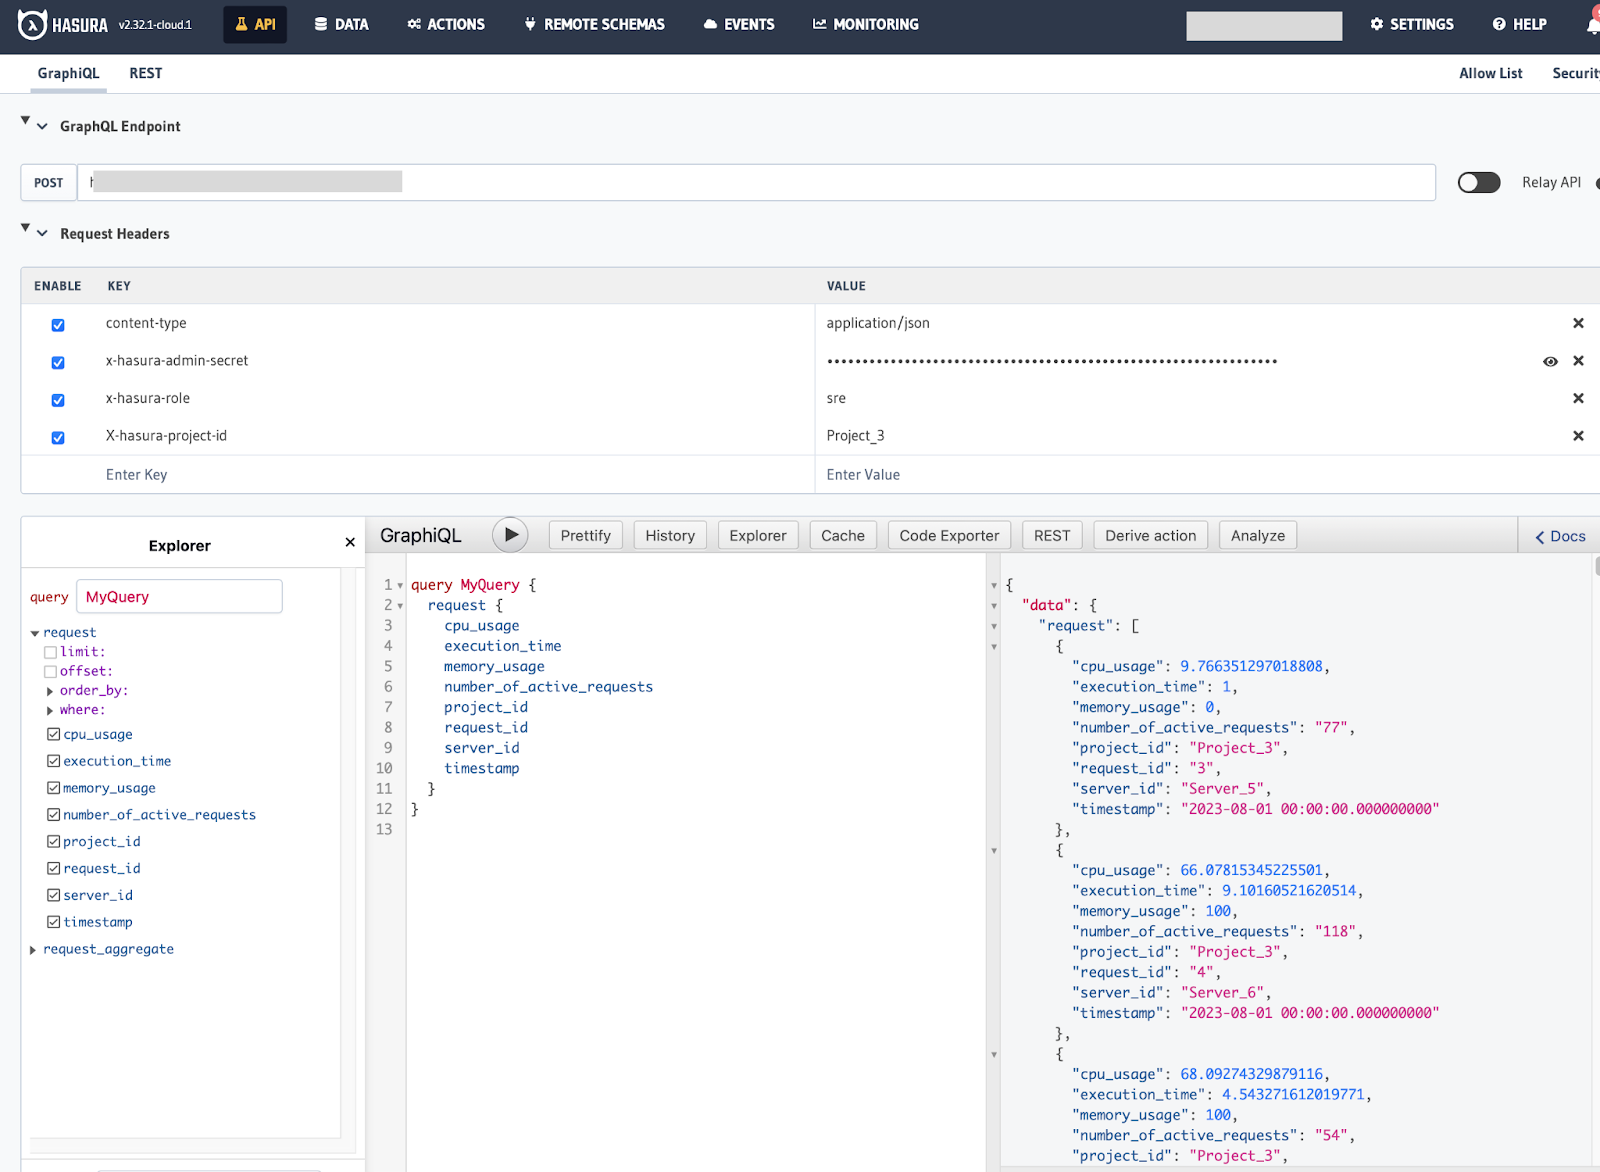
Setting up granular permissions through Hasura is easy. Head to the Data tab, click on the SRE database, and then the request table.
Click on the Permissions tab, define a new role called sre, and provide select permissions. This is helpful if you have restricted content and you want SRE to access only projects that he/she is authorized to. You can do so by accepting a header called X-Hasura-Project-Id and setting up a custom check.
The custom check will return only records where the project-id matches X-Hasura-Project-Id.
Don’t forget to select all columns to return.
Let us test it out by heading to the API tab again and, this time, adding two new header fields. x-hasura-role = sre X-hasura-project-id = Project_3 (can be anything of your choice 😉)
Voila! 🎉
We get only records for Project_3. You can define complex checks, too.
Context retrieval for LLM augmentation
LLM trained on a public dataset wouldn’t understand your real-time business data. So, we will need to fetch relevant context to pass along with our instruction prompt to the LLM.
When an SRE requests to analyze a particular incident, we fetch two context datasets to pass to the LLM:
Incident details and associated request details
General aggregated server metrics
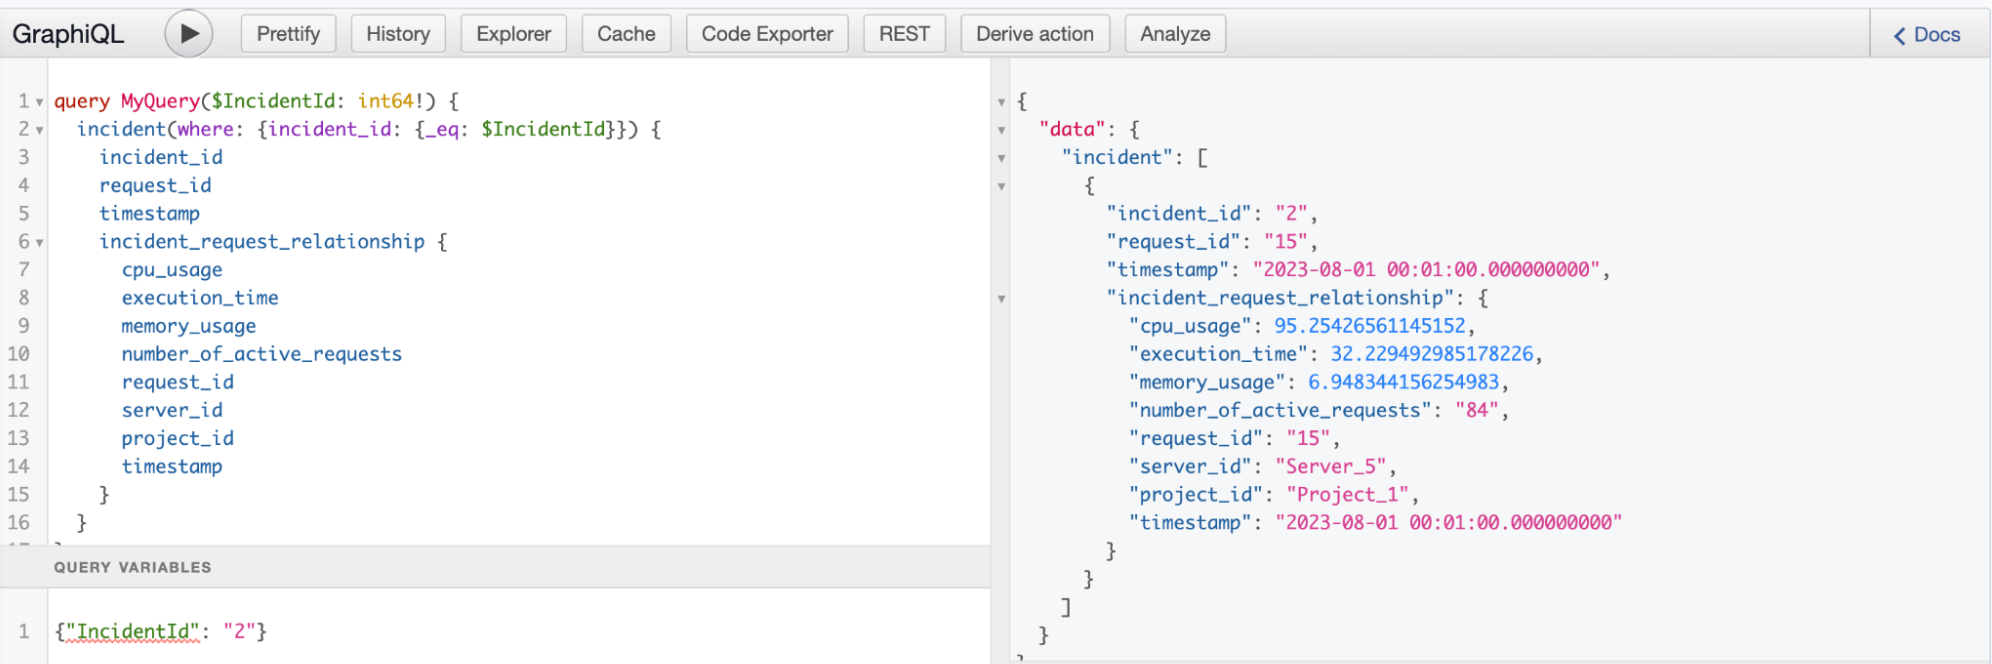
Let us define a relationship between the incident and request tables to fetch our first context.
On the data tab, select the incident table and then choose the Relationships tab. From here, we'll create a new relationship by clicking on Add Relationship. We'll name this incident_request_relationship and choose to reference the SRE / request table.
Our relationship should be of type Object and map from the request_id column in our incident table to the request_id column in the request table. Then, click Create Relationship.
We test it out on the API tab.
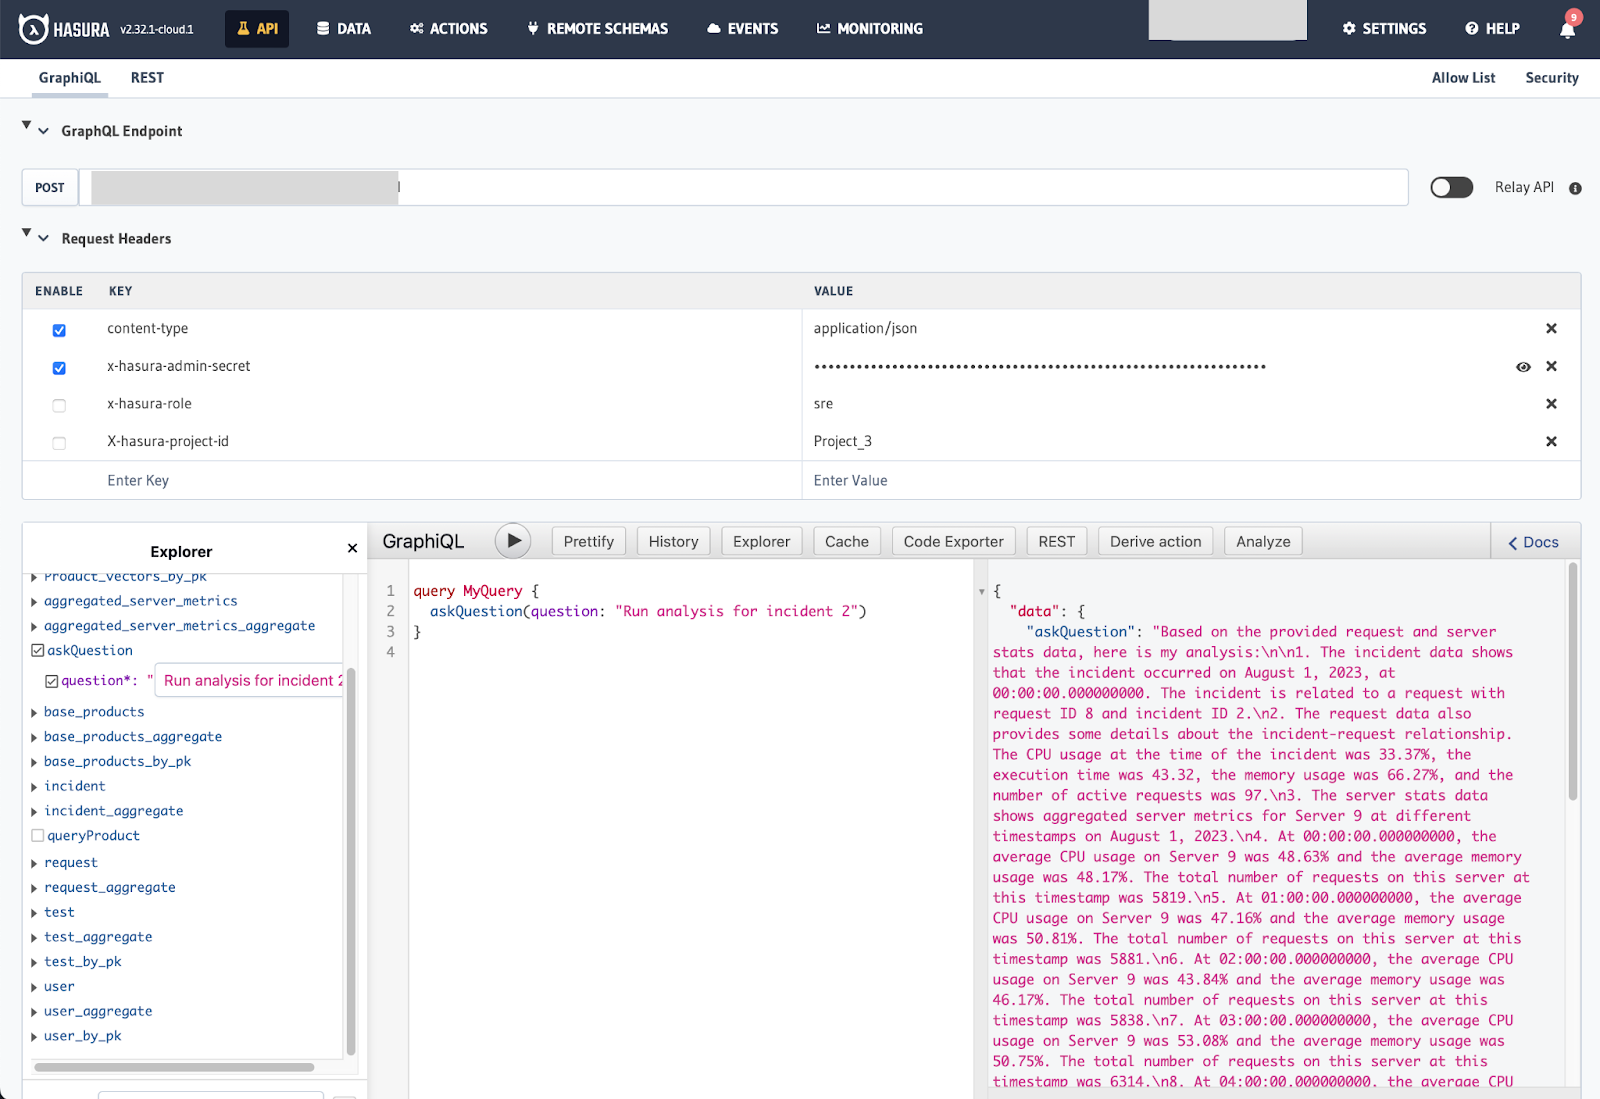
Query to fetch request information along with the incident.
Let us create a Hasura Action using an endpoint hosted from our Hasura Notebook.
You can find the code under clickhouse_sre/sre_assistant.ipynb.
Let us uncover the magic.
We use OpenAI chatmodel API ChatCompletion.
First, we use the chat model and OpenAI’s function calling capability to extract intent and entity. Intent in this case is checking if the user is asking for analysis on the incident and the entity is incident id.
Finally, we setup the prompt to provide the instructions and context to LLM.
Python
"""
You are provided with request and server stats data for the incident.
Can you run RCA and identify the root cause of the incident?
Request data:
{request_data}
Server stats data:
{server_stats}
Analyze the data step by step and list down your analysis in bullet.
Share next steps to resolve the incident.
"""
And finally, the cell is commented as POST, which converts the whole cell into a POST request handler at /sre_query
Python
# POST /sre_query

...
On the Hasura Notebook home page, select clickhouse_sre_assistant/server.ipynb and press Start API to start serving the endpoints and Restart API if you would like to reload existing server settings.
Create Hasura Action with Chatbot API
Head to the Hasura console and click the Actions tab. Click Create to setup a new Hasura Action.
Your webhook URL is your notebook URL (ends with .app) + invoke/sre_query.
You can also fetch your webhook URL by running this CLI command again hasura notebook status.
Add the authorization header required to reach the endpoint from the Hasura Notebook.
Generate base64 encoded value. You will need to execute this on the terminal of your choice.
echo -n "<username>:<password>" | base64
You can fetch the username and password by executing the following command.
hasura notebook status
Key = Authorization
Value = Basic <base64 encoded value here>
You will also need to increase the Action’s timeout as LLM responses can be slow.
Set a large timeout; 1000 seconds (16 minutes) is a reasonably safe value. You can always update the timeout to a more reasonable value based on your system SLAs.
That’s a wrap!
Through harnessing Hasura’s role-based access control via an instant GraphQL API, ClickHouse’s rapid data analytics, and the intelligent automation capabilities of LLMs, we’ve been able to create a helpful, knowledgeable, and low-cost SRE assistant.
As technology advances and complexities grow, tools like this will continue to help us solve problems and stay ahead of operational challenges. What are you looking forward to building? Let us know in the comments below. 🎉
Hope you enjoyed building an SRE assistant alongside me!