When you're trying to diagnose why a particular operation is taking a long time to complete, or just want to better understand what's going on "behind-the-scenes" in your queries, the ability to debug and analyze metrics from your Hasura instance is a critical factor.
In this post we'll take a look at how to do this by:
- Walking through the tools we have available
- Showcasing how to use these tools, with follow-along images and guided descriptions
- Discussing "gotchas" and useful tips as we go, so that you're better equipped to avoid pitfalls and common issues
Outline
There are two distinct areas to keep in mind when approaching performance issues.
The line that separates these areas is the network boundaries:
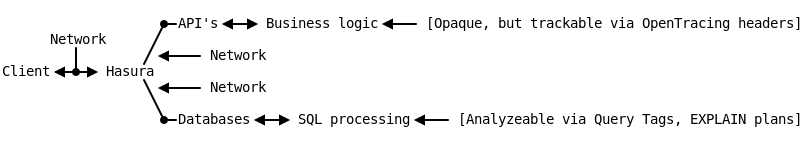
This diagram highlights the boundaries we'll be covering -- the ones separating the network from the application.
Network Boundary
Network timing information between a Client and Hasura is easily profiled and gathered.
Investigating this phase can be useful to rule out a problem with the actual network between the client and server.
One straightforward way of doing this is with the inbuilt browser devtools.
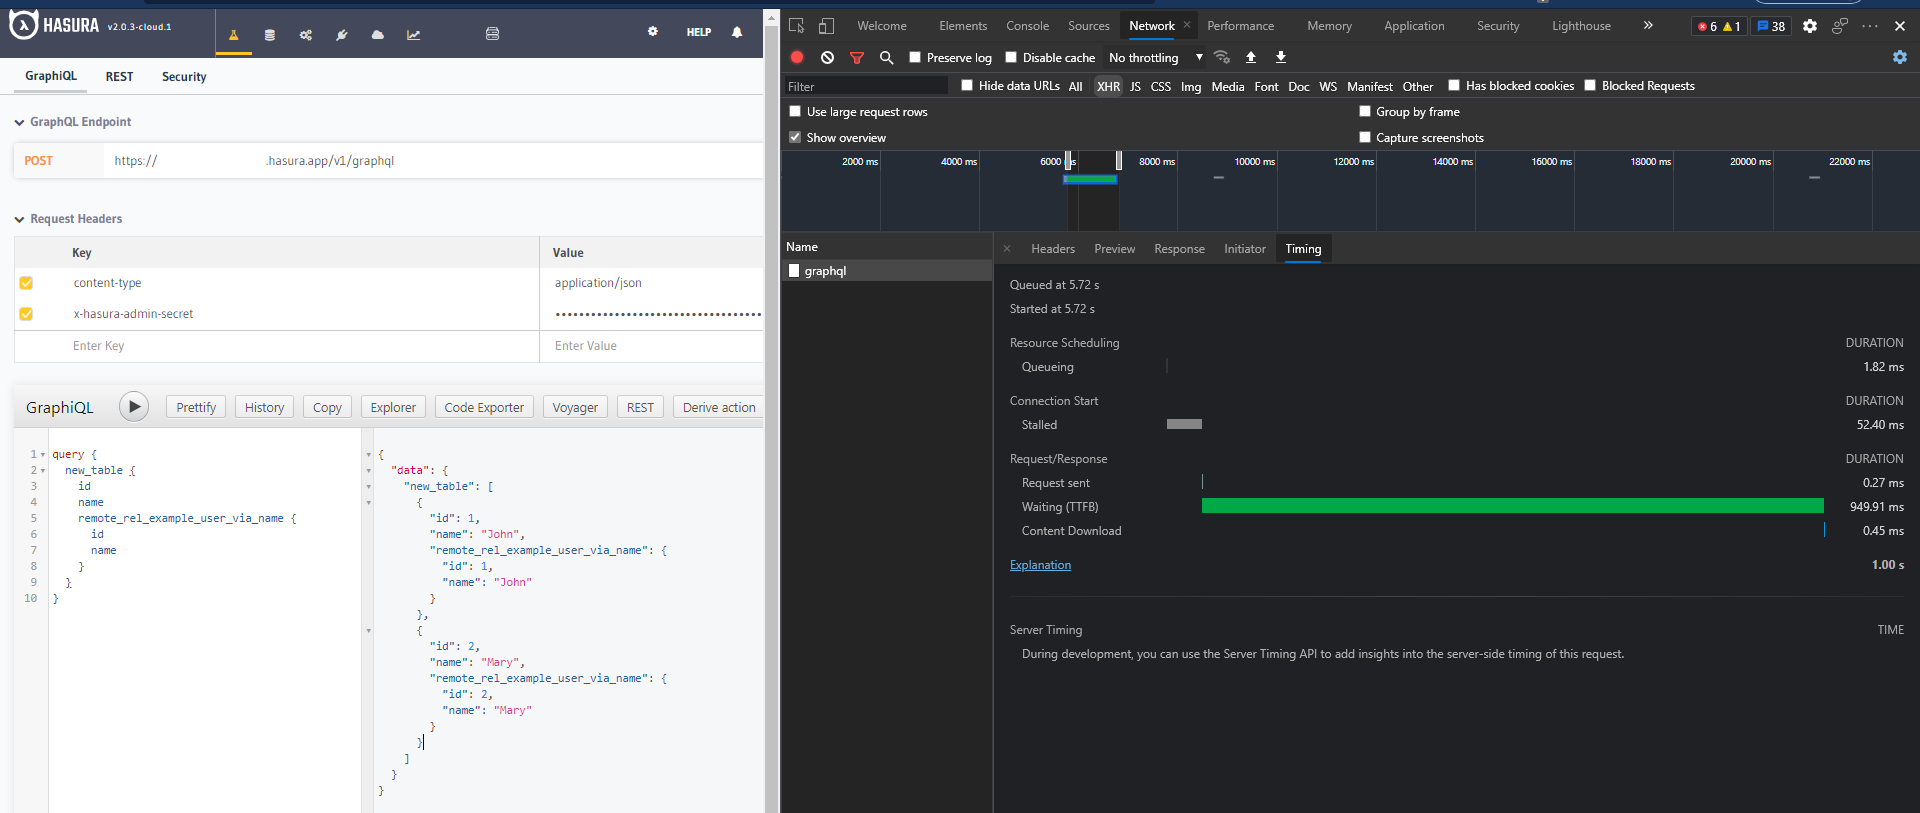
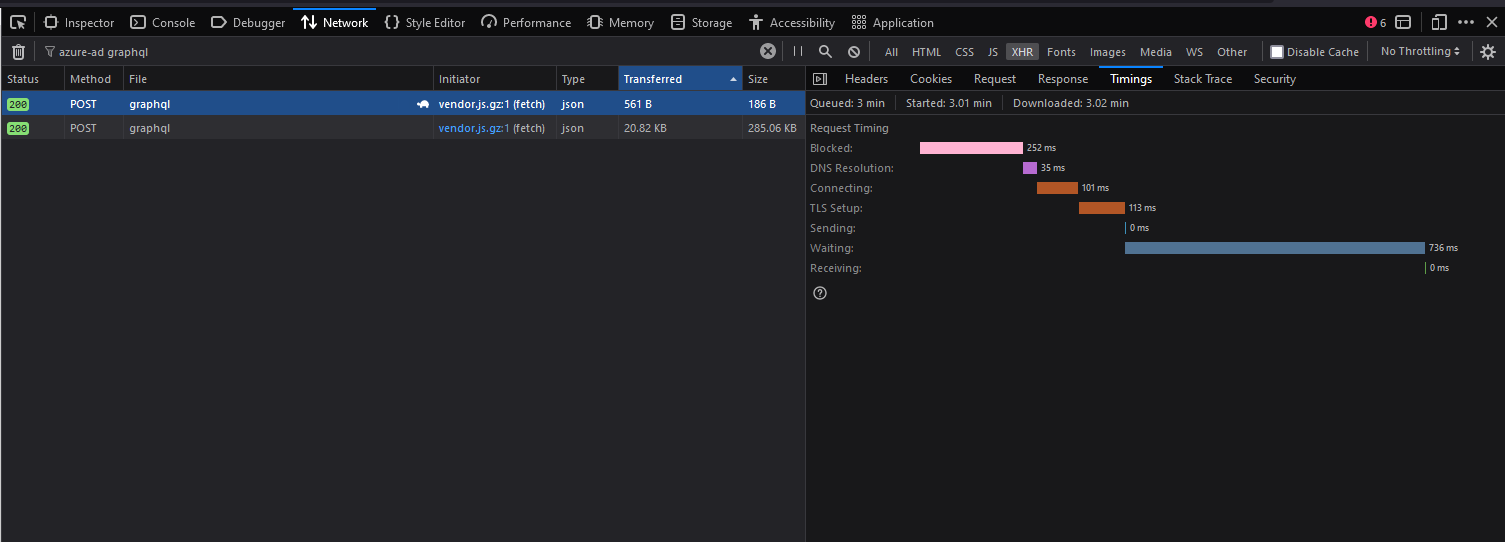
To understand what the request timeline looks like, you can emulate a query made from your client to Hasura by using fetch() or GraphiQL.
Using the Network pane, we can look at the timing information for each segment of the request.
What happens inside (or behind) Hasura is not visible to us here, but one fairly important piece of info is -- the time that the request isn't actively being processed:
From the above images (timing info for a query, taken once in Edge and once in Firefox) we can see that the time spent not connected and actively waiting for a response is relatively brief in comparison to the time spent waiting for first-byte.
Using this info, we can likely conclude that there aren't any network issues happening during these requests. If there were, the timing information would be skewed, with significant portions of it spent in the phases outside of waiting (the connections and handshake phases).
Application Boundary (Business Logic)
Though coverage of debugging and profiling techniques for what occurs in application business logic is somewhat outside of the scope this article, there is one critical piece of information that can be of use here.
Within the Hasura Cloud docs, there is a section relevant to Hasura's implementation of OpenTracing and how to configure this end-to-end for your application.
Under the Trace Propagation subsection, there is some info outlining how we utilize tracing information to display timings in metrics.
As noted, likely the easiest way to get this most out of this feature if you aren't trying to implement custom/advanced tracing functionality is simply to forward the request headers from Hasura:
If you are unsure how to implement B3 propagation in your own web service, the simplest thing to do is to read these headers and pass them along to any HTTP services you call which also support B3 propagation, including Hasura itself.
In particular, if an event trigger webhook or action handler propagates these B3 headers back to Hasura, we will be able to trace the entire interaction.
Application Boundary (Database)
When it comes to gaining insight about what's happening in the database layer, we have a few tools available to us.
- Hasura's
ANALYZE feature to display the compiled SQL query for an operation
- Running
EXPLAIN ANALYZE on the resulting query to get a Postgres plan for it
- Using visualizers like https://explain.dalibo.com to help graphically examine the plan
- The Cloud "Metrics" dashboard's
Operation modal, which provides timing spans for PG operations as part of it's information
- Using the new
Query Tags feature along with a tool like https://pganalyze.com to deeply investigate operations or overall database health/activity
Let's look at how we can use each of these tools in order to better help us understand how our application is performing.
Database Walkthrough, Pt. 1 ("ANALYZE" feature)
Using Hasura's ANALYZE feature to display the compiled SQL query for an operation
One useful feature Hasura has is the ability to provide you with the compiled SQL query and a non-executed (theoretical/hypothesized) query plan for a GraphQL operation.
There are multiple ways to get this information. The compiled query is available on the Metrics dashboard, as part of operation info on several of the sub-pages, but another way we can get it is by simply pressing the ANALYZE button on the GraphiQL dashboard:
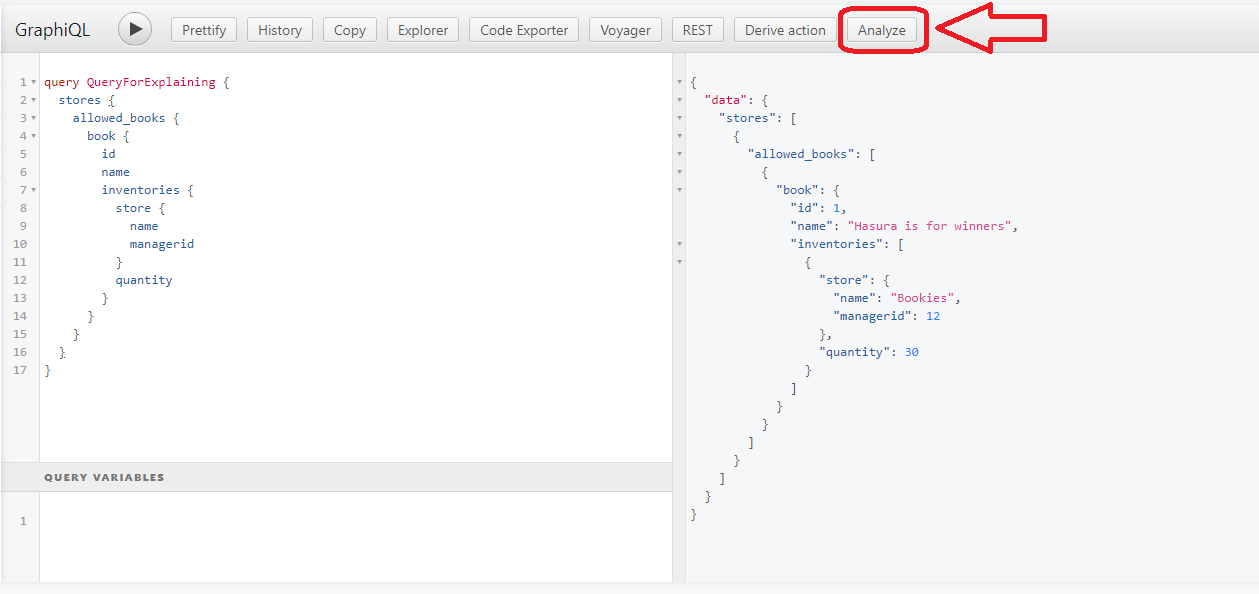
This will open a modal that contains:
- The SQL Query itself
- An execution plan (the query is not actually run to produce this)
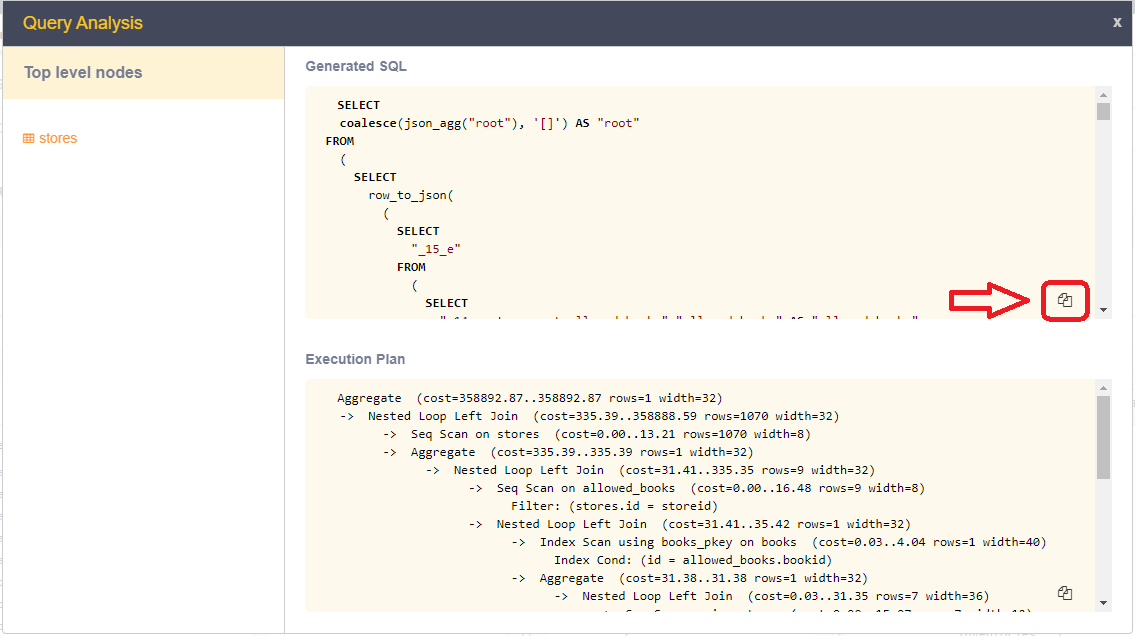
If we copy the compiled query, we can use this to produce a report via EXPLAIN ANALYZE that can be very helpful when searching for performance-related issues or checking for proper use of indices, etc.
You can copy the query by pressing the COPY icon in the bottom right of the execution plan -- marked here by the red area circled in the image below:
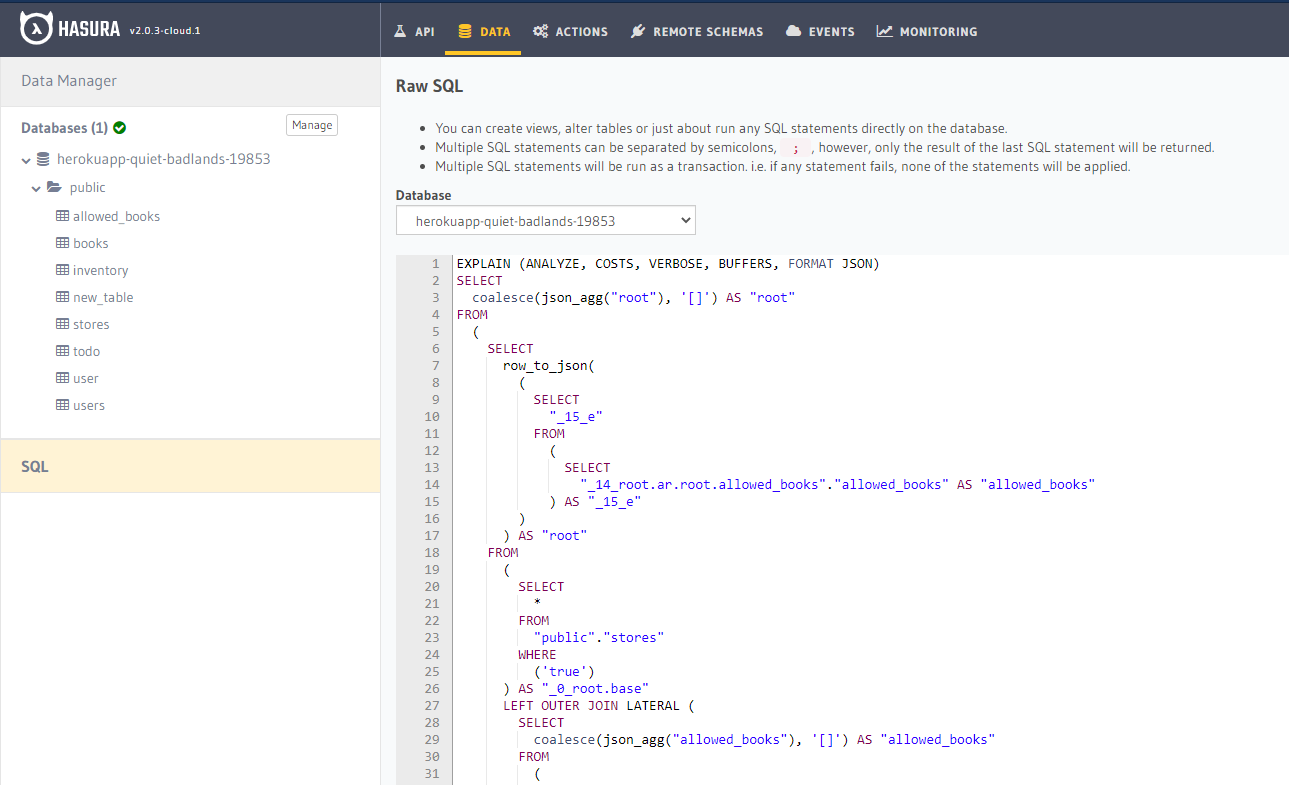
If we paste the output of the compiled query into the query-editor on the DATA page, prepended with:
EXPLAIN (ANALYZE, COSTS, VERBOSE, BUFFERS, FORMAT JSON)
And run it, a report will be produced:
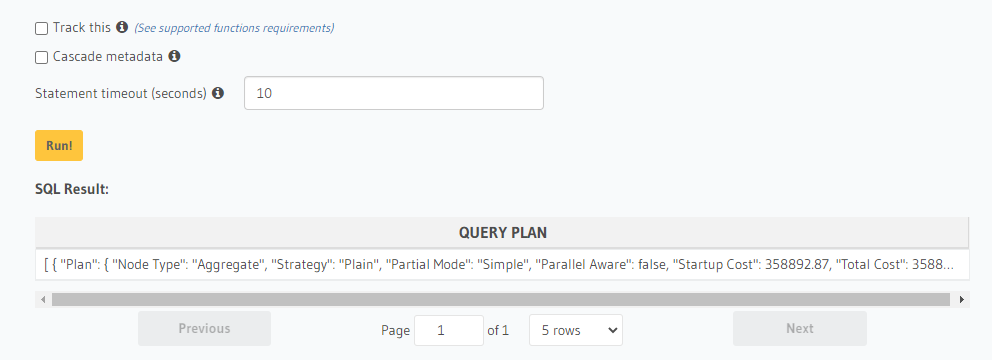
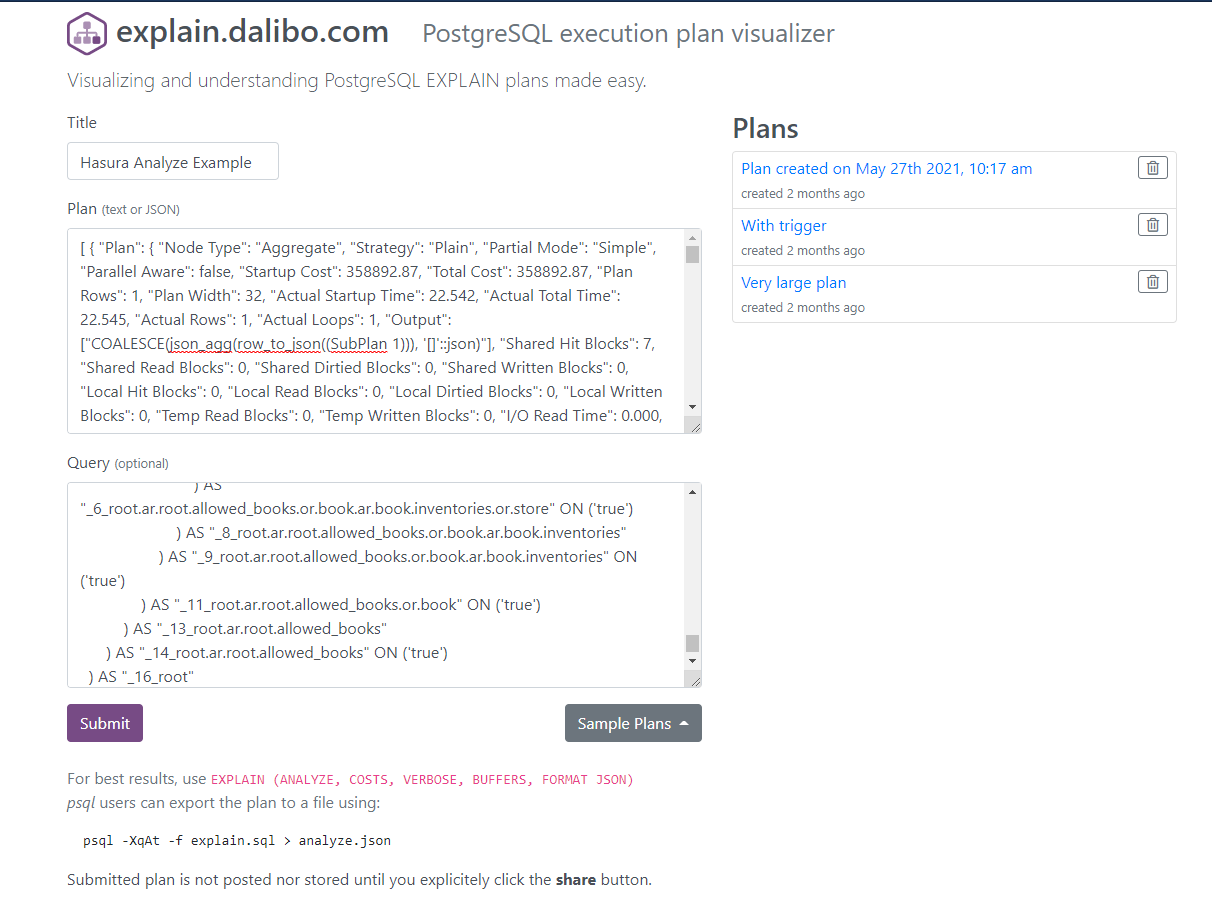
We can then copy that plan, along with the original generated SQL query, and input it at https://explain.dalibo.com to get an incredibly helpful visualization of it:
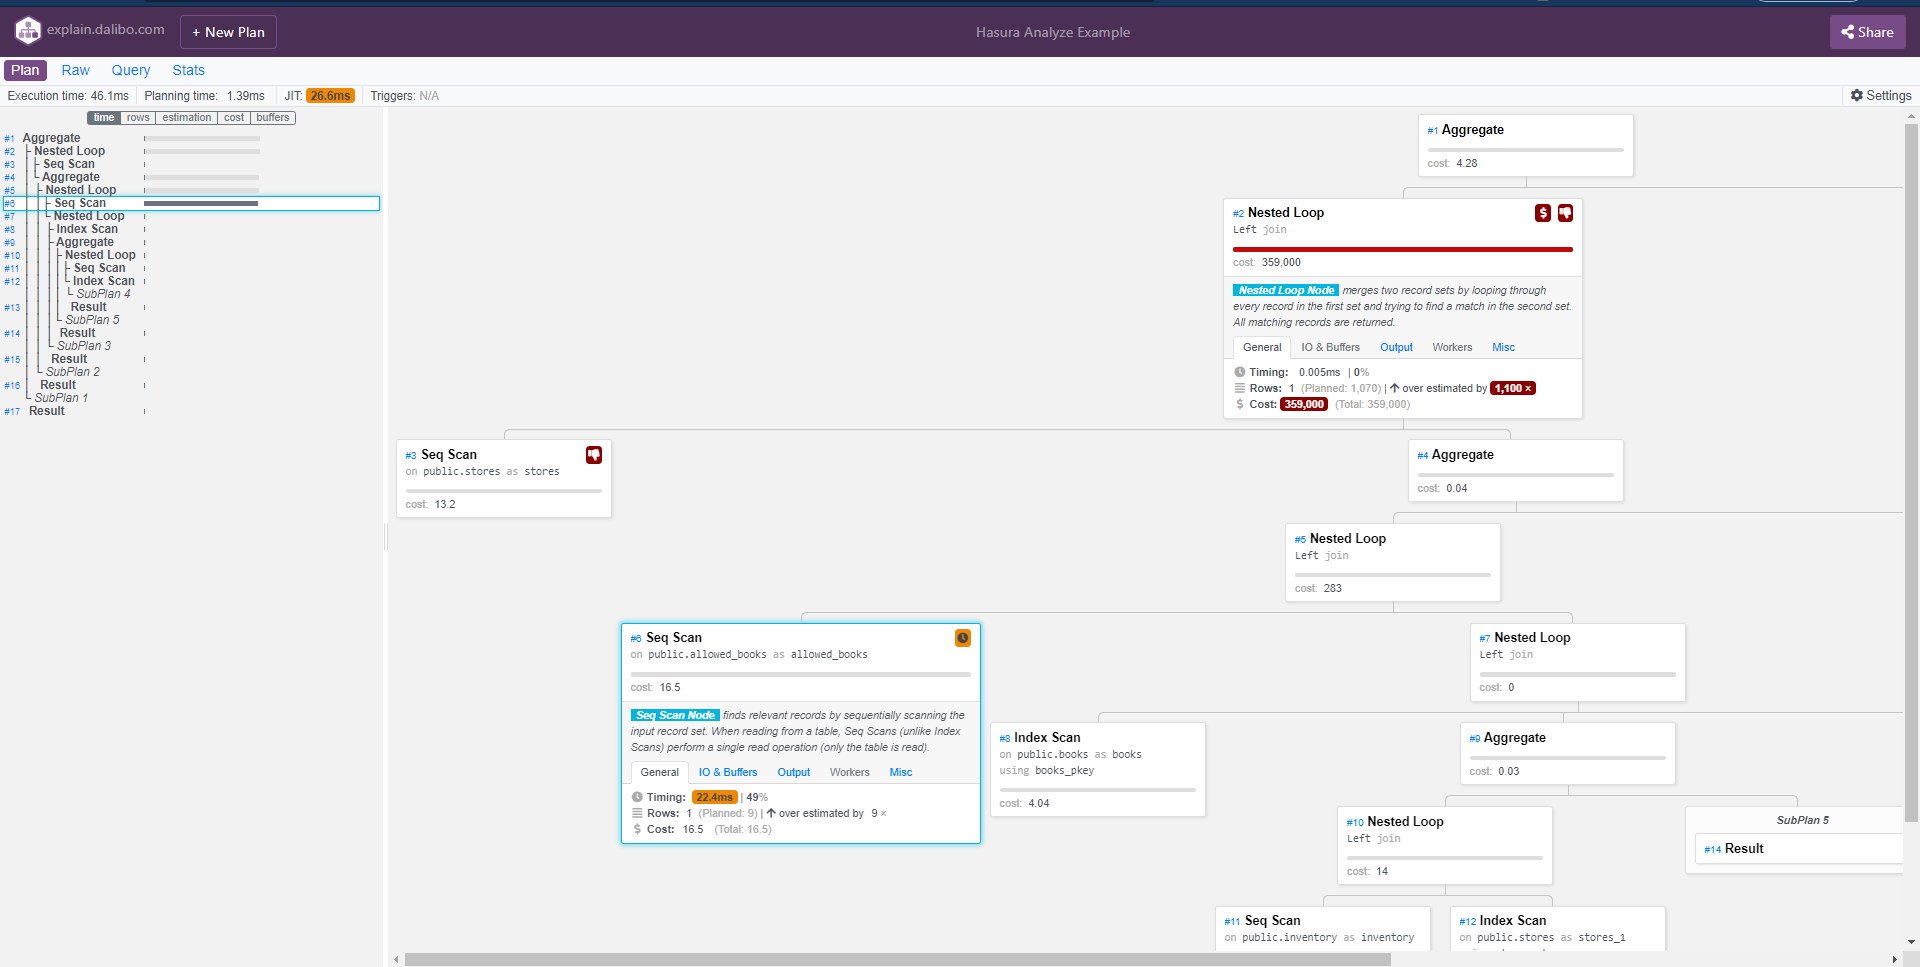
From the results, one thing we notice immediately is that the grand majority of the operations processing time appears to be spent on a Seq Scan for allowed books.
The reason behind this (in this demonstration/example) is almost certainly due to the row count being too low to utilize any indices (unless we run set enable_seqscan=false on our DB to force this). It is easy to see how this kind of visualization can be tremendously helpful in real-world situations.
Database Walkthrough, Pt. 2 (Cloud Metrics dashboard)
Another source of information we can use is the Metrics dashboard. There is more than one place that contains information we may be interested in, but the most directly related to the database is the spans/timing information.
That information can be found by navigating to an individual operation's details modal.
To get there, first decide on an operation you want to examine. Let's say it's something like this:
query QueryForExplaining {
  ...
}
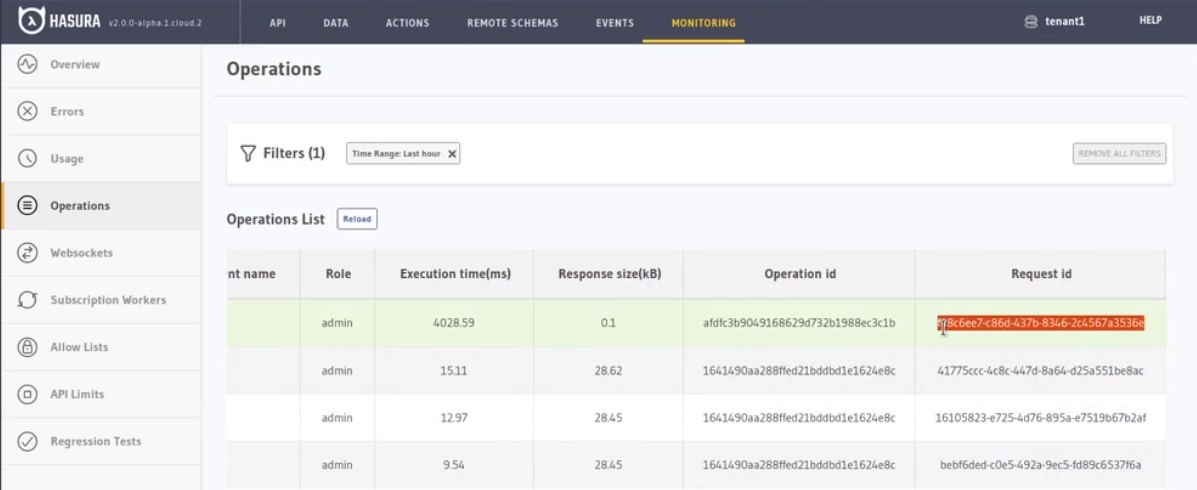
Assuming this query has been run sometime relatively recently (if it hasn't you can run it from the GraphiQL tab), navigate to the "Metrics" tab, and then select the "Operations" panel from the left-hand menu:
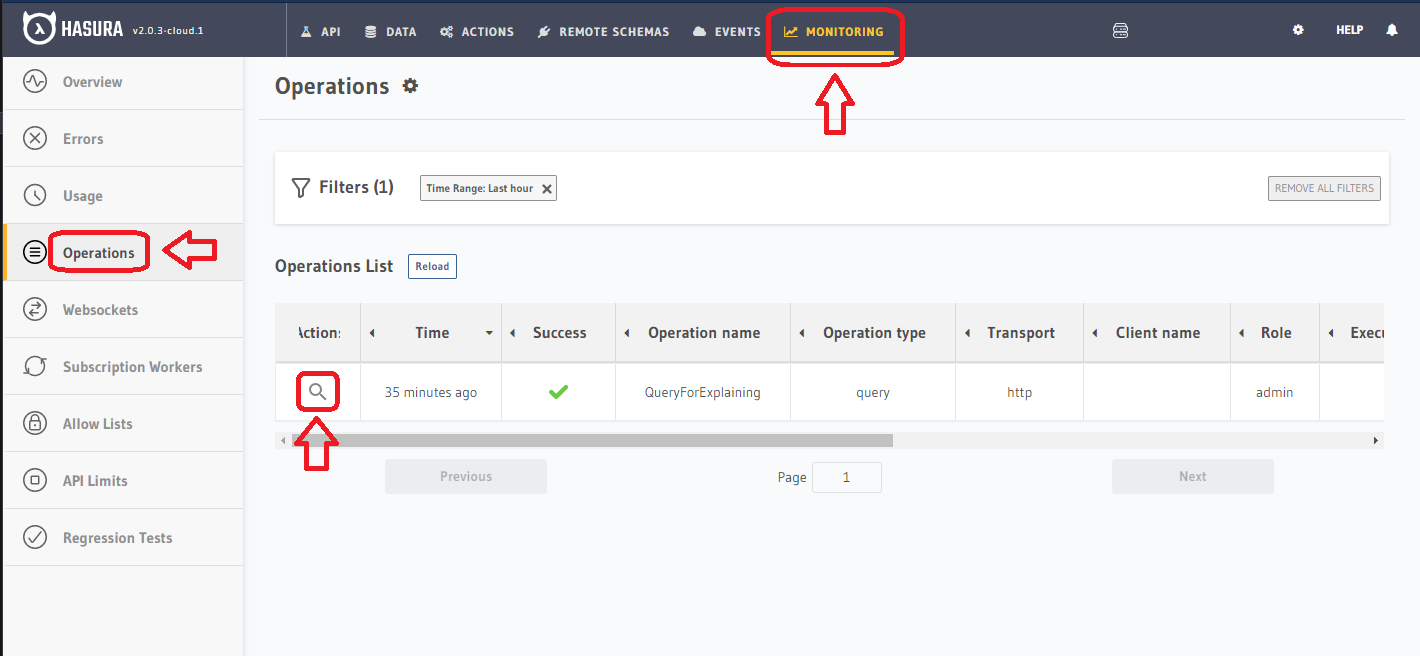
Then, find the operation you're looking to inspect, and click on the "Magnifying Lens" icon under the Actions column. This icon is circled in red in the image above.
This will open a modal containing detailed information about that particular operation.
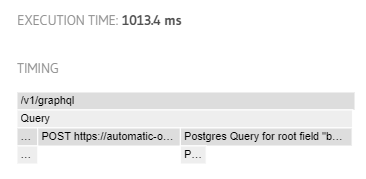
One of the pieces of info available to us here is the waterfall-style request timeline. Using this, we can see where the operation spent each portion of it's time, relative to the total processing time:
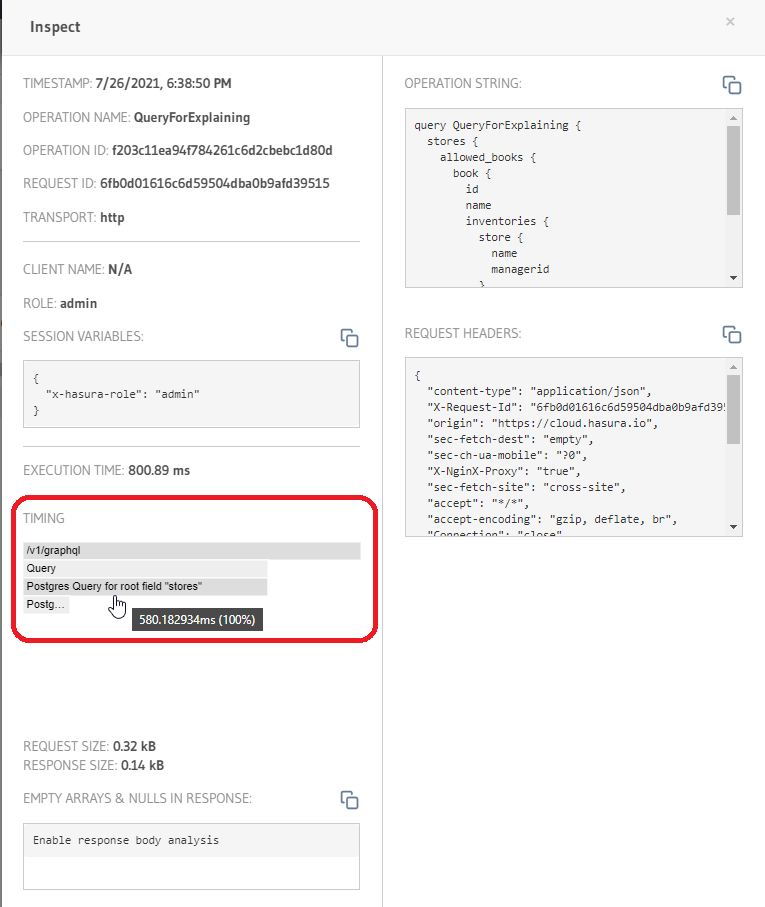
In the image above, circled in red is the TIMING portion of the modal. Here the breakdown of request timing is available.
You can click on segments of the span to zoom in or out, or hover your mouse over them to view a popup containing the precise millisecond timing and relative percentage of the total that span counted for (pictured).
This plot shows its usefulness particularly when:
- A) Trying to get a brief overview of where an operation is spending it's time, so you can decide which part ought to be investigated
- B) Visualizing the execution of queries that contain one or more calls to Actions/Remote Schemas/Remote Joins
In the case of B, the reasoning for that may be more apparent if visualized.
Here's what the trace looks like for an operation that calls out to a Remote Schema and joins on the return value:
metrics-dashboard-3
Database Walkthrough Pt. 3! (Query Tags)
The most recent feature added to the Hasura observability/debugging arsenal is a feature called "Query Tags".
What Are Query Tags?
Query Tags are SQL comments which are made up of key=value pairs that are appended to generated SQL statements.
Why do we need Query Tags?
When the following query is sent to Hasura
query GetChild {
  child {
     name
  }
}
The SQL generated is something like:
SELECT * FROM child;
But when we are looking at Postgres logs and trying to correlate the generated SQL statement with the actual GraphQL request, it quickly becomes difficult.
Had we had more information such as operation_id/tracing info etc, along with the SQL statement, it would make the mapping easier.
The way we can provide such information alongside the generated SQL statement is by appending a comment. And this is what the Query Tags are.
With Query Tags, whenever we issue a Query or Mutation - The generated SQL has some extra information.
In the case of above example, with the query tags the generated SQL would look like:
SELECT * FROM child /* request_id=487c2ed5-08a4-429a-b0e0-4666a82e3cc6, field_name=child, operation_name=GetChild */
The metadata present in these comments can be used by some tools to analyze DB load and track/monitor performance.
One such tool is https://pganalyze.com
In the guide below, we'll walk through how to integrate pganalyze with Hasura using the new Query Tags feature and show the process of tracking an actual query operation.
Consuming Query Tags with pganalyze
Note: The below process assumes you are using a Hasura Cloud app connected to a Heroku database. If this isn't the case, you will need to select one of the other provider instructions from the pganalyze dashboard to suit your scenario.
-
Create an account at pganalyze and log in to the dashboard (the 14 day free trial is sufficient for this purpose).
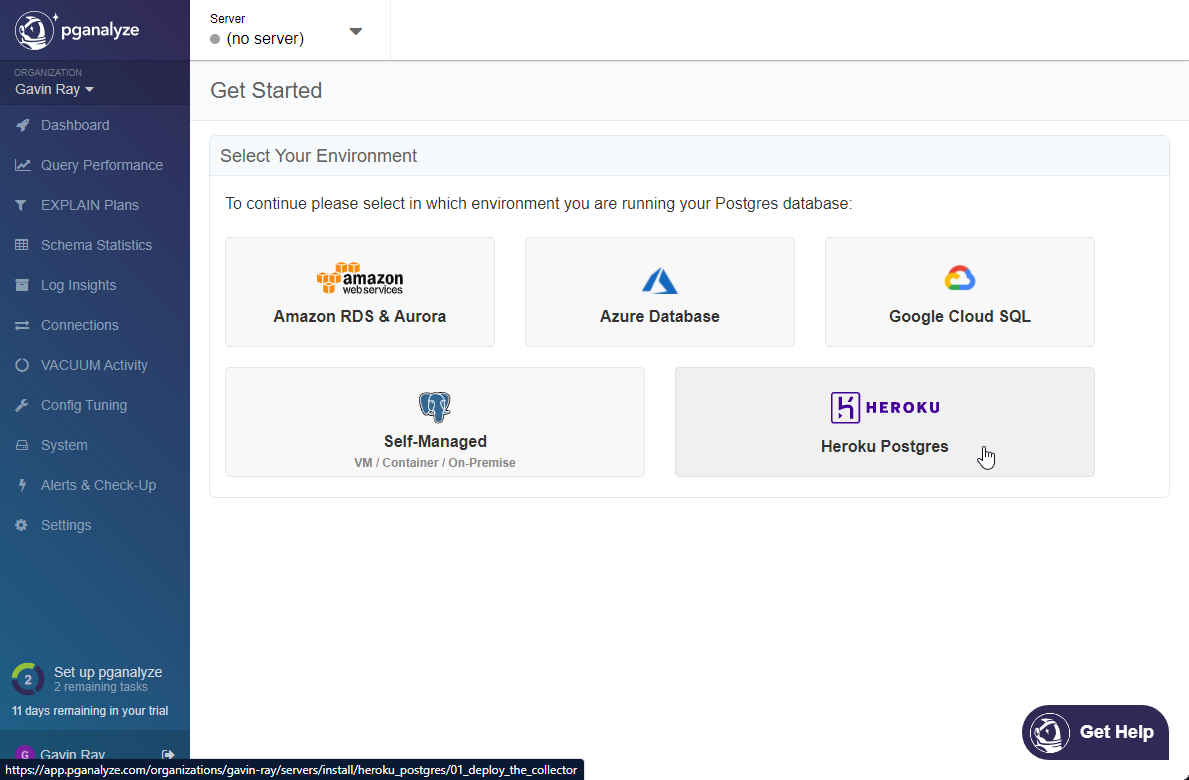
-
From the "Getting Started" page, select the Heroku Postgres environment:
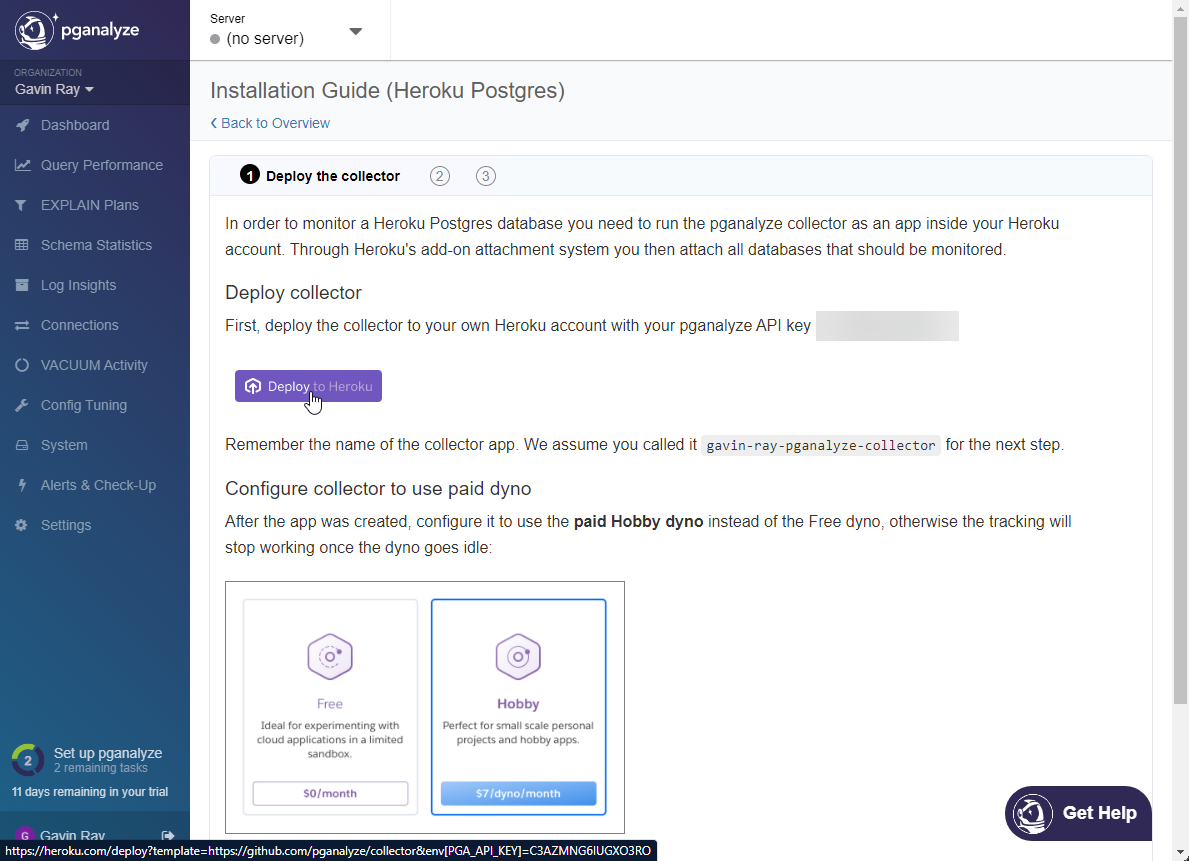
- On the following page, click the
Deploy to Heroku button to deploy the required collector app on your Heroku account. The notes say that the $7 hobby tier are required (due to collector shutting down if the dyno sleeps), and while this is true you may also use the free tier if you're interested in experimenting just to see how it works.
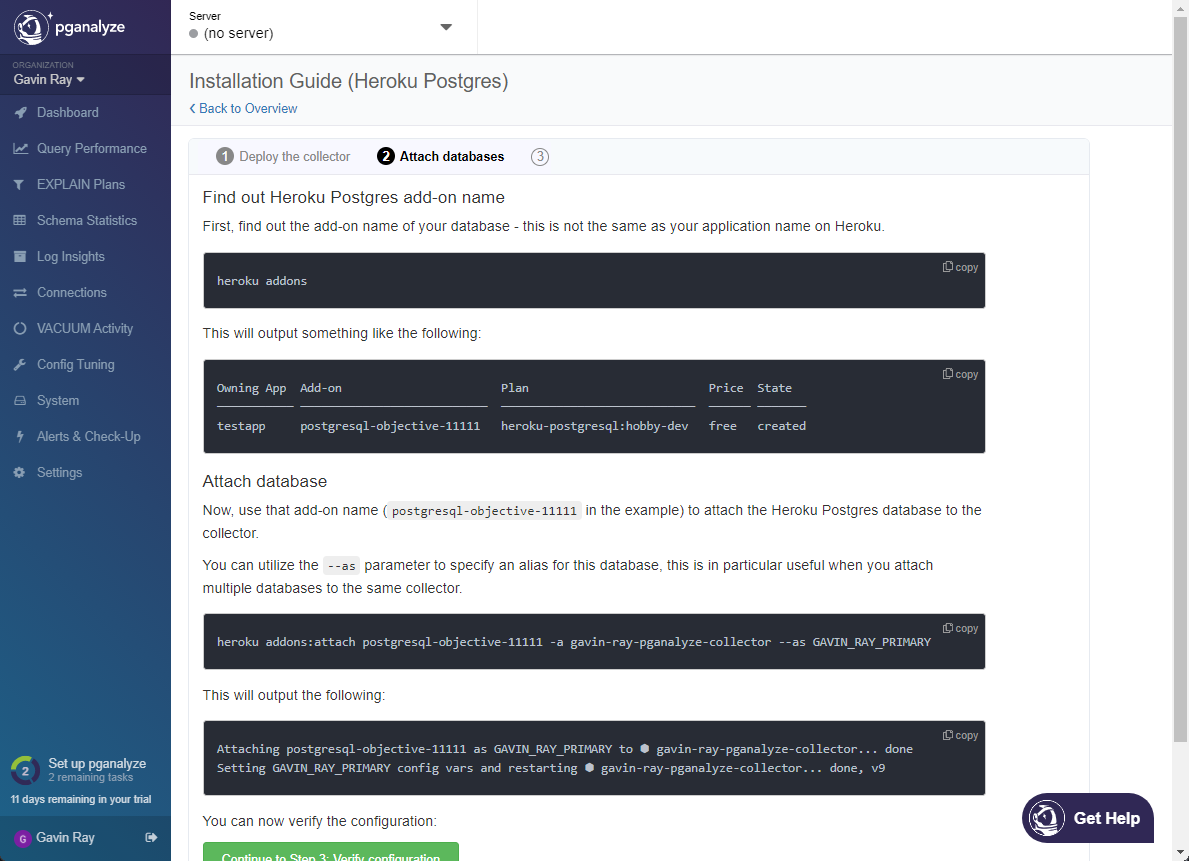
- The installation guide contains the Heroku CLI commands that you can use to set up the environment programmatically. In the interest of offering an alternative, configuration using the Heroku web dashboard will be shown below.
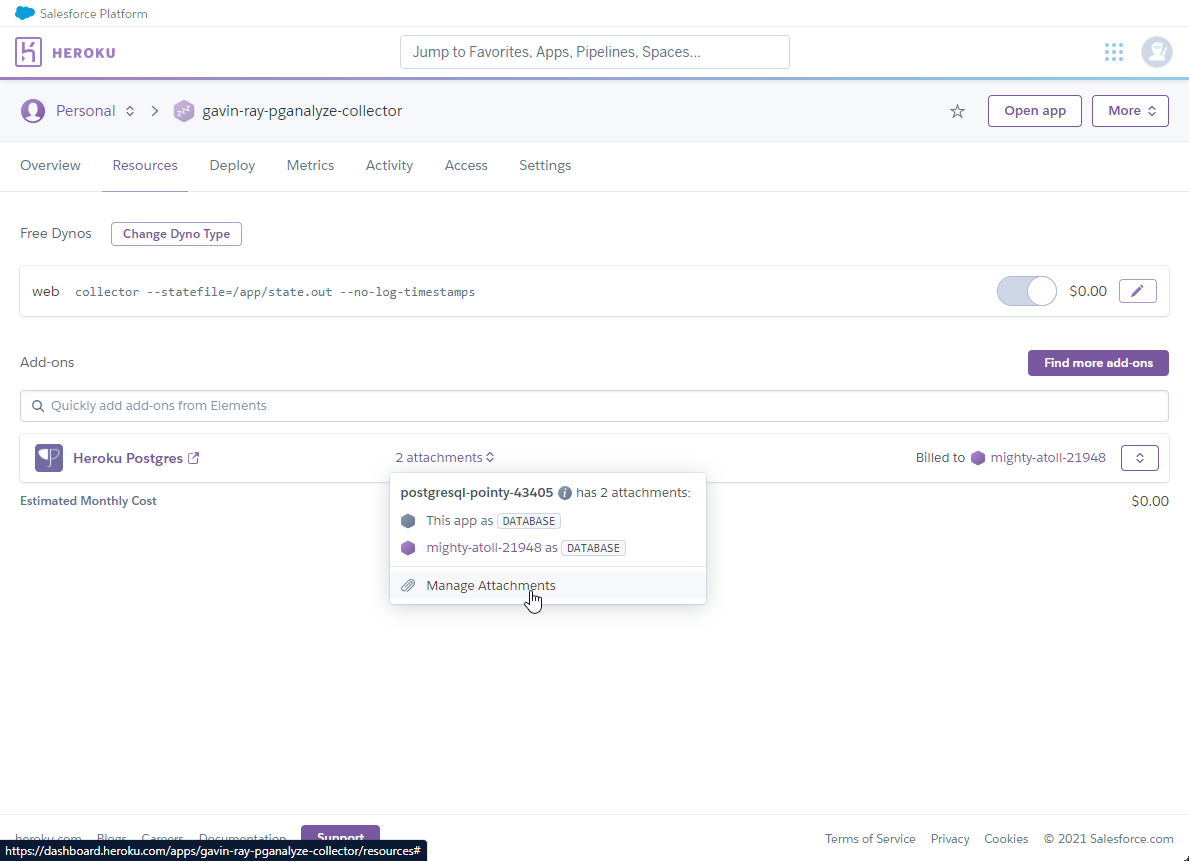
- Open your Heroku Dashboard, and navigate to the
Resources page of the app that contains your Hasura Cloud Postgres. We need to "attach" our Heroku Postgres database (that our Cloud app is using) to the collector app. To do this, start by clicking X Attachments on the Heroku Postgres add-on, and then from the flyout menu, click Manage Attachments:
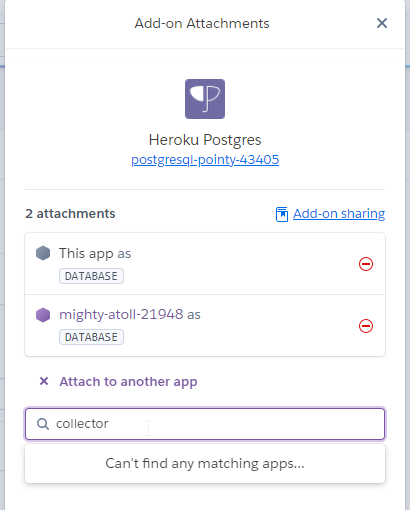
- This will open a slide-out form on the righthand side of the screen. In the form, search for the name of your collector app, and then click to add it (in the image, it's already been added):
- Now that the database has been attached, we can continue with the installation process. The next step is to verify that the installation was successful. You can use the Heroku CLI command pictured, or you can follow along using the images below and the web dashboard:
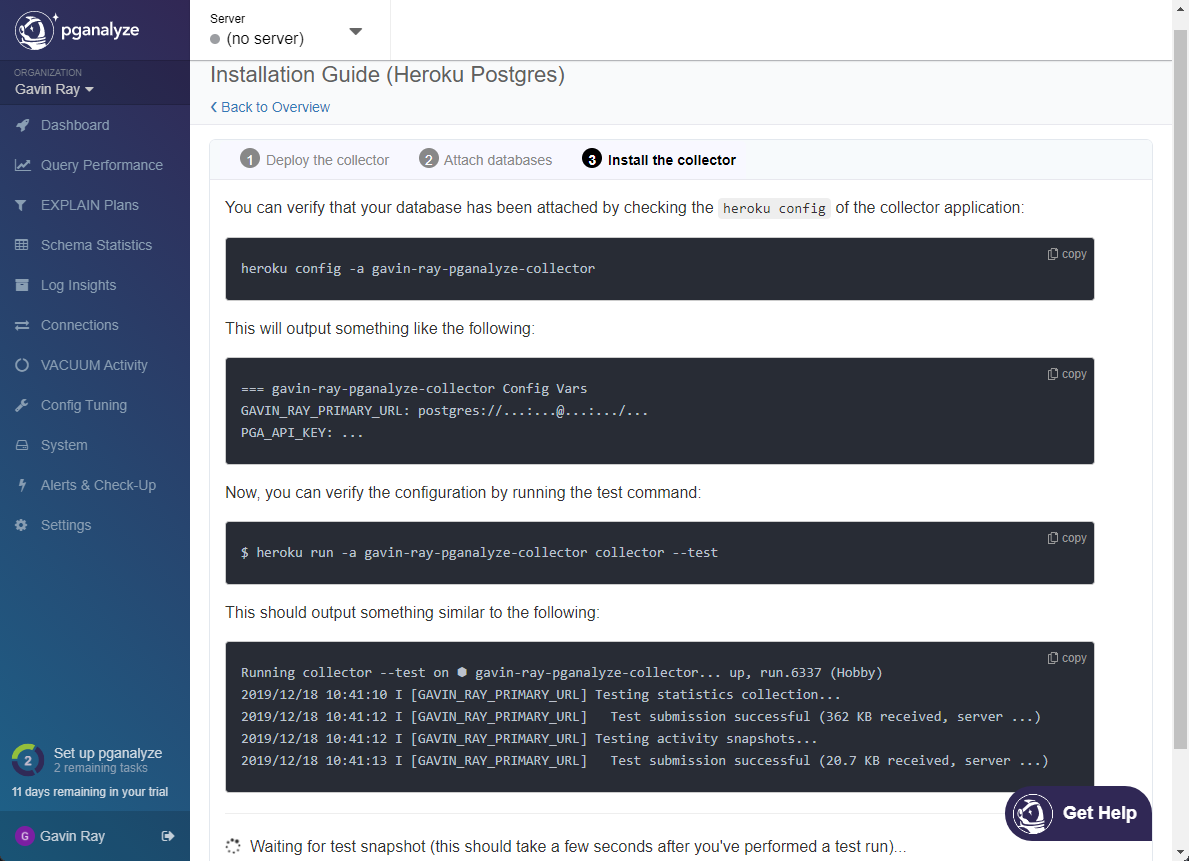
- From the
pganalyze collector app on Heroku, click the button that says More on the righthand side, and then select Run console from the dropdown:
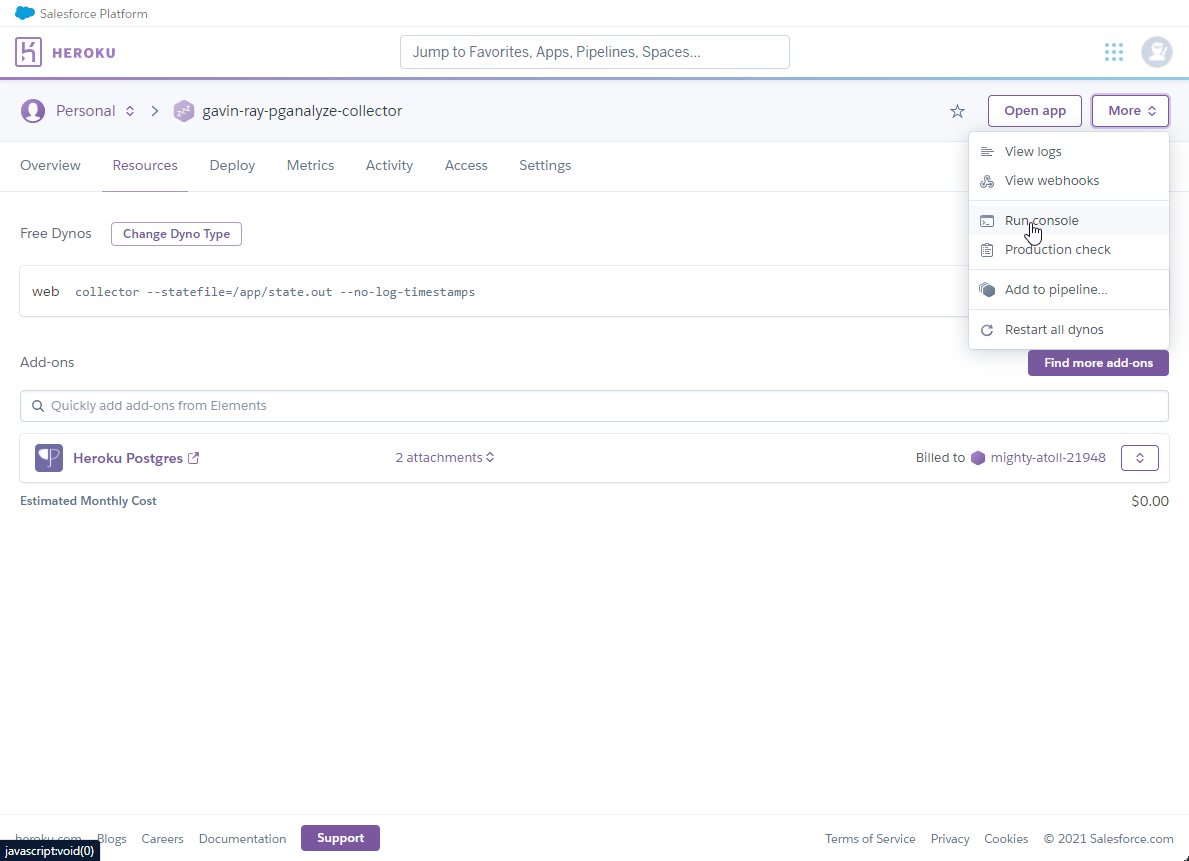
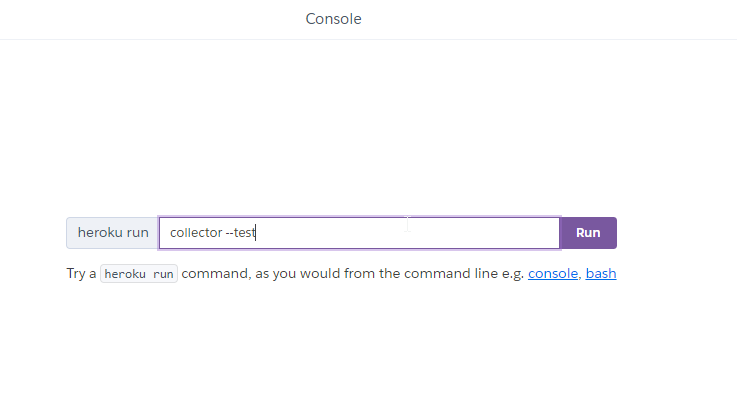
- For the console command, enter
collector --test:
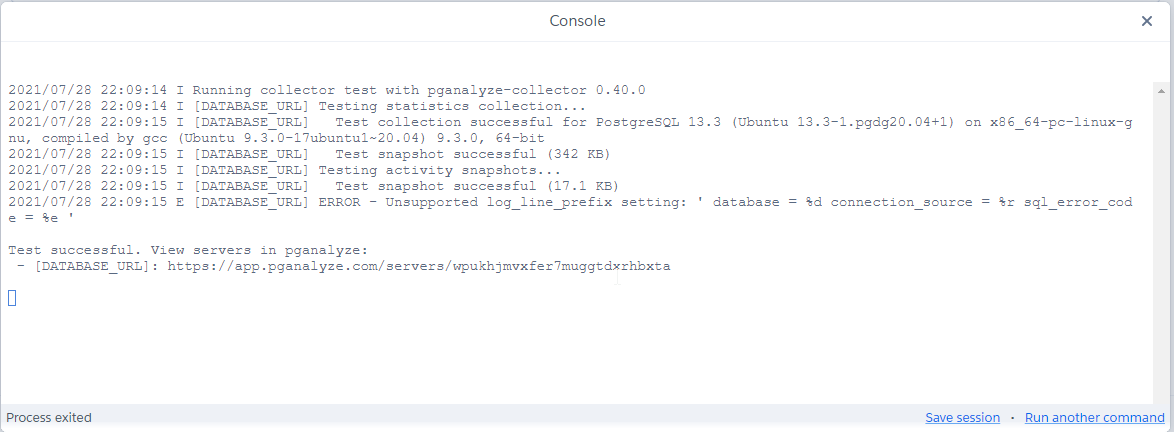
- This should run successfully, and you should see command output with
Test successful at the bottom:
Congratulations! You've now integrated Hasura with pganalyze.
As a concluding task, let's make a query from our Cloud app, and then look it up in pganalyze to view more information about it.
Here's a nonsensically named query for a sample table that I've created in my Cloud app:
query asdadf {
  sample_table(where: {
    id: { _eq: 1}
  }) {
    id
    text
    created_at
    updated_at
  }
}
If we run this query from GraphiQL on our Cloud app console, it will eventually become viewable in the pganalyze dashboard.
Note: This process can take a significant amount of time. IE, 10-20 minutes. Don't be alamred if nothing shows immediately.
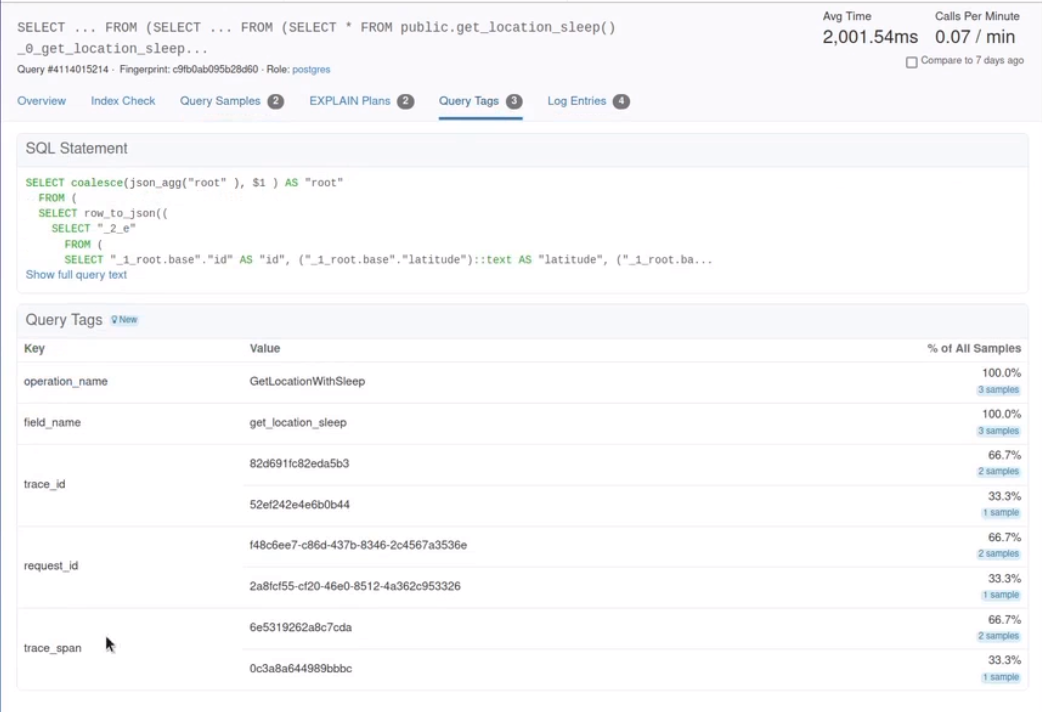
Here on the dashboard, all of the operations are visible:
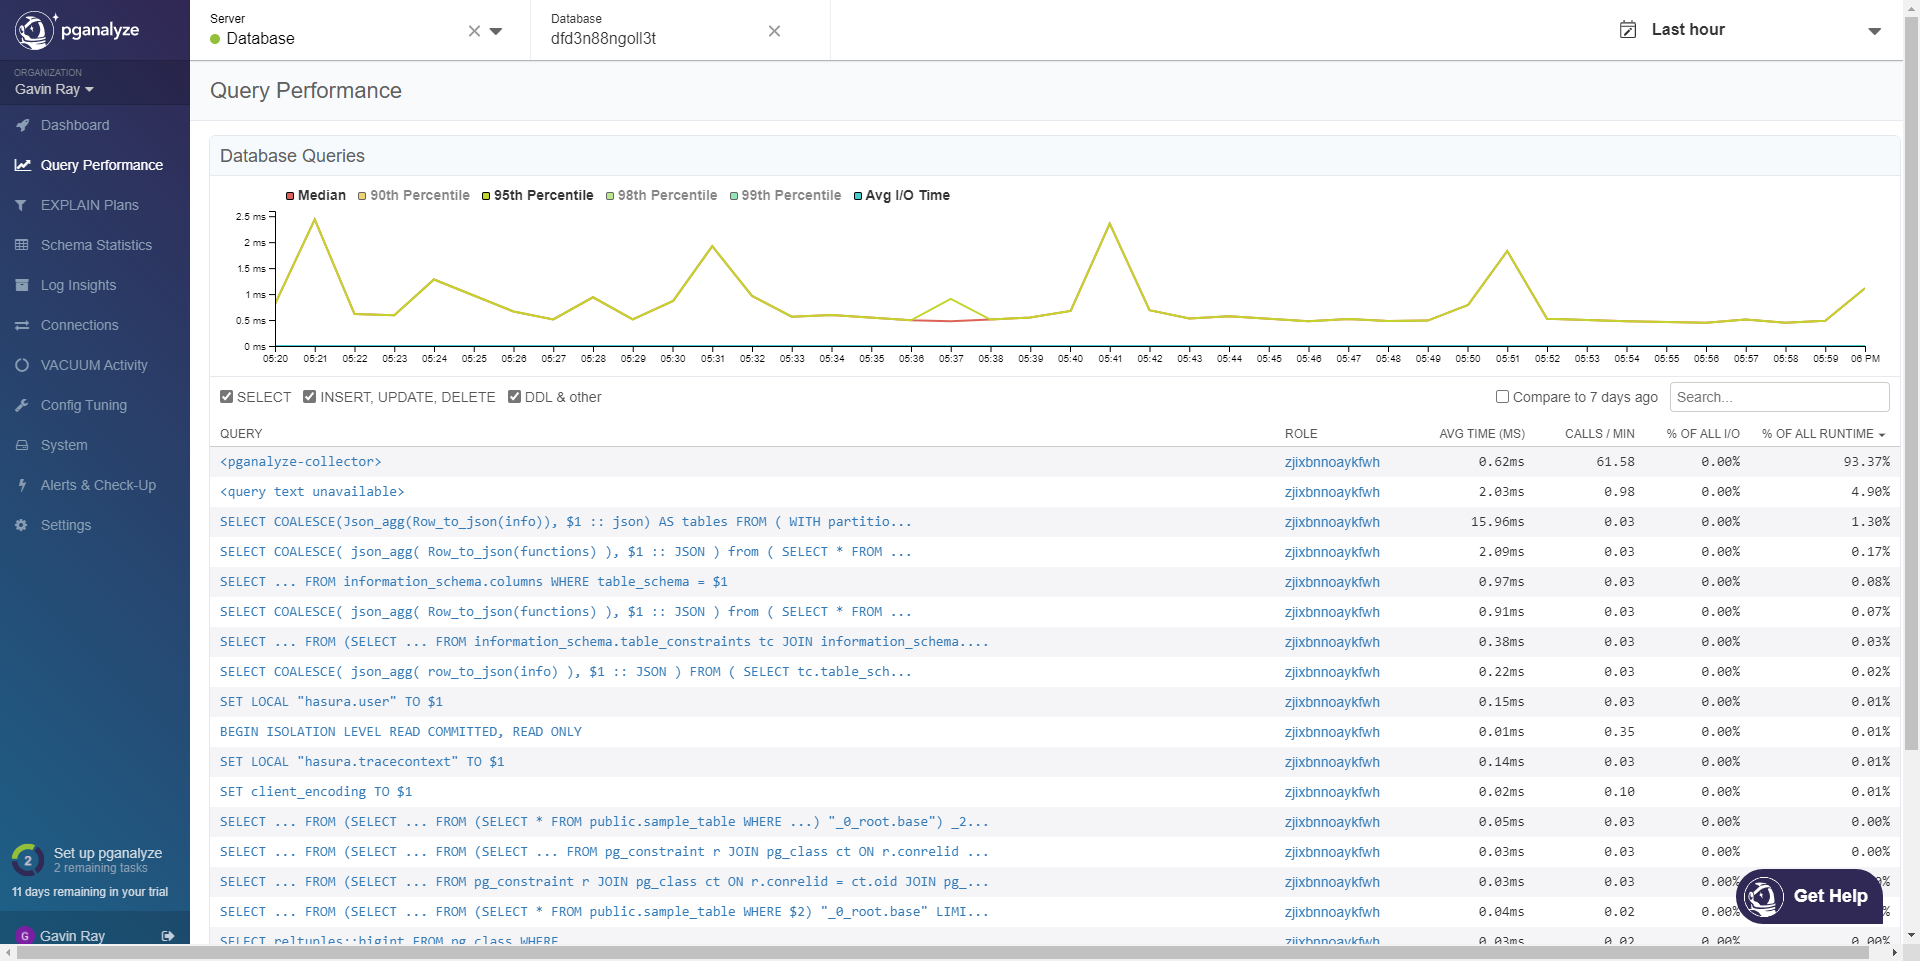
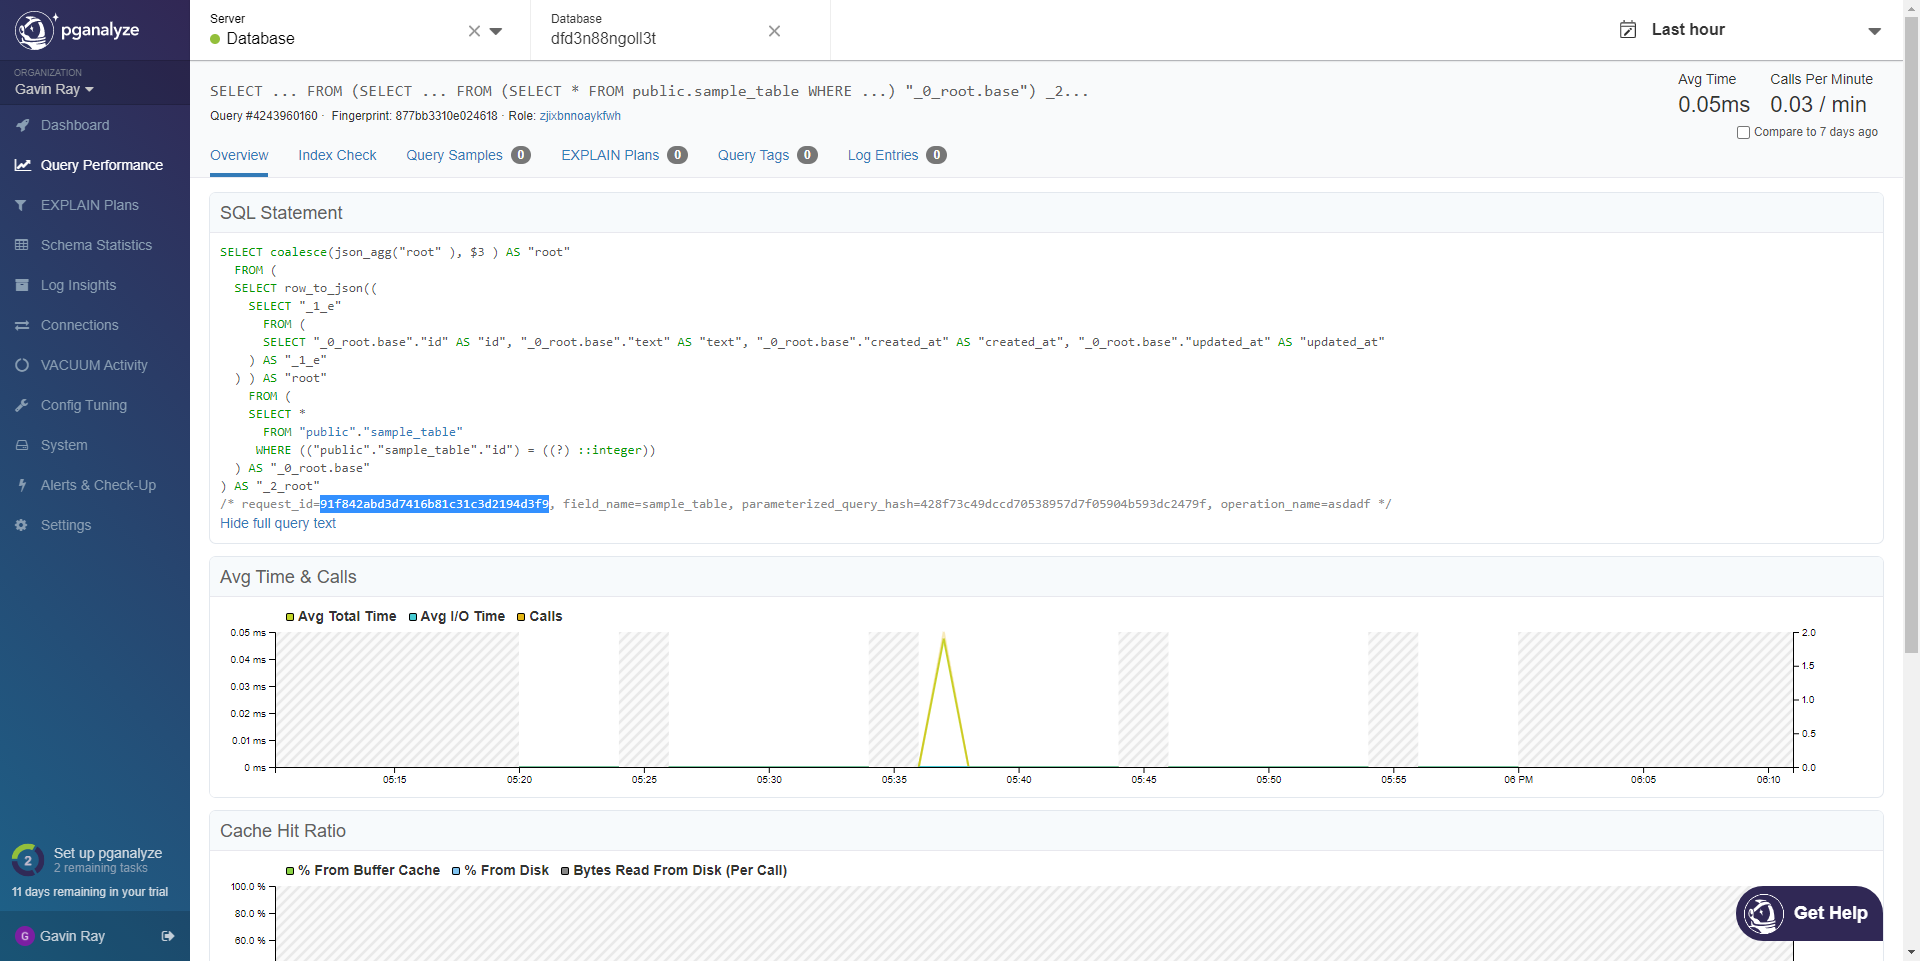
Selecting that operation, we can see the details of the query, as well as a lot of other information:
To quickly locate operations, you can use the Request ID that can be found from the Metrics dashboard on Cloud.
Here is an example workflow of back-tracking from a known operation in the Metrics dashboard, to it's analytics inside of pganalyze:
-
Grab the Request ID from Operations tab on Metrics dashboard:
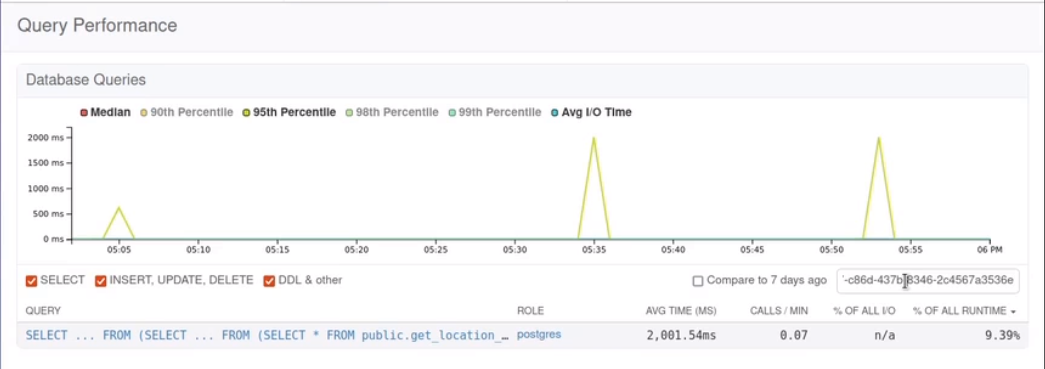
-
Search pganalyze query log by the Request ID
-
Open the matching query to view it's analytics and other relevant data
Let us know if have any questions while trying these out! You can hit us up on github discussions / discord if you need any help!


