In today's fast-paced tech landscape, understanding the intricacies of your application's performance is paramount.
In this blog post, we'll explore how Hasura seamlessly integrates state-of-the-art, open source observability tools via OpenTelemetry giving developers a holistic view of performance, user interactions, and potential bottlenecks.
But first, what is observability?
Observability allows us to gain insight into a system from the outside by asking questions about it, and without knowing how it works internally. Furthermore, it enables us to quickly diagnose and tackle unexpected issues.
To be able to ask those questions of a system, the application must be appropriately instrumented. That is, the application code must emit signals such as traces, metrics, and logs (the tree pillars of observability). When developers don't need to add further instrumentation to troubleshoot an issue because they have all of the information they need, an application is appropriately instrumented.
What is Telemetry?
Telemetry is one of the most reliable ways to monitor the stability and health of software in the realm of software development and application monitoring. Telemetry aids developers in maintaining awareness of the software's performance and alerts them when an issue arises with the application. Applications are no longer monolithic. Maintainers and developers clearly need a simple method to collect data from these complex, and diverse systems, and transmit it for monitoring and analysis.
What is OpenTelemetry?
OpenTelemetry is an open source observability framework that provides a unified way to instrument, generate, collect, and export telemetry data (metrics, logs, and traces) from software applications. It is vendor-neutral and supports a wide range of languages and platforms.
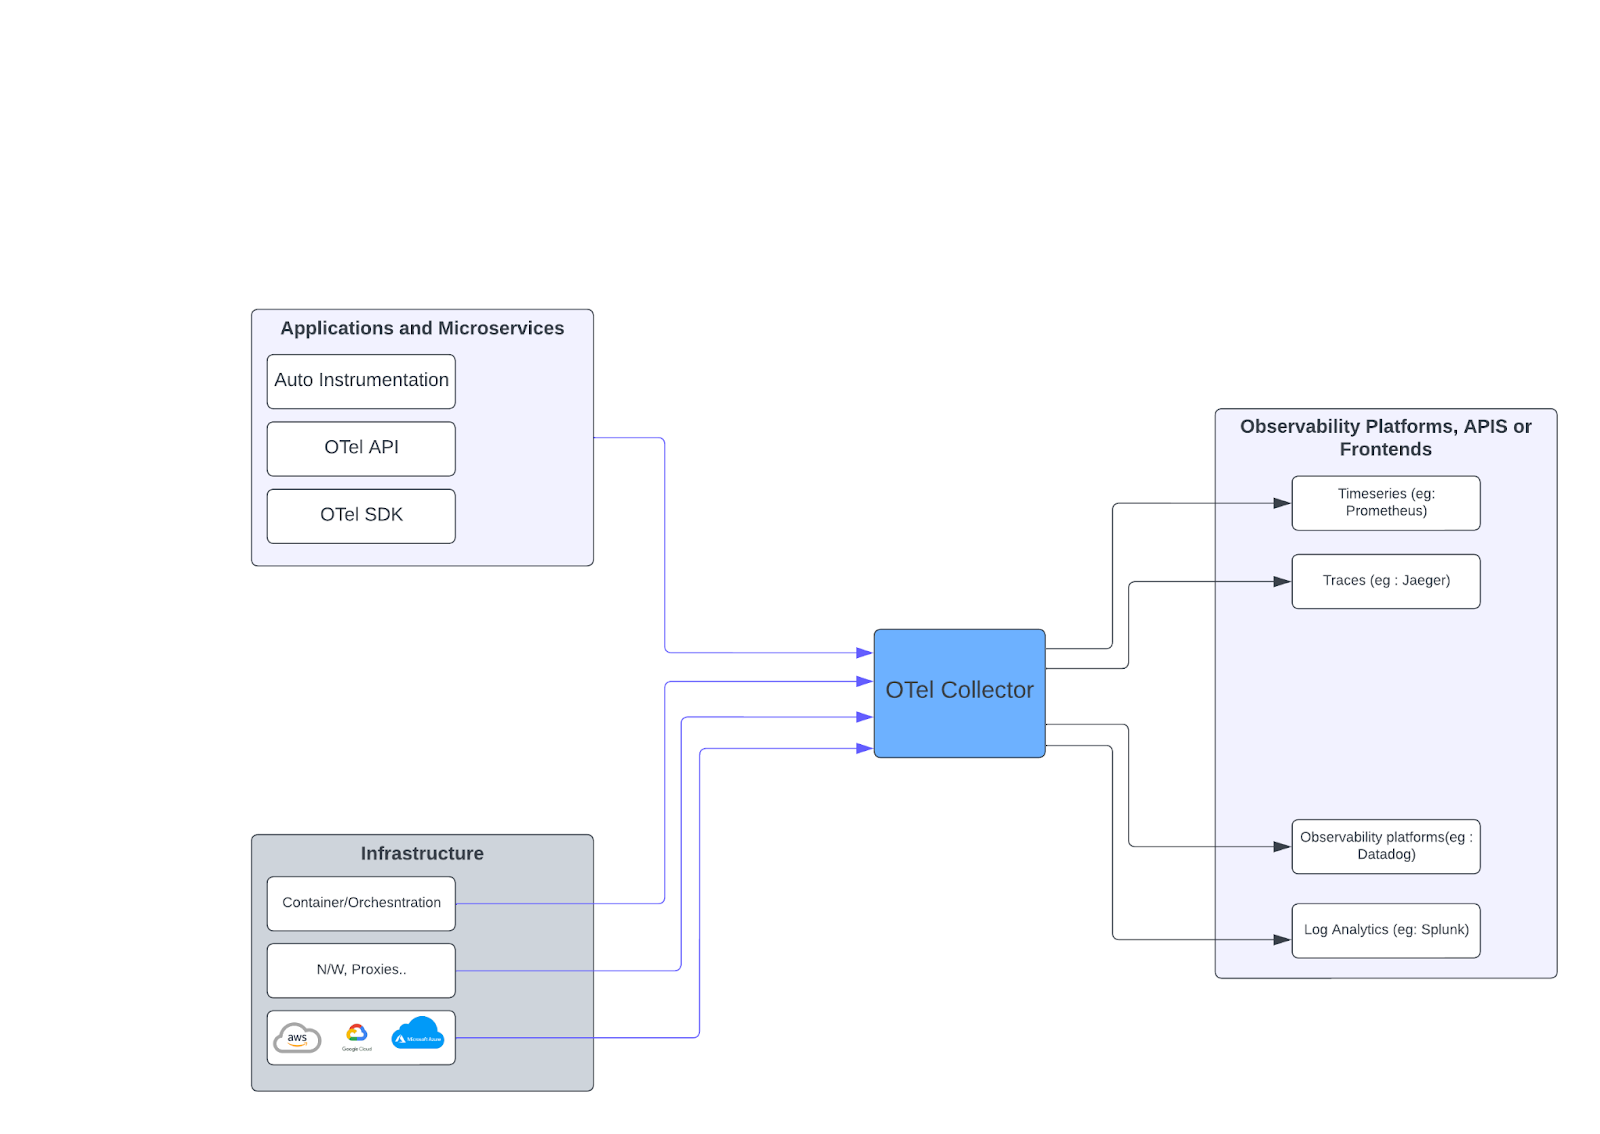
The figure below shows the rough architecture and capabilities of an OpenTelemetry implementation.
OpenTelemetry Reference Architecture
So... why is this a big deal?
Hasura supporting OpenTelemetry standards means a couple of important things for you and your organization.
Saves time
You will not have to deal with the inconvenience of installing various proprietary agents for various backend systems or re-instrumenting code. As a result, there is no need to create new connections as new technologies emerge because the OpenTelemetry collector will continue to trace data and export it without any issues.
Avoid vendor lock-in
When an APM vendor is no-longer suitable for your organization (cost, capabilities, etc.) you don't need to worry about their own custom monitoring tools or agents or connectors. You can freely move across to a better or cheaper APM vendor who will support OpenTelemetry almost seamlessly. You keep your end-to-end visibility with any APM vendor.
Transparency
With OpenTelemetry, you define what data is transmitted outside your application. No more wondering what a proprietary agent might be collecting and sending. You have full visibility and control over collected and transmitted data from your organization or application.
So, how can I use OpenTelemetry with Hasura?
Hasura fully supports OpenTelemetry for its logs, traces, and metrics. This applies to Hasura Cloud (Enterprise) and Hasura self-hosted (Enterprise).
Navigate to your Settings/Monitoring and Observability section from both Cloud and Enterprise console, enable OpenTelemetry Exporter and configure your endpoints according to our documentation here. And that's it. Your Hasura signals are now available on your preferred APM tool.
Introducing the Hasura observability stack
Enterprise observability doesn't have to cost you a lot. Sure, there is a wide variety of APM platforms you can choose from. But one of the greatest observability stacks is available for free.
As a reference, we at Hasura have created a pre-built, pre-configured, fully open-source-based observability stack for you. It comes with everything you need to have an enterprise grade observability using open source tools. Prometheus for your metrics, Grafana for visualizations, Jaeger for your tracing data, and AlertManager for event monitoring and alerting. Giving it a try is as easy as downloading a dockerfile and running docker compose. It brings up the latest Hasura GraphQL engine and all the components needed for end-to-end observability.
Our observability stack comes with dashboards hand-built by Hasura engineers. They are one-click installable, and designed to show the right information that matters to you. Head over to our community repo here to give it a spin.
Getting started
The quickest way to get started with our open source observability stack is to clone the repository and use docker. There are two important files here you would need changes made to
docker-compose.yml
Modify the file to choose components you want to deploy. By default, Hasura GraphQL Engine, Prometheus, Grafana, Redis, Postgres (as the metadata DB and data source and an additional instance as a read-replica), Node-exporter, Alertmanager, Blackbox-exporter, Jaeger, Loki and Otel-collector. The selection depends on what components you want to deploy and what type of observability matters to you most.
2. Dotenv
a. Add your Hasura Enterprise license key to the variable HGE_EE_LICENSE_KEY.
b. Set up your GraphQL admin secret key
c. Optionally, protect your metrics endpoint with a secret. Although optional, this is a recommended step.
d. Choose the Hasura image version you would like to deploy by setting the value of HGE_IMAGE
e. Optionally, choose specific versions of the components listed previously
f. Rename the file to .env in the same location.
3. Deploy the system using docker compose up -d or using the swarm scripts provided in the “utils” folder.
The default configuration enables the Native Prometheus exporter. If you want to push metrics to 3rd-party services that support OpenTelemetry, first disable the metrics API and configure the OpenTelemetry metrics endpoint to the otel-collector service. Browse the console -> Settings -> OpenTelemetry Exporter and configure the metrics endpoint.
Embedded dashboards
To help you get started quickly, we have included a few hand-built dashboards with this distribution. These are built to give you the best view into what matters most in terms of observing Hasura. The dashboards are broadly classified into two categories – general and Hasura.
General
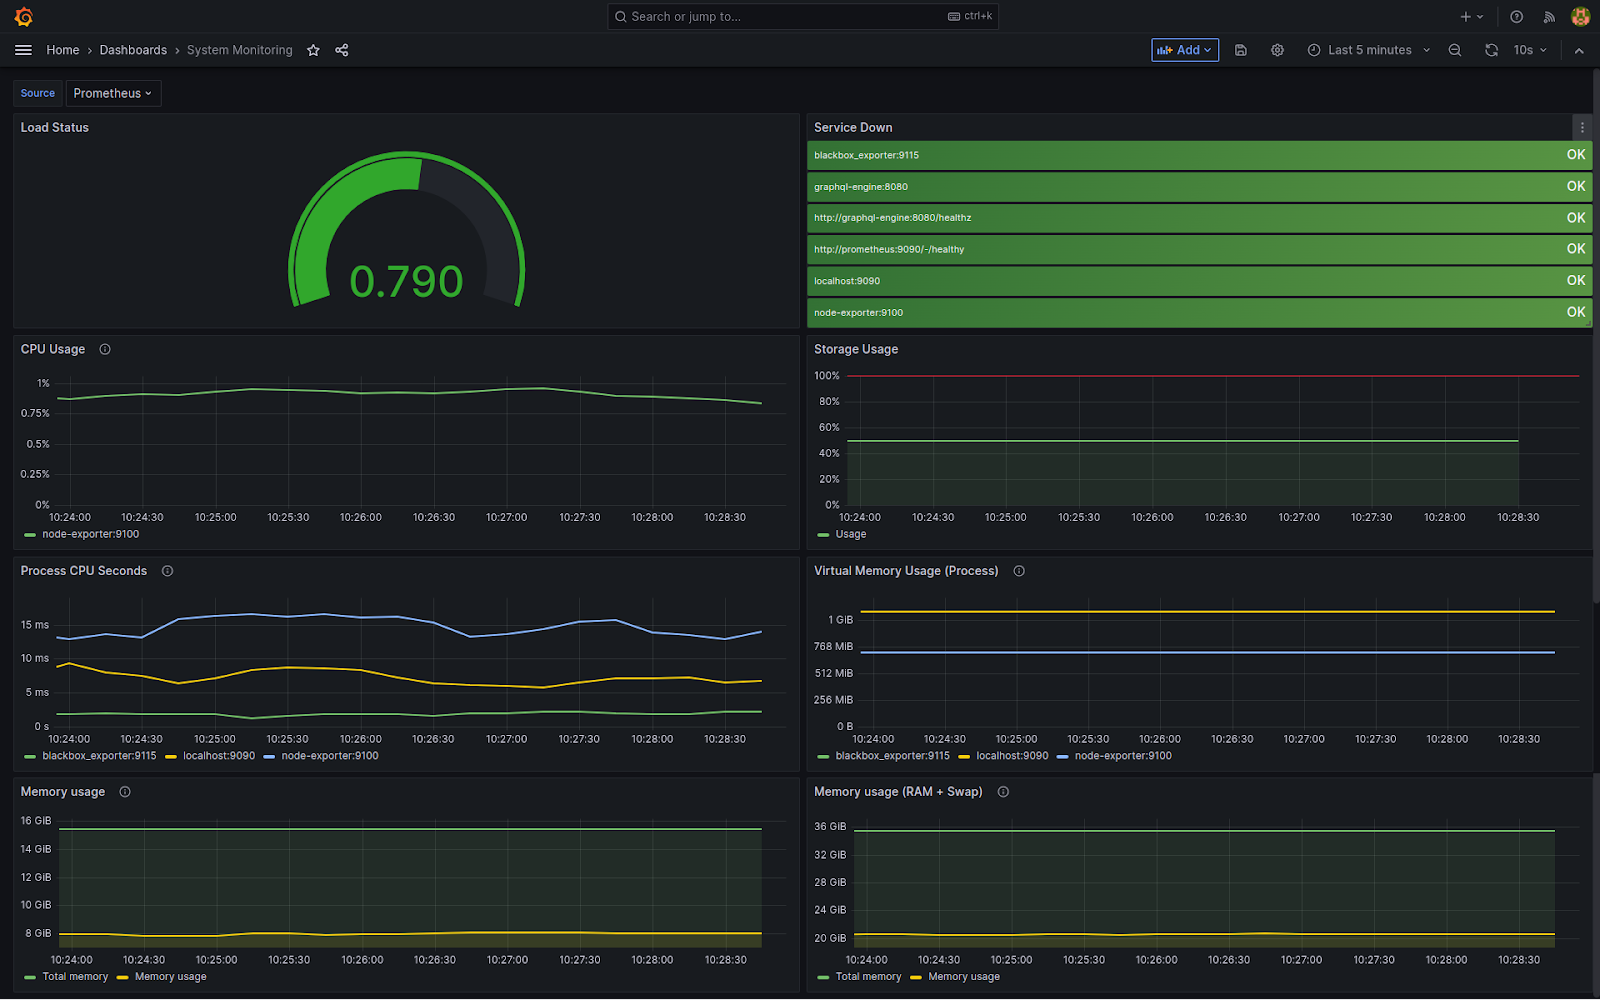
System Monitor gives you basic system information of the environment where you have deployed this stack. This includes CPU, Memory and Storage use, and system load.
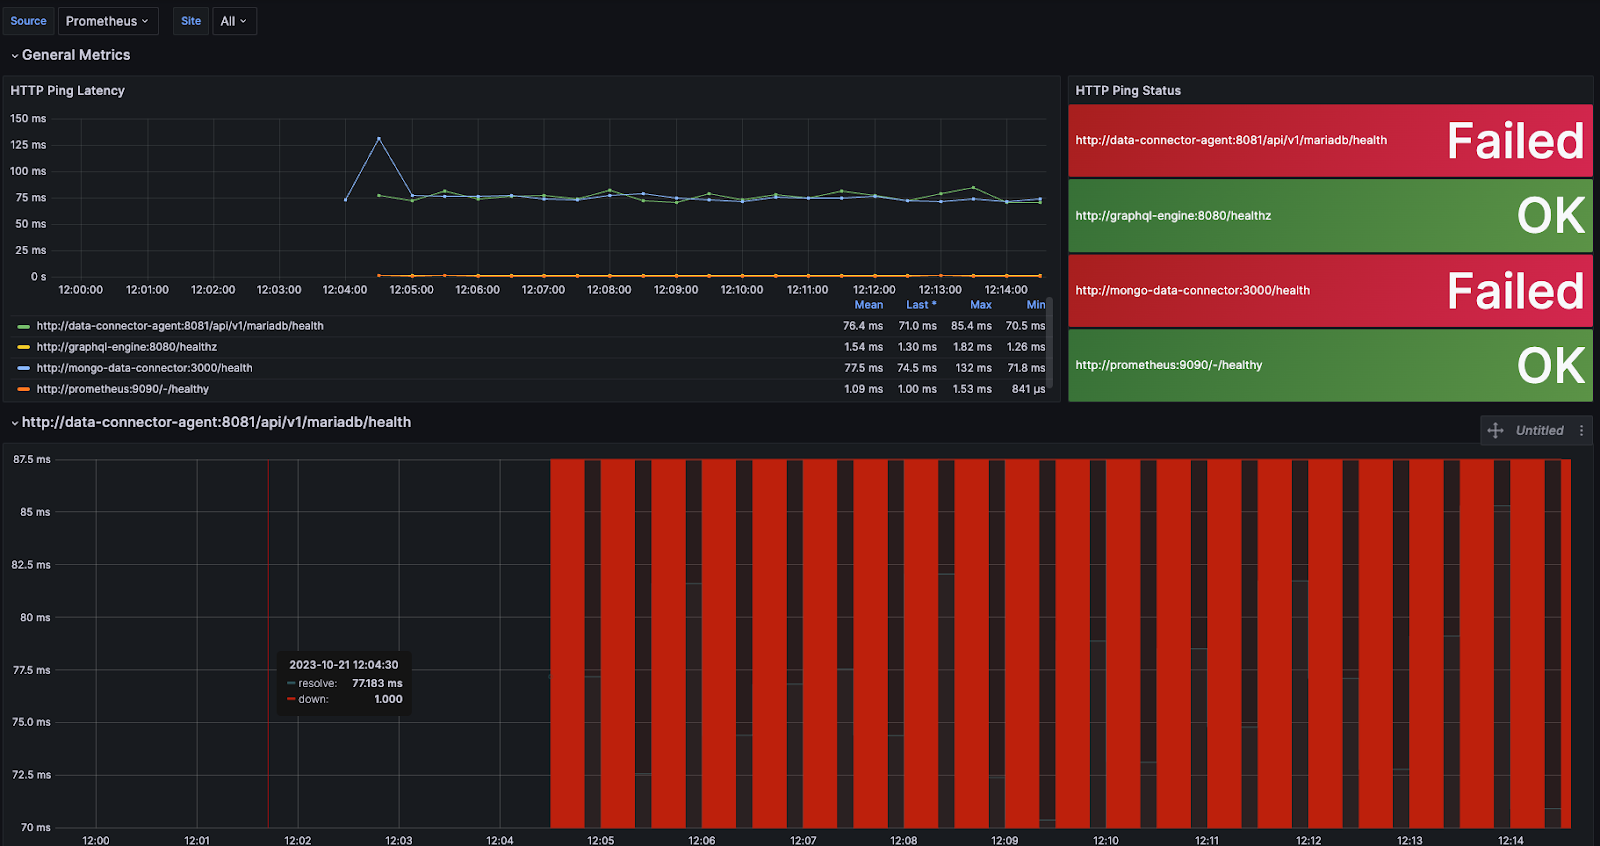
HTTP-Ping monitors various components you have deployed here, including the status of Hasura GraphQL Engine’s health, and various data connectors.
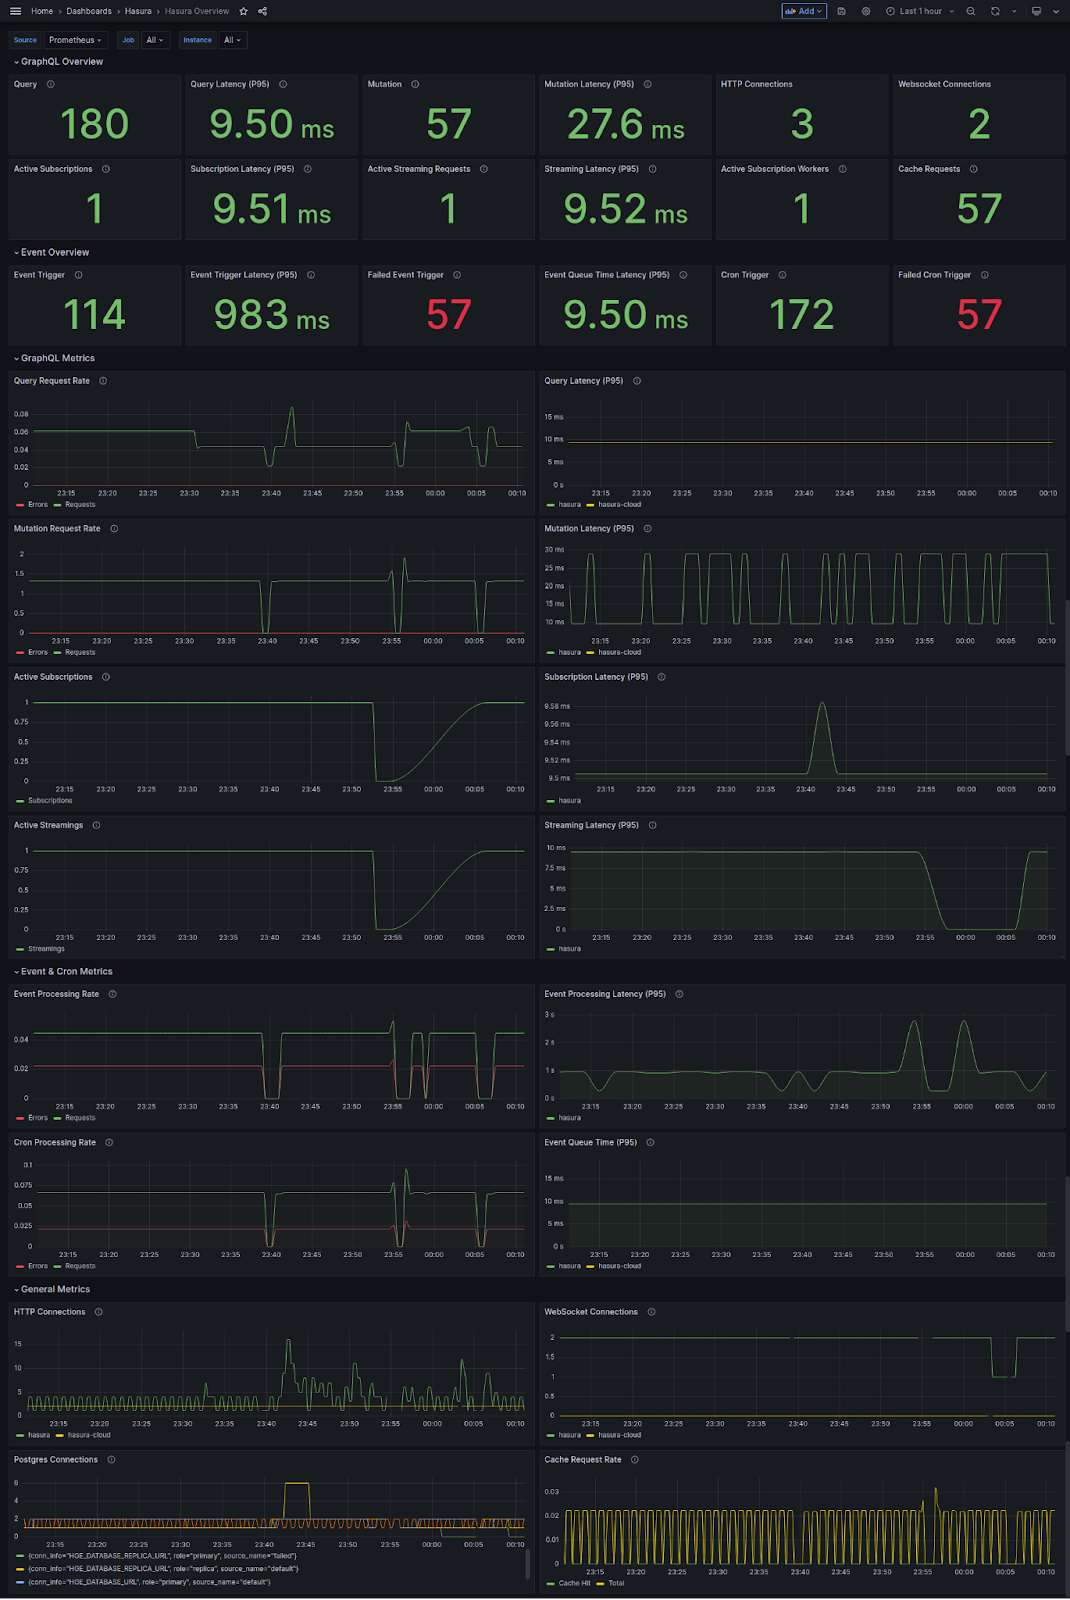
Hasura
An information-dense dashboard showing you a quick overview of most of the golden signals emitted by Hasura. This dashboard could be your “quick-glance” into your Hasura deployment’s health.
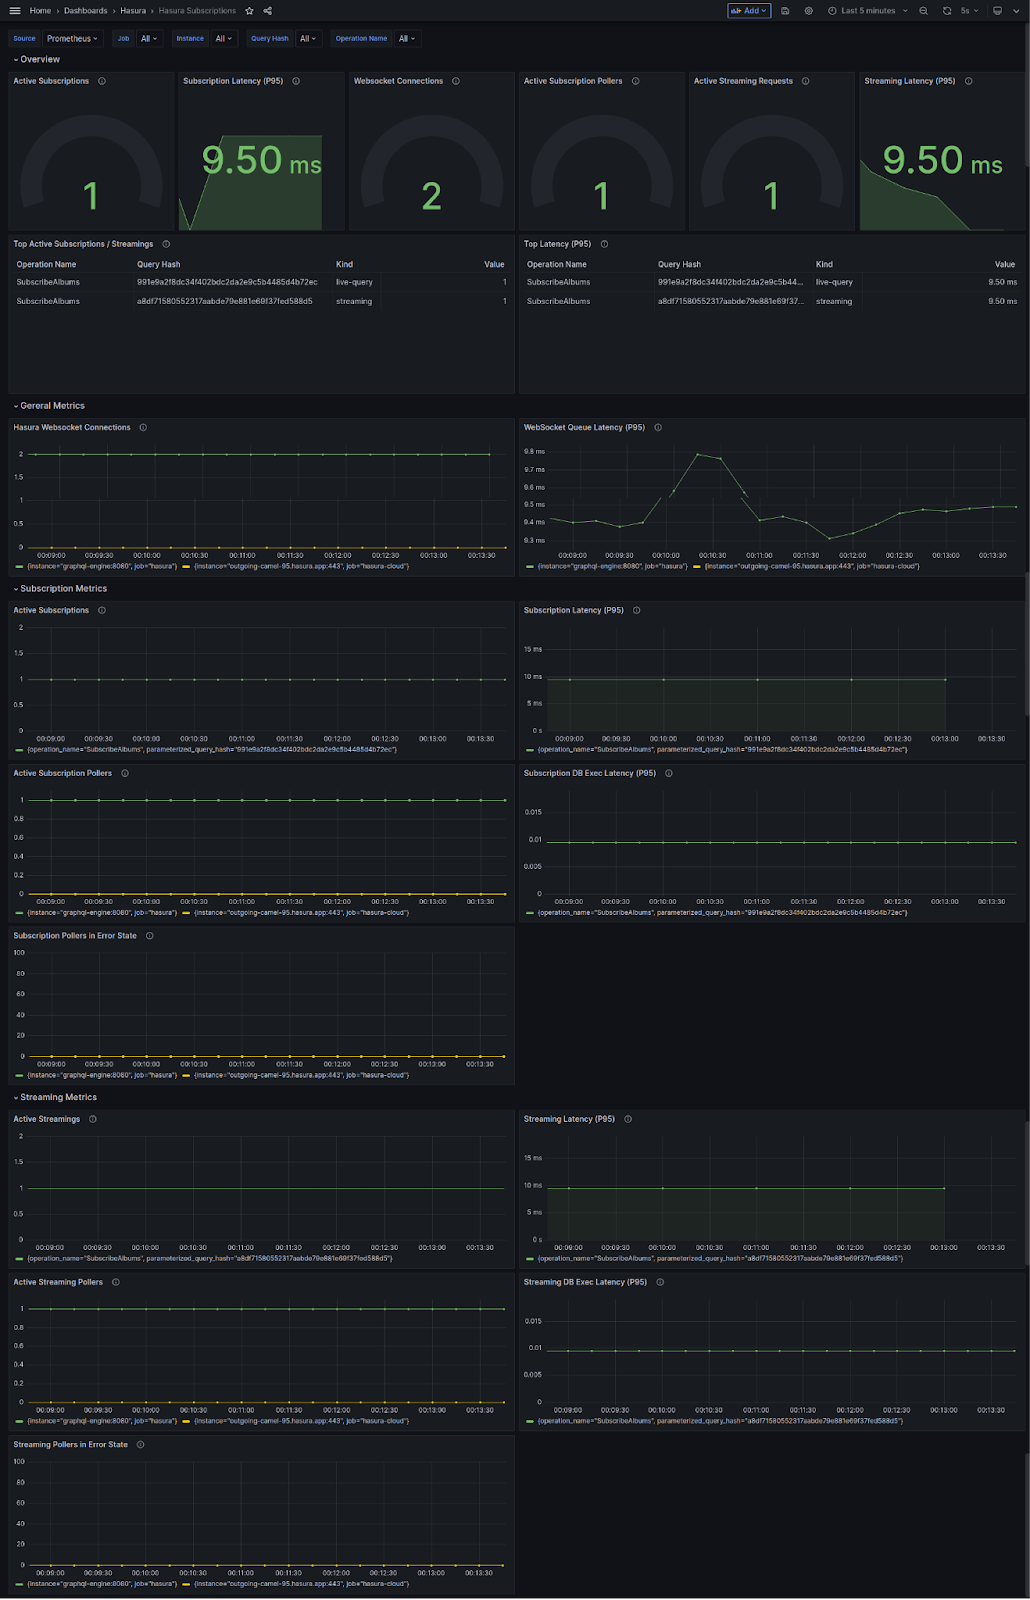
Hasura Subscriptions is a subscription specific dashboard giving you a detailed view of your subscription metrics. You can monitor the current active subscriptions, historical subscription information, websocket usage, latencies, and your subscription poller statistics.
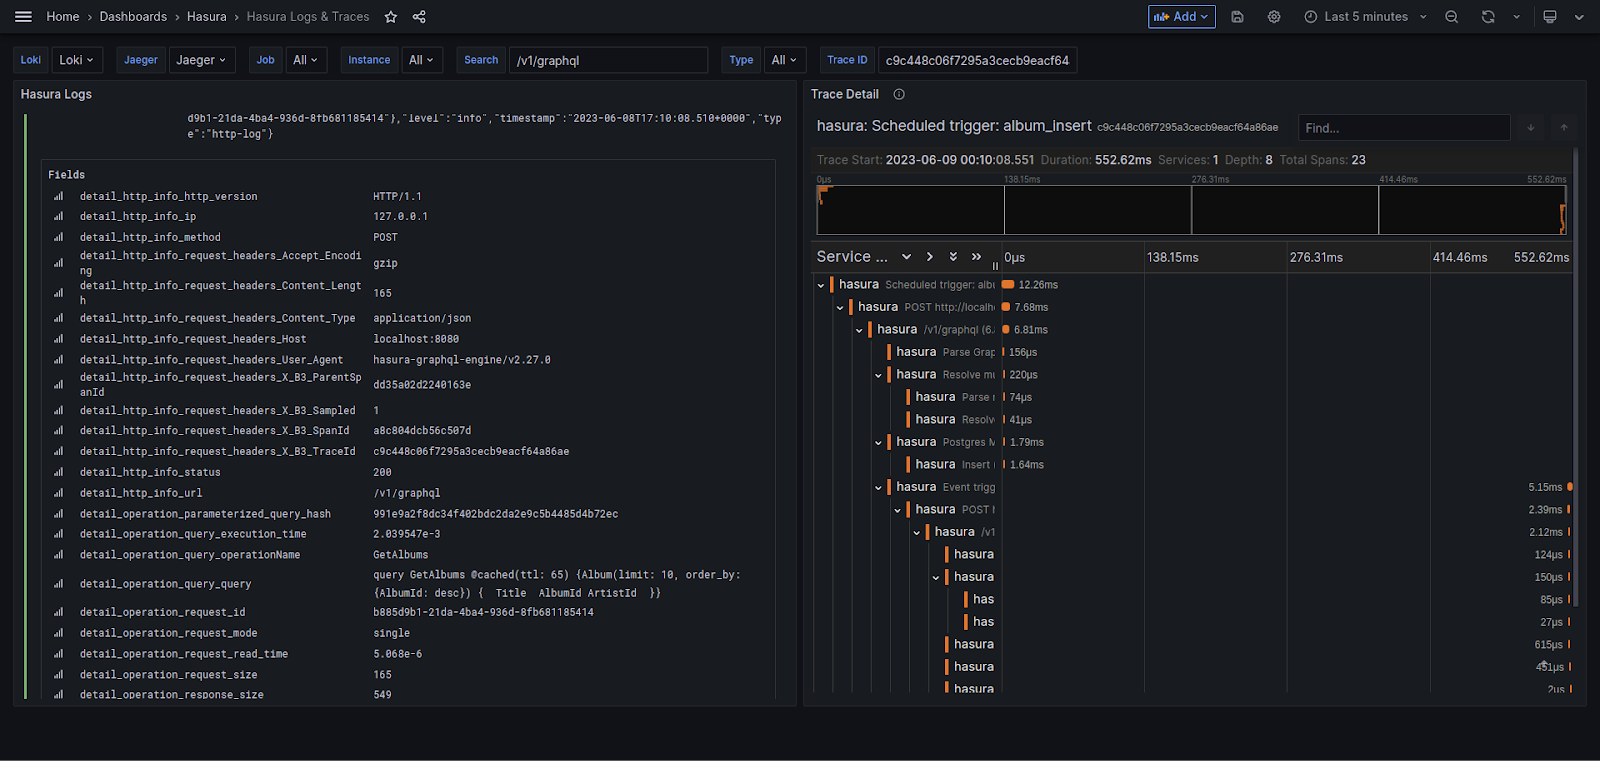
Hasura Logs and Traces: All logs generated by Hasura GraphQL Engine, and tracing information is available here. Trace information is available on the Jaeger web interface, too, which you can access using http://<your_deployment_address>:4002
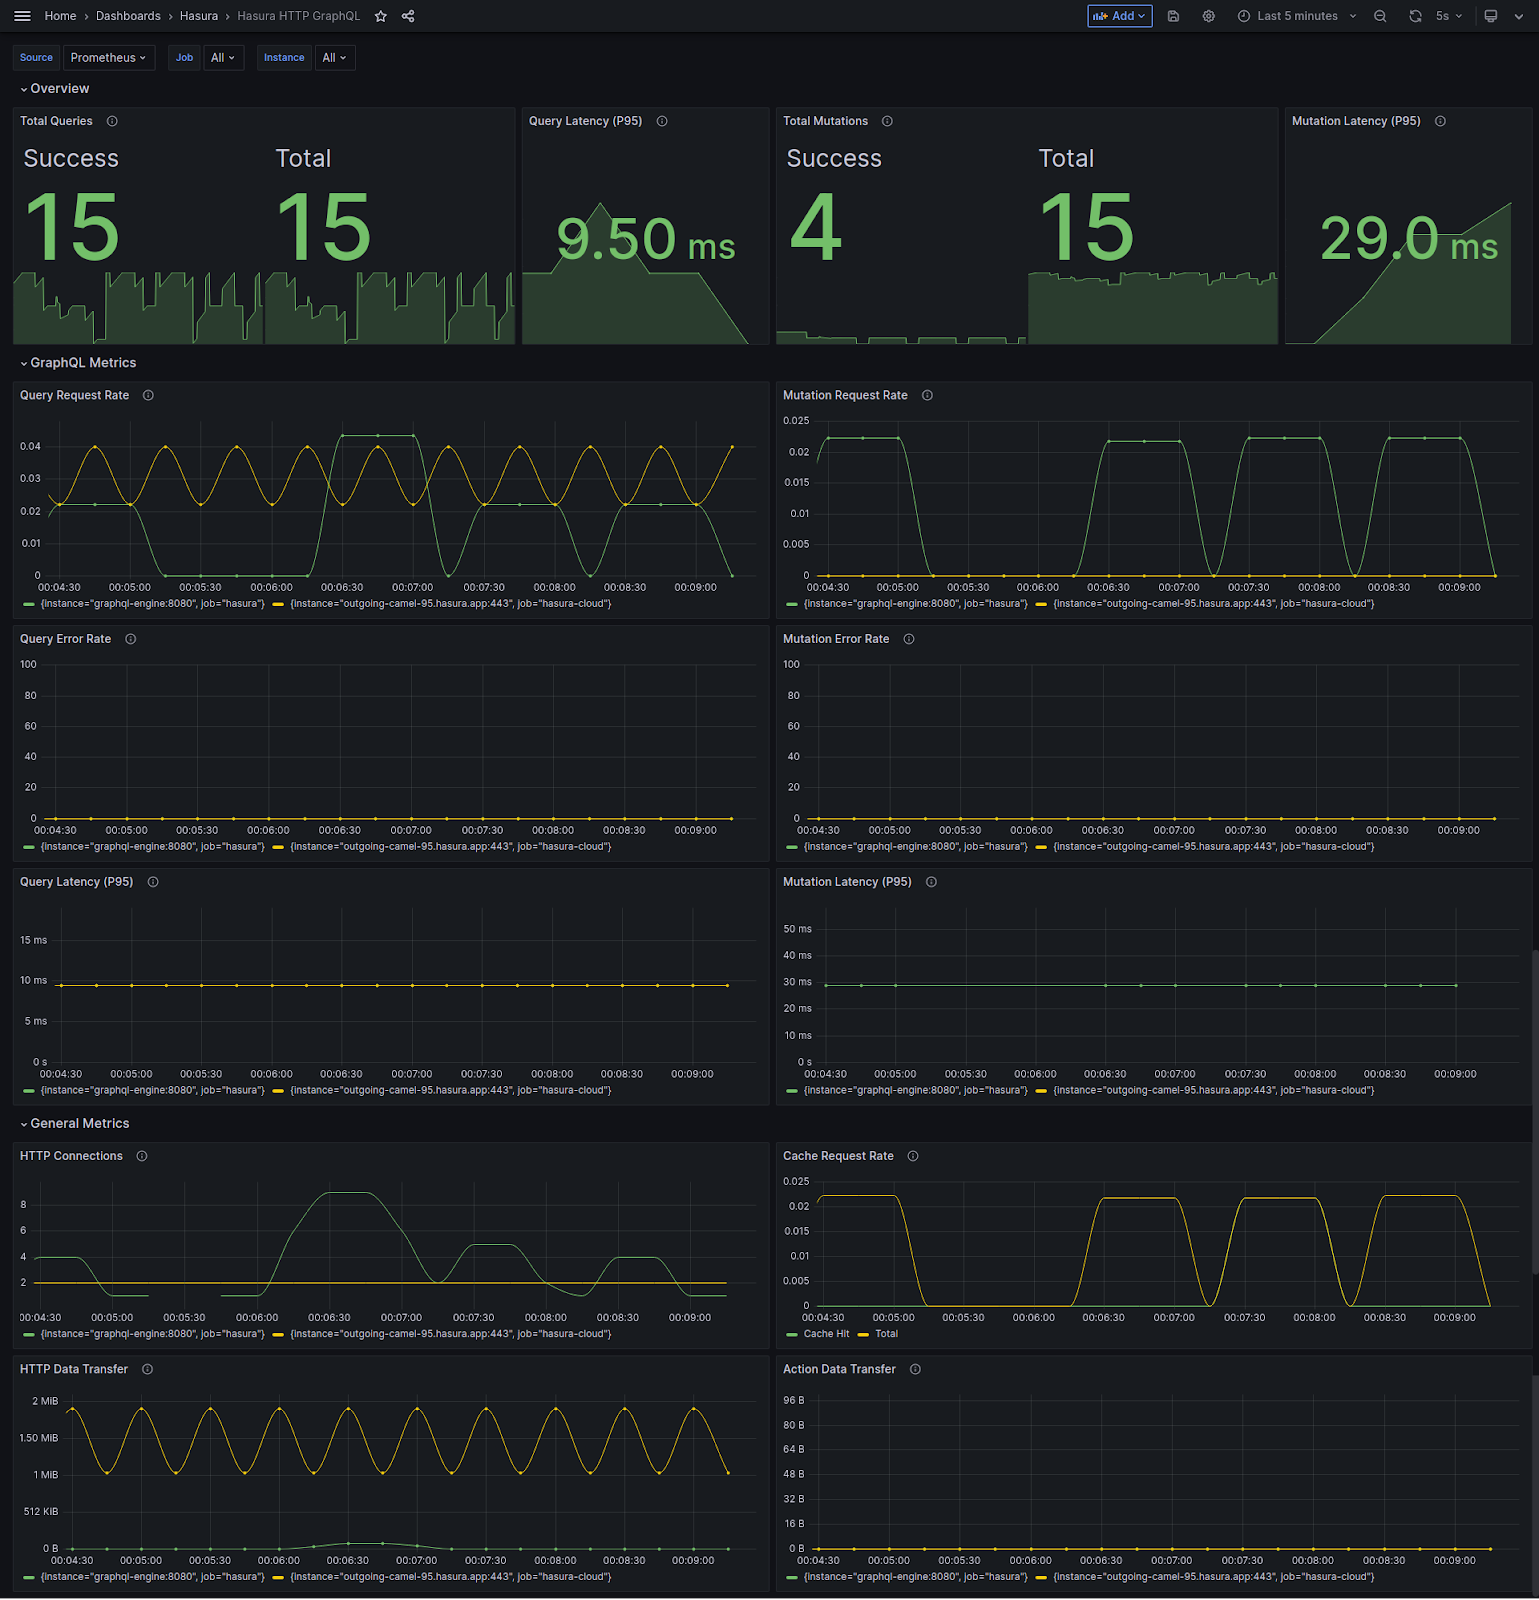
Hasura - HTTP GraphQL: Quick overview of your GraphQL metrics (including historical data) on your queries, mutations, HTTP connections and your cache metrics.
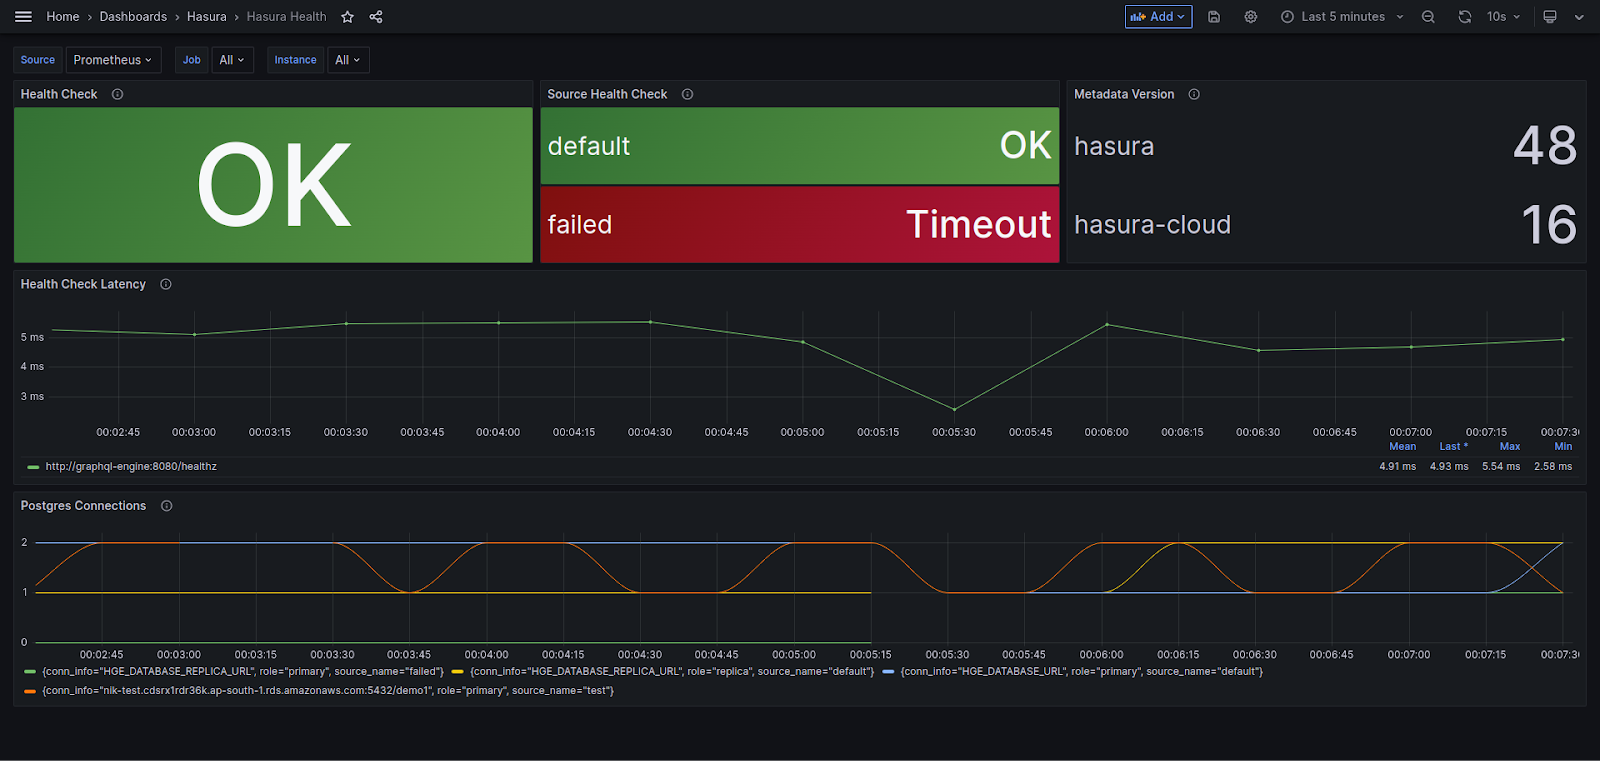
Hasura Health: Health information of your Hasura deployment including health-check stats for your data sources, and connections to your data sources.
Extending the Hasura observability stack
You are not limited by the dashboards we have provided or the components involved here. You are free to extend the functionality of this deployment to integrate with systems in your environment. For example, if you need Alert Manager to integrate with your enterprise IRP (Say PagerDuty), you can configure one of the many first-class integrations available. You can configure your own alerts using Grafana Expressions.
An example where we need to alert users if your GraphQL error rates increased by a certain percentage in the last five minutes can be created using the following Grafana expression
Set a severity level (INFO, WARNING, CRITICAL etc), create an error message for your alert
The error rate of GraphQL requests from your instance {{ $labels.instance }} exceeds {{ $value | humanizePercentage }}
``
And you are all set.
You can configure more alert-rules by going to the Alert Rules (The Hamburger menu on the left, expand, and go to Alerts).
Wrapping up our observability journey
As we've journeyed through the Hasura observability stack, I’m sure you will agree that it empowers you to proactively address issues, optimize user experiences, and confidently scale our application without being tied to a vendor, or an agent that you need to install – but do not know a lot about.
As the digital world continues to evolve, staying ahead of challenges is crucial, and with OpenTelemetry by our side, we're equipped to navigate the future. Thank you for joining us on this exploration, and here's to building more resilient, efficient, and user-friendly applications together! Happy observability, everyone.