Hasura & CockroachDB Easily Handle Thousands of Requests Per Second with Low CPU Utilization – Part 1
Hasura's core value is decimating the time to build a data API for GraphQL and REST and getting it production-ready. It does so by automating 50-80% of the manual effort into making production-ready APIs so that developers can focus on building differentiated products, not writing APIs.
Developers and architects are impressed with the productivity gains from using Hasura and how quickly one can spin up an API. But we still hear the common question, “Is a Hasura-generated API as fast, correct, and reliable as a handwritten API?” The answer is YES!
In fact, because of the optimizations Hasura does under the hood, Hasura-generated APIs are several times more performant than a handwritten API. In this blog series, you’ll learn about all the technical ways Hasura achieves blazing-fast APIs.
We’ll also share performance benchmarks for Hasura-generated APIs for CockroachDB. We benchmarked two sets of performance metrics:
Using standard benchmark datasets, we benchmark requests per second (RPS) and latencies (p50, p95) of Hasura-generated GraphQL APIs on CockroachDB.
How does a Hasura-generated API compare to a hand-crafted GraphQL API?
We will cover the RPS and latencies benchmark in this post. In Part 2, we will cover Hasura vs. DIY GraphQL APIs.
The following benchmarks show Hasura easily handles thousands of sustained requests per second on a single Kubernetes pod with considerable CPU to spare. The CockroachDB serverless cluster also plays a pivotal role in managing high concurrent traffic.
Requests per second benchmark on CockroachDB
We ran Hasura v2.20.1 on Kubernetes on a single pod for this benchmark. The pod configuration is 8 vCPU and 16 GB of RAM on the GCP asia-south1 (Mumbai, India) region, running against a serverless CockroachDB cluster on the cloud in asia-southeast1 (Singapore).
We used the open source load testing tool Locust for generating the benchmark load. The benchmark was done on the Chinook dataset. The Chinook dataset is widely used for its real-world relational data.
Query/Workload
Handled Requests/s
Median latency (ms)
(@ 100 concurrent users)
95th percentile latency (ms)
CPU utilization
Avg. response size (bytes)
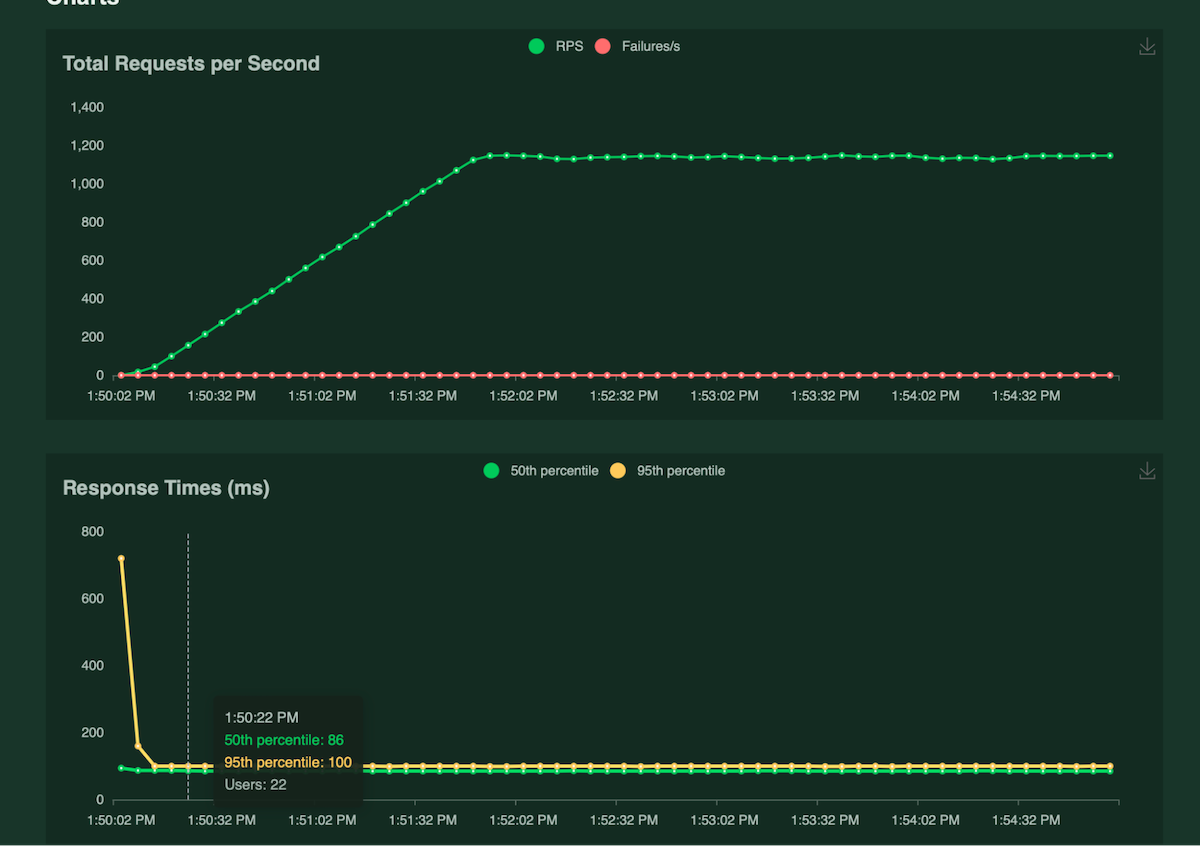
Primary Key query lookup
1200
85ms
100ms
8%
89 bytes
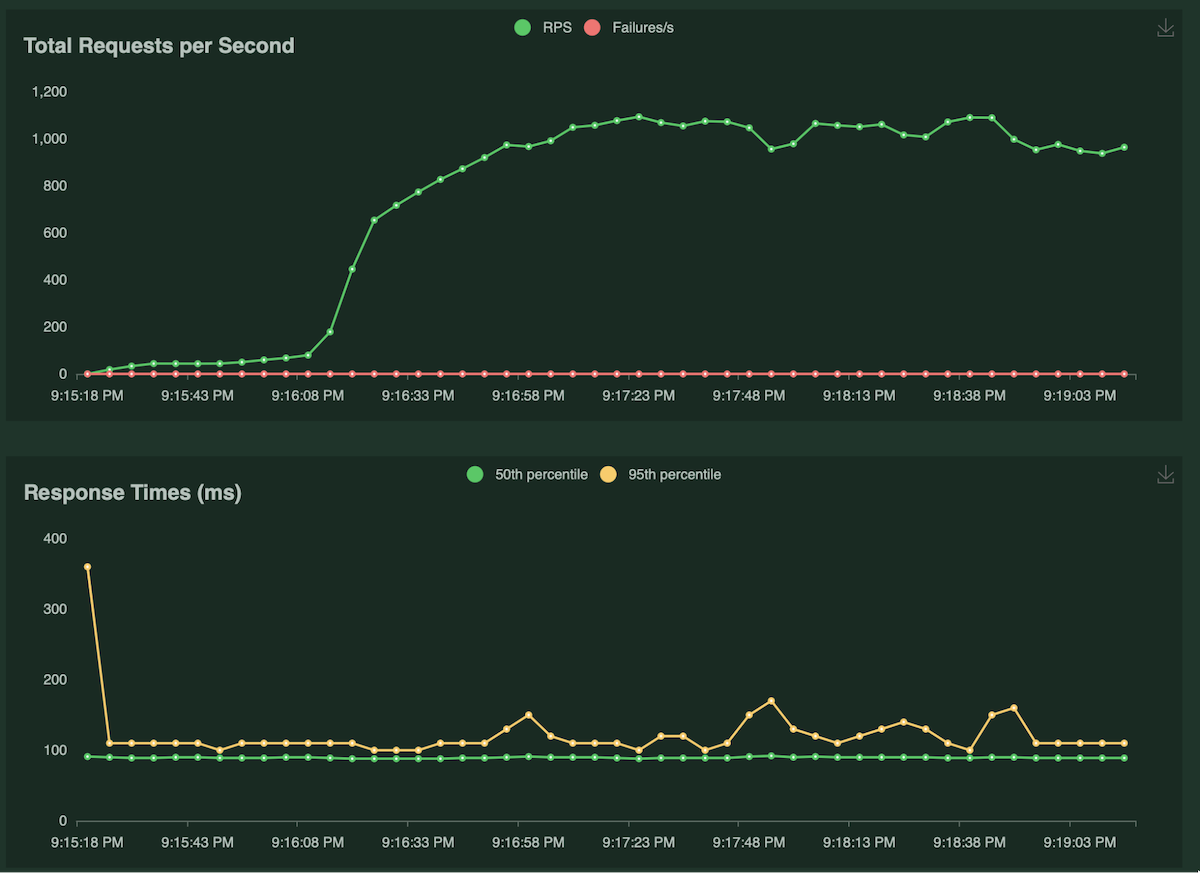
Limit query fetch
1000
89ms
120ms
10%
18KB
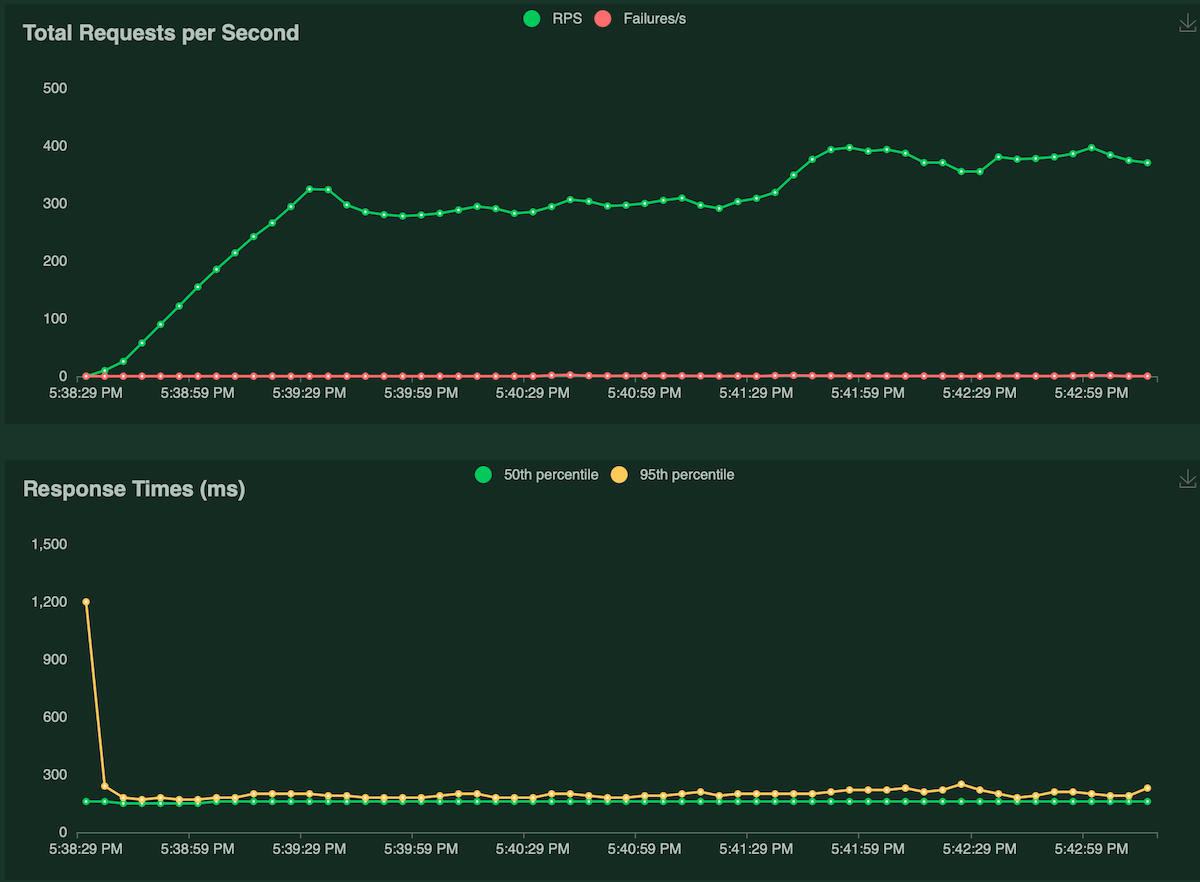
Complex join query fetch
302
160ms
200ms
10%
33.5KB
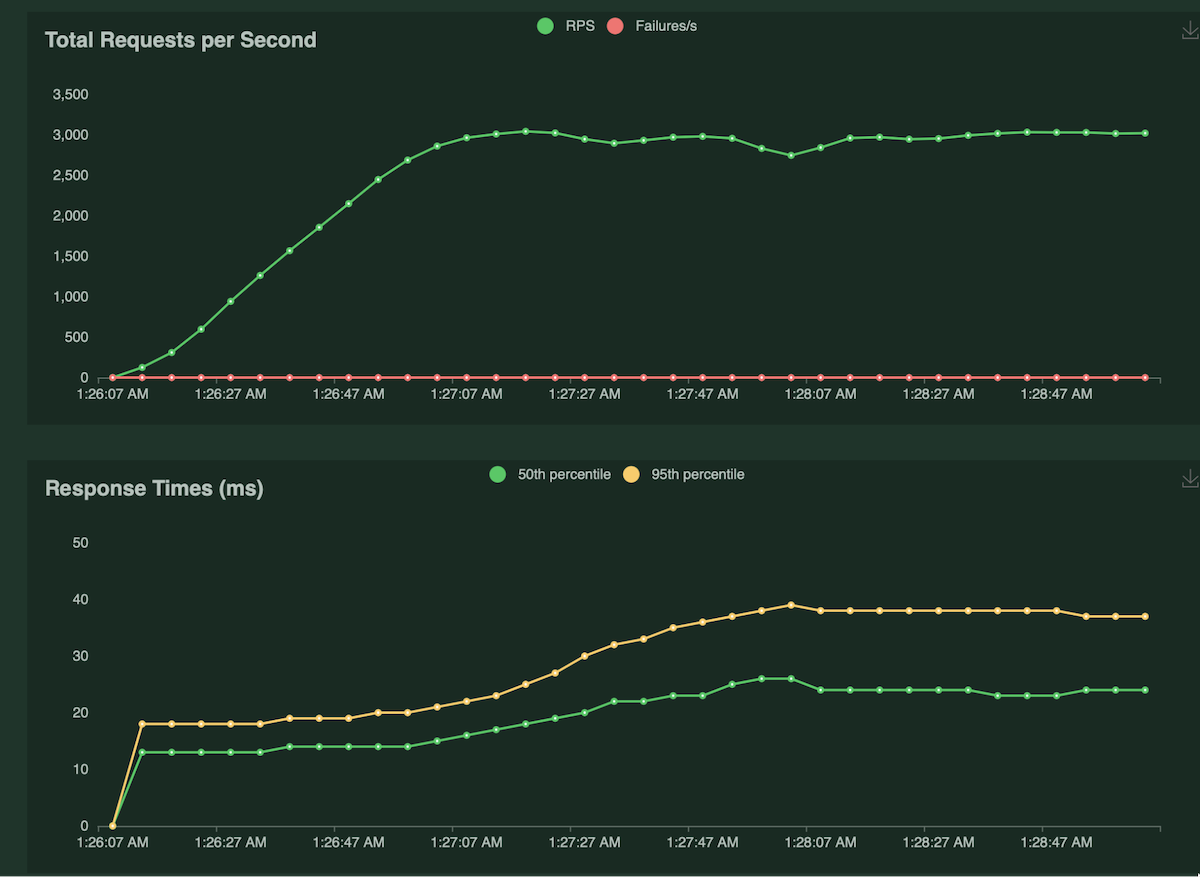
Insert mutation
2971
24ms
38ms
5%
105 bytes
Update mutation
2813
28ms
46ms
5%
105 bytes
Thanks to CockroachDB’s powerful index recommendation functionality, it recommended the creation of some missing indexes, which saw a 95% improvement of query performance.
As long as the underlying tables have the proper indexes and you are fetching only the required data, which Hasura helps with, you can handle a significant load on CockroachDB using just a single pod of Hasura.
Applied in the real world
For a big sale event, an e-commerce company wants to cater to 100k requests per second. How many instances of Hasura would it take to achieve that request volume?
Hasura achieves, on average, 1,658 requests per second at ~10% CPU utilization on mixed workloads. If we want to utilize ~80%,we can scale up to ~13,000 requests per pod. Thus, you can handle 100k requests per second in 8 pods or less, which can easily be auto-scaled using Kubernetes or any other container orchestrator.
CockroachDB Serverless is also a great choice of database, as it auto-scales based on load, which makes it an ideal partner for Hasura for highly concurrent workloads.
The serverless nature of both Hasura and CockroachDB saves time in both scaling systems and cost; instead of over-provisioning for peak load from the get-go, you can let CockroachDB/Hasura scale up only when required, and it scales back once the load subsides.
1. Primary Key Query Lookup
query{Album_by_pk(AlbumId:1){TitleAlbumId}}
A single Kubernetes pod achieved 1200 requests/s with median latencies of 85ms and 95th percentile of 100ms with 100 concurrent users. The CPU utilization was around ~8% at the peak, and the average response size was 89 bytes.
2. Limit Query Fetch
query{Album(limit:100){AlbumIdTitleArtistId}}
A single Kubernetes pod achieved 1000 requests/s with median latencies of 89ms and 95th percentile of 120ms with 100 concurrent users. The CPU utilization was around ~10% at the peak, and the average response size was 18 KB.
A single Kubernetes pod achieved 302 requests/s with median latencies of 160ms and 95th percentile of 200ms with 100 concurrent users. The CPU utilization was around ~12% at the peak, and the average response size was 33.5 KB.
The reason for higher latencies is that the query joins with two additional tables and fetching ~33.5 KB data per query, which resulted in a drop in RPS for this benchmark.
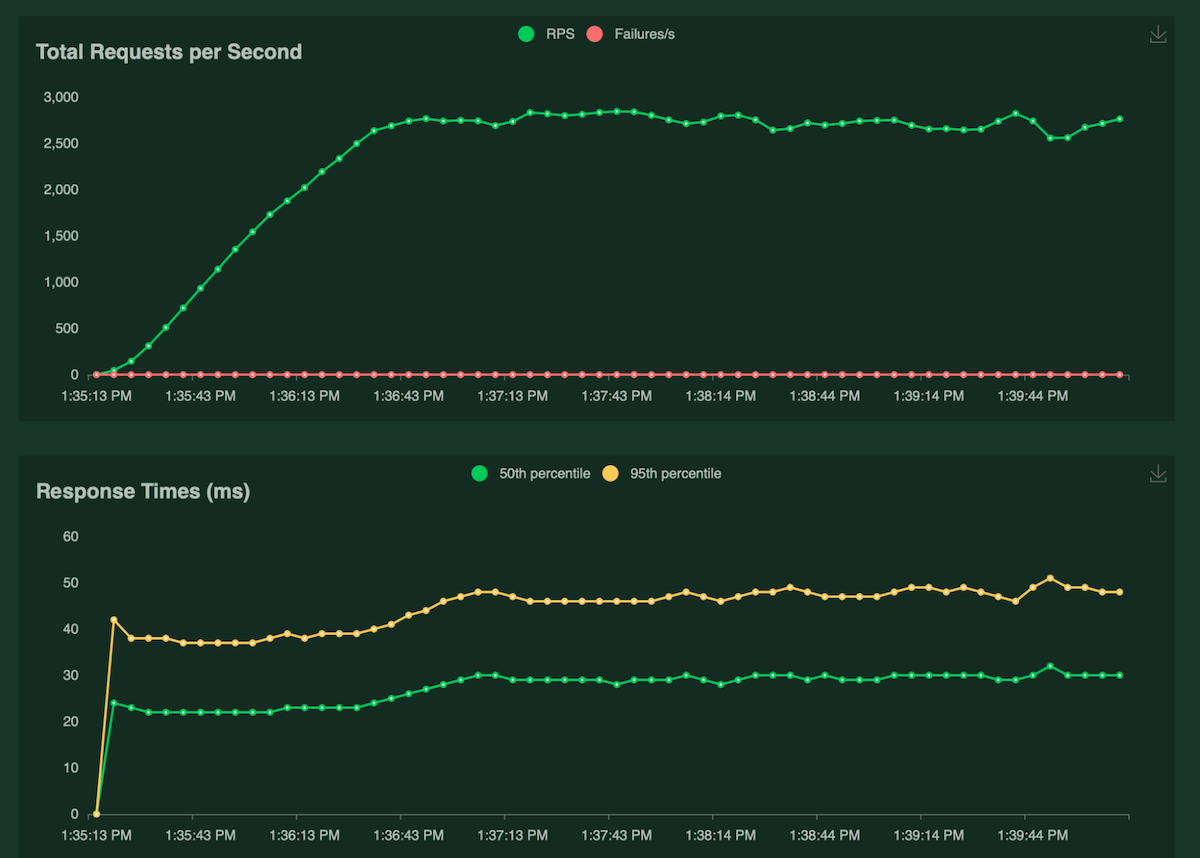
A single Kubernetes pod achieved 2971 requests/s with median latencies of 24ms and 95th percentile of 38ms with 100 concurrent users. The CPU utilization was around ~5% at the peak, and the average response size was 105 bytes.
5. Update Mutation
mutation{update_Album_by_pk(pk_columns:{AlbumId:1000}_set:{Title:"Trying now 1"}){TitleAlbumId}}
A single Kubernetes pod achieved 2813 requests/s with median latencies of 28ms and 95th percentile of 46ms with 100 concurrent users. The CPU utilization was around ~5% at the peak, and the average response size was 105 bytes.
Conclusion
As observed in this post, Hasura easily handles thousands of sustained requests per second with very low CPU utilization and latency. Also, all the underlying queries were generated by Hasura based on GraphQL requests, making the results even more impressive.
Got questions or want to see the API performance in action? Reach out to the team to schedule some time, and stay tuned for Part 2 of this series.