Hasura helps you monitor what matters so that you can optimize your apps, products, and services with precision. With our monitoring tooling sitting in the same infrastructure as the metal running your apps, there's no truer source of metrics than what you can find in your console. Monitoring can also be scoped to specific contributor roles so that an architect or business operations account would only be able to access the monitoring tab and not the underlying API settings or data.
In this post, we'll do a breakdown the different monitoring sections of the Hasura console.
Overview
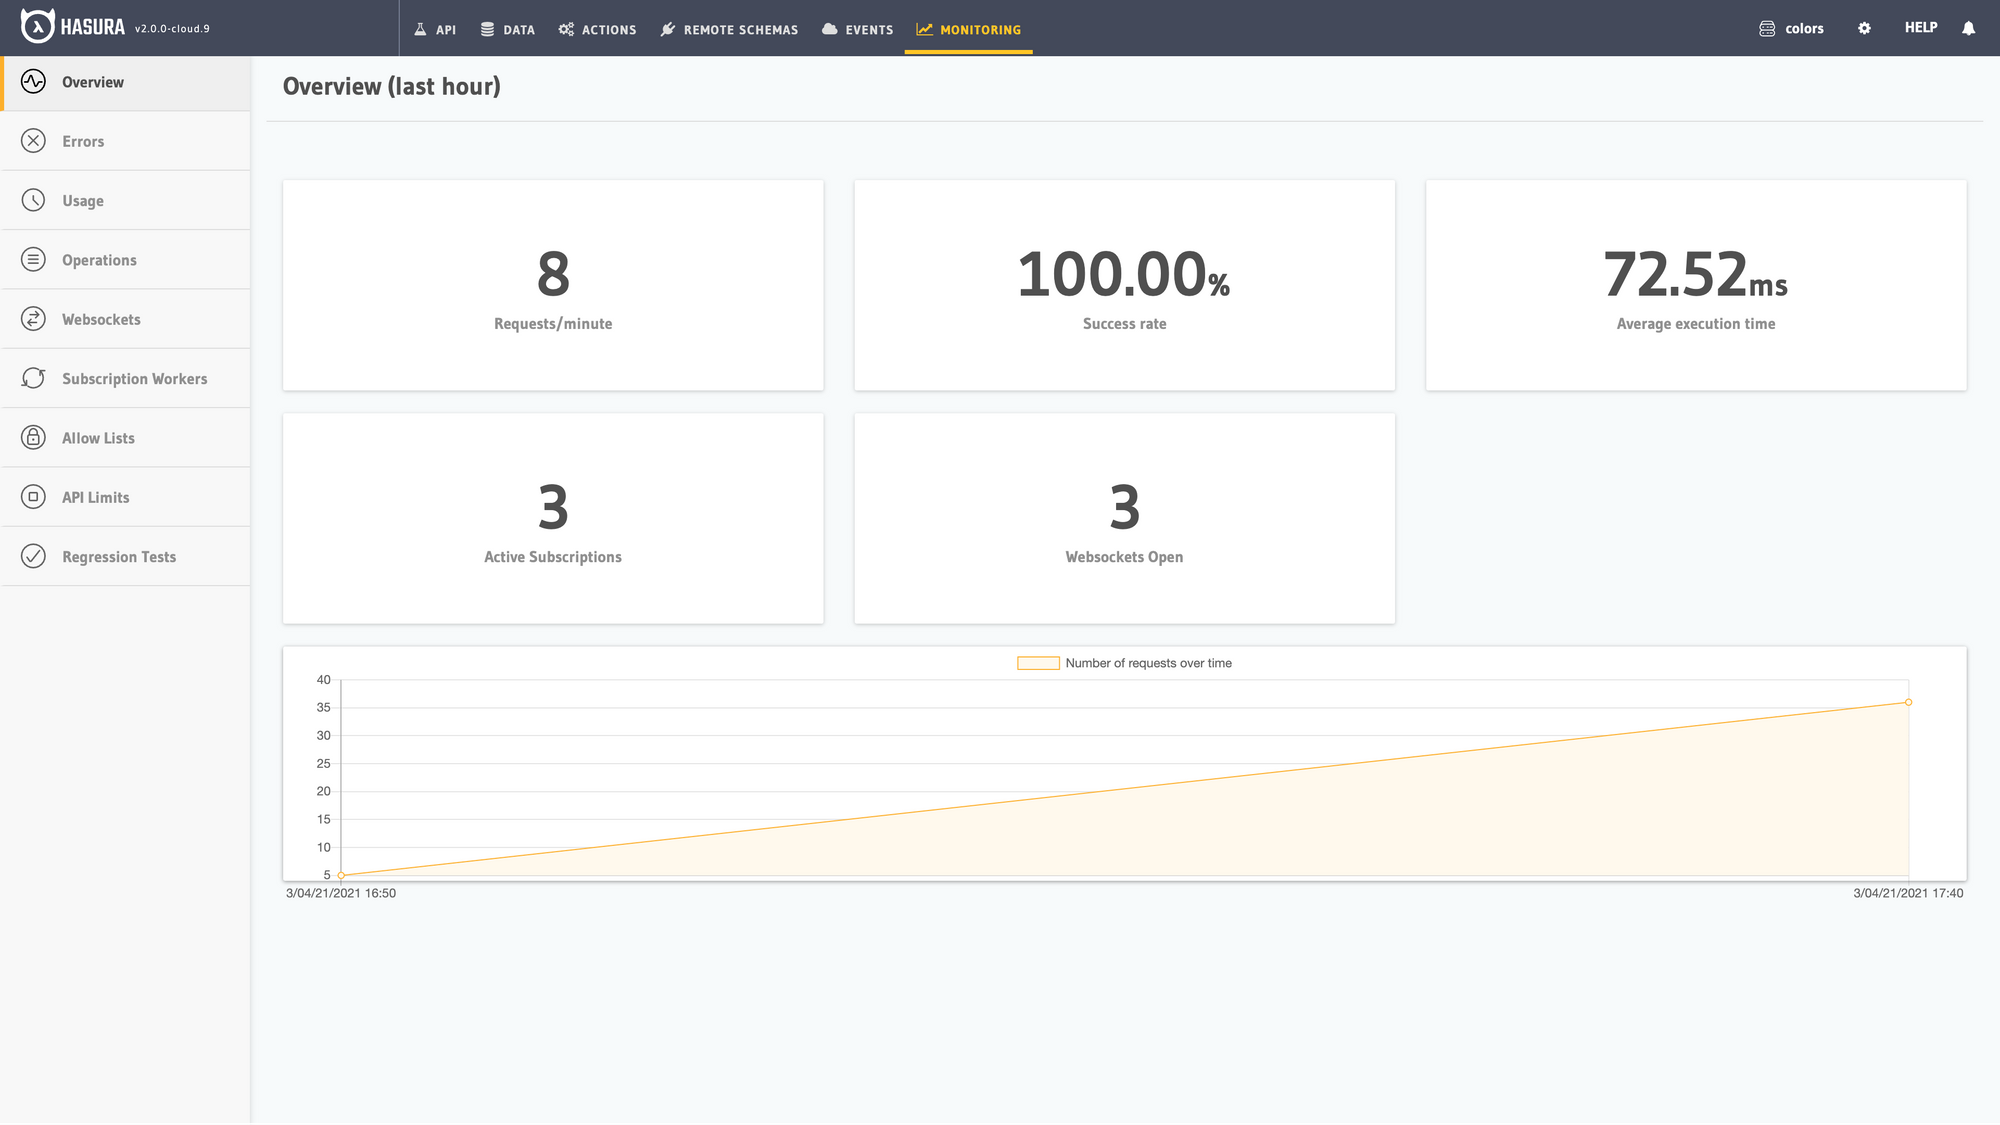
Overview, as the name describes, shows you the general averages of your API. Requests per minute, success rate, average execution time, active subscriptions and number of open websockets (the primary protocol used for subscriptions at the time of writing.) Lastly, it graphs the results so you can can quickly spot spikes and valleys for a more complete picture of your data.
Overview Tab
Errors
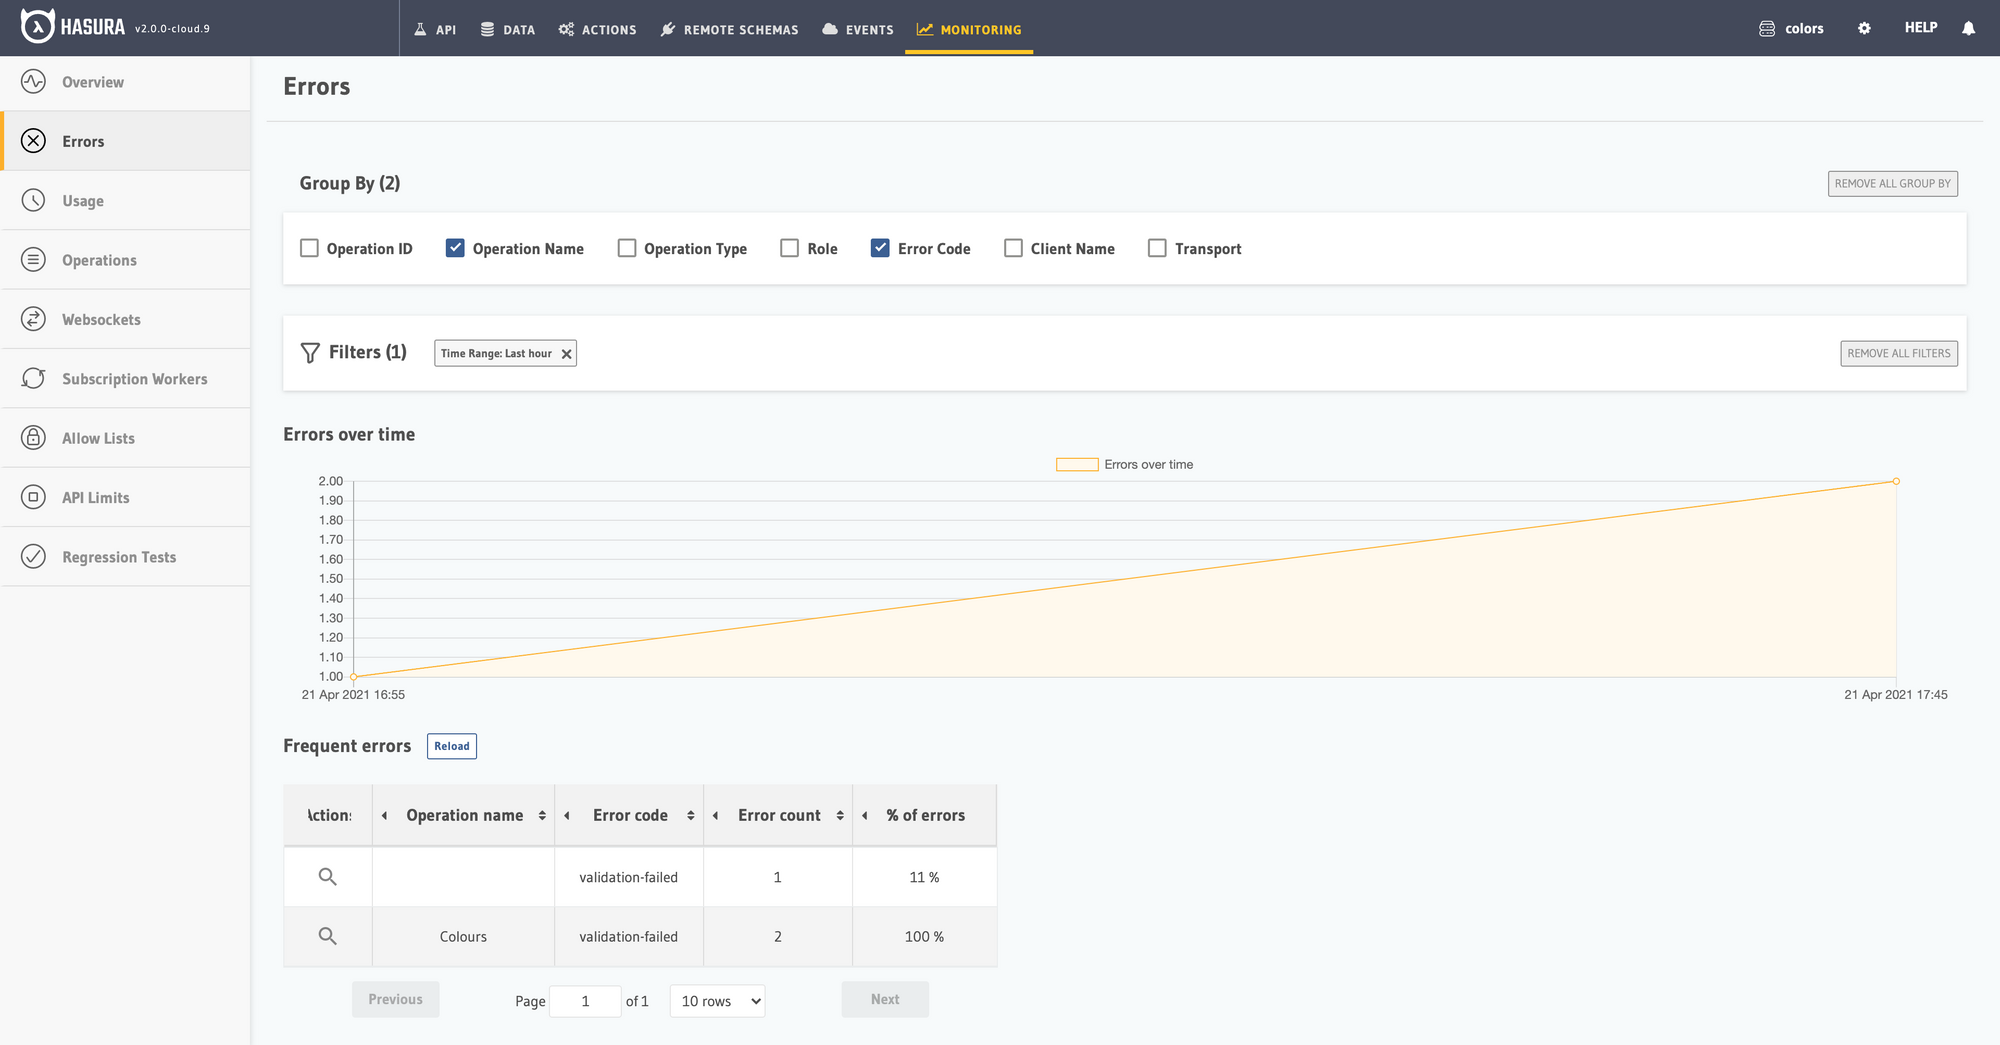
Errors are a consolidated view of the specific errors in your project. They are additionally grouped by most common errors in the window at the bottom of the screen.
Errors Tab
Usage
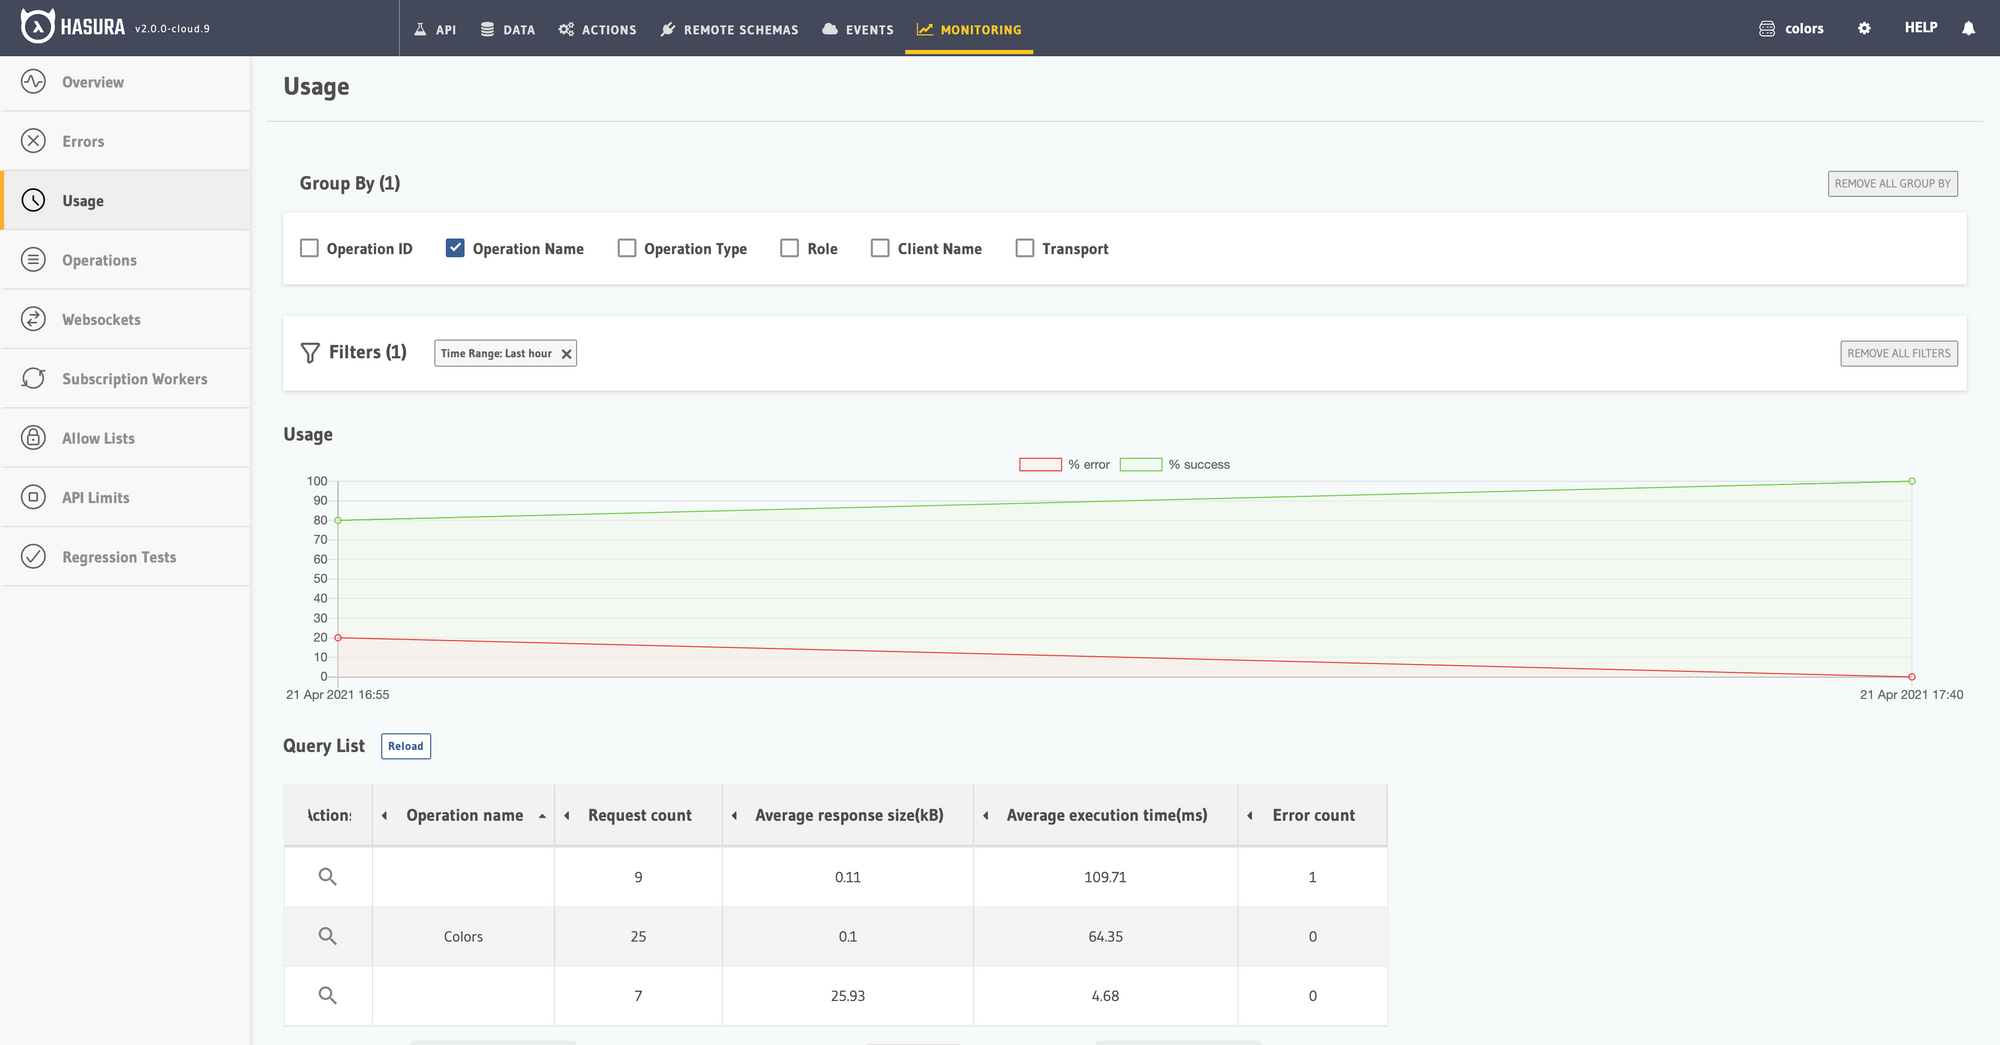
Usage shows you the entire application usage metrics from the frequency of particular operations, the response size, execution time, and more.
Usage Tab
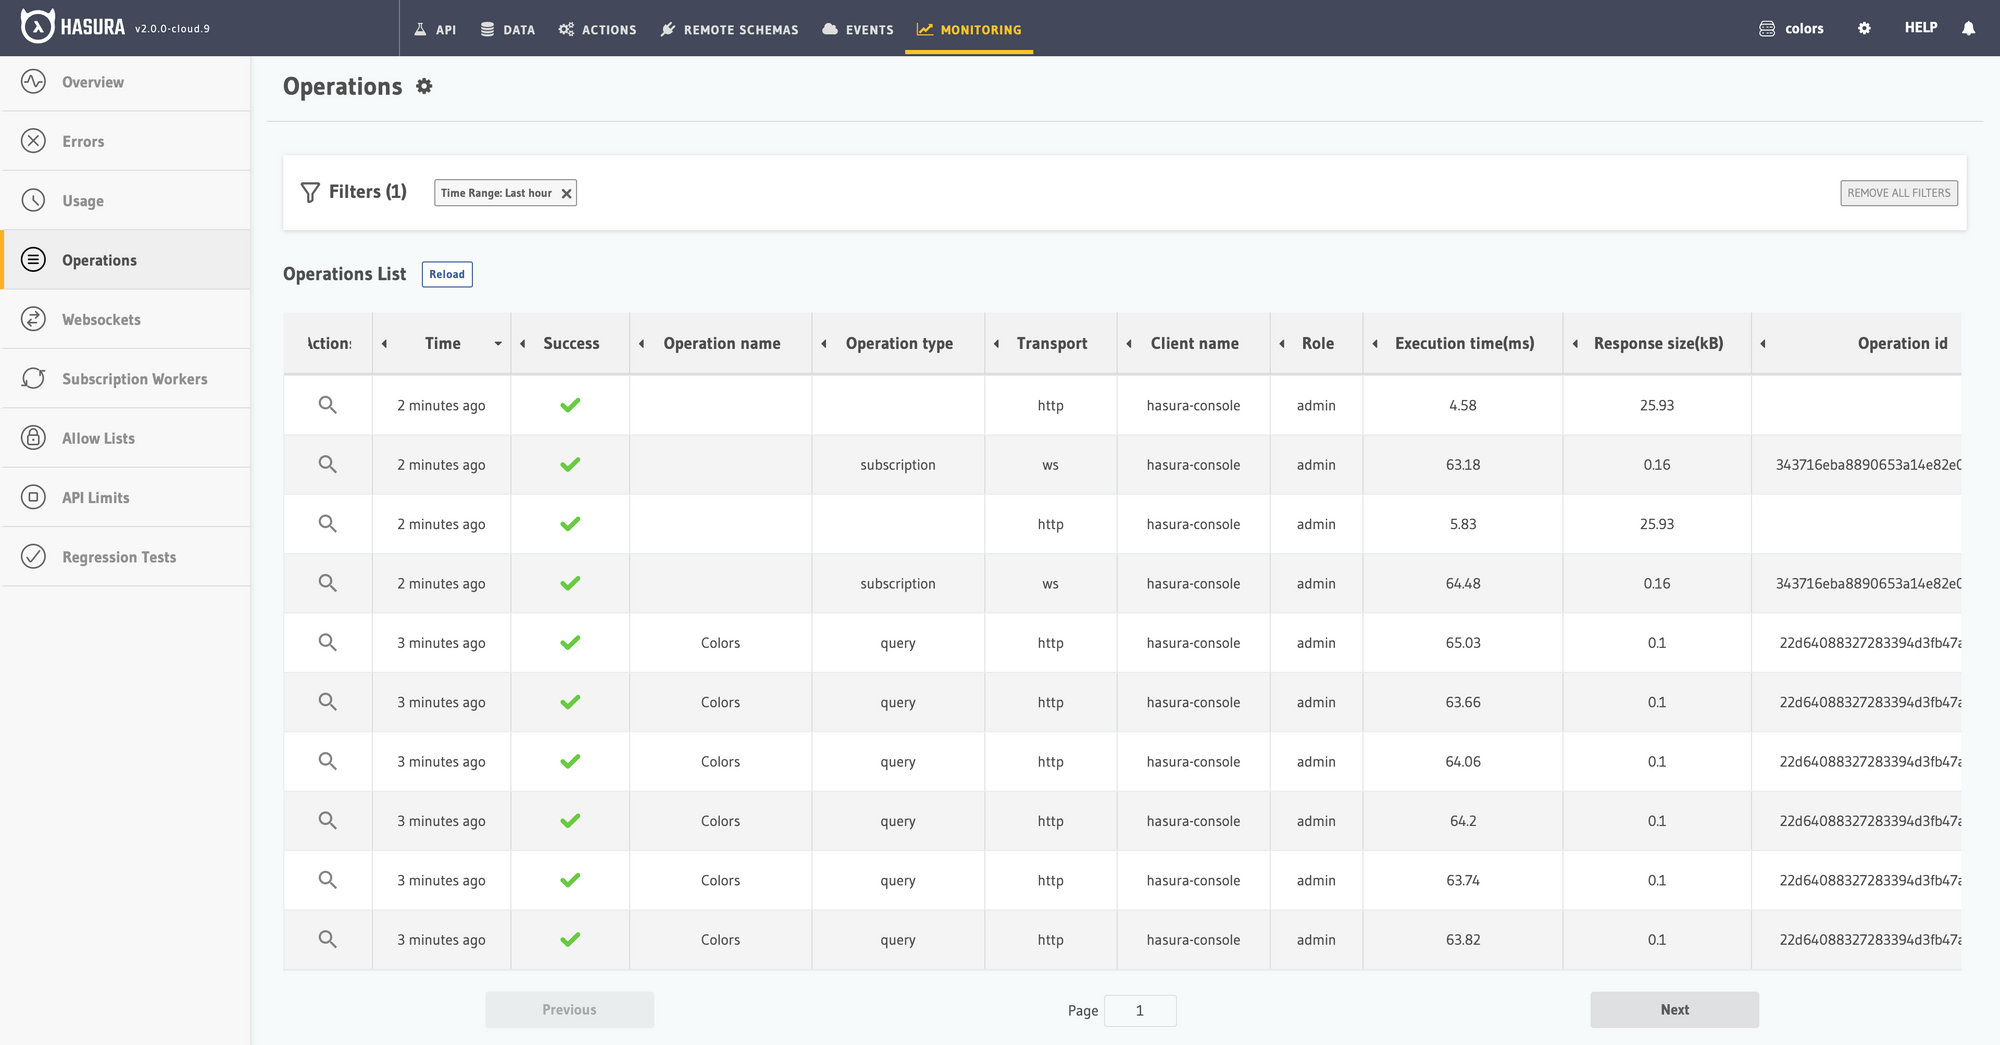
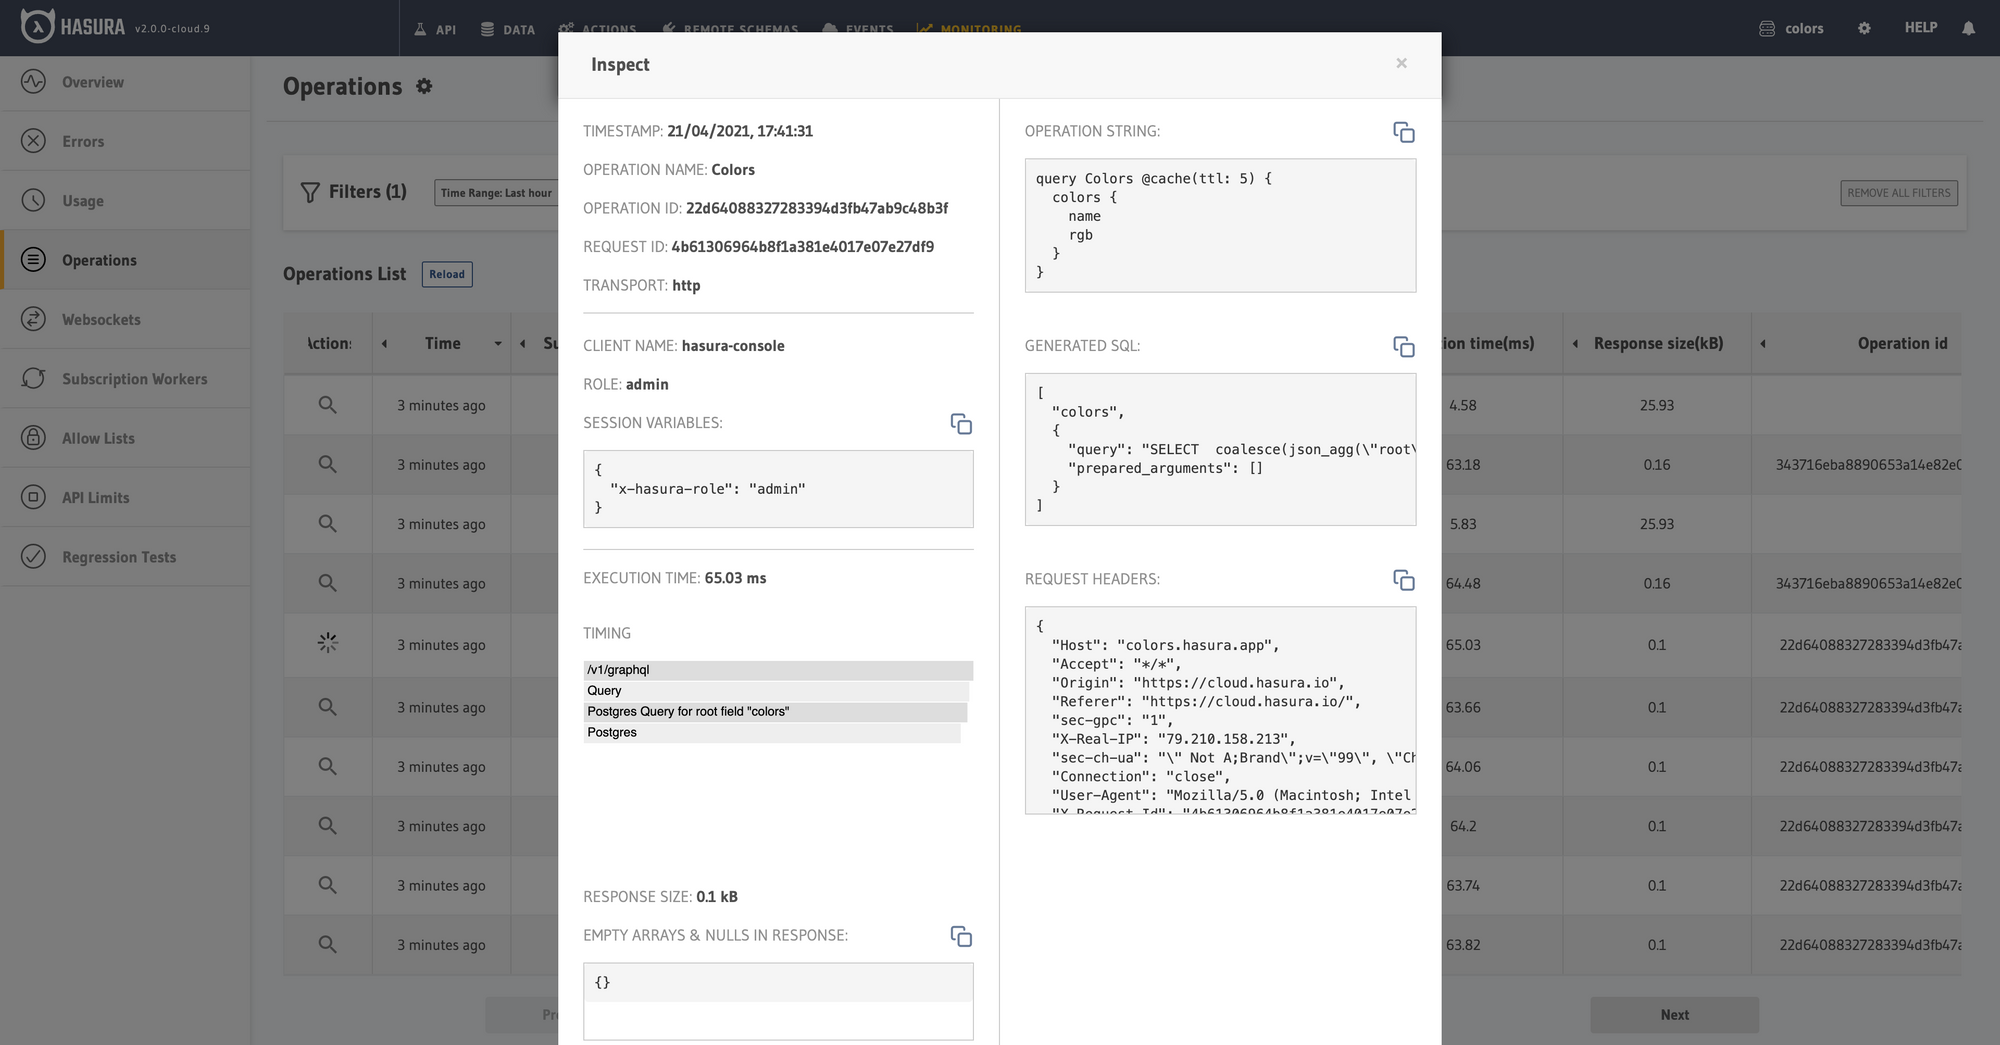
Operations
Drilling down on more details under errors or usage queries, will lead you to the top-level overview of operations. Operations show you every request coming into Hasura as well as the ability to inspect all parts of the request. Further, you can enable logging query variables and display when null/empty values were returned from the database.
Operations TabOperation inspect view
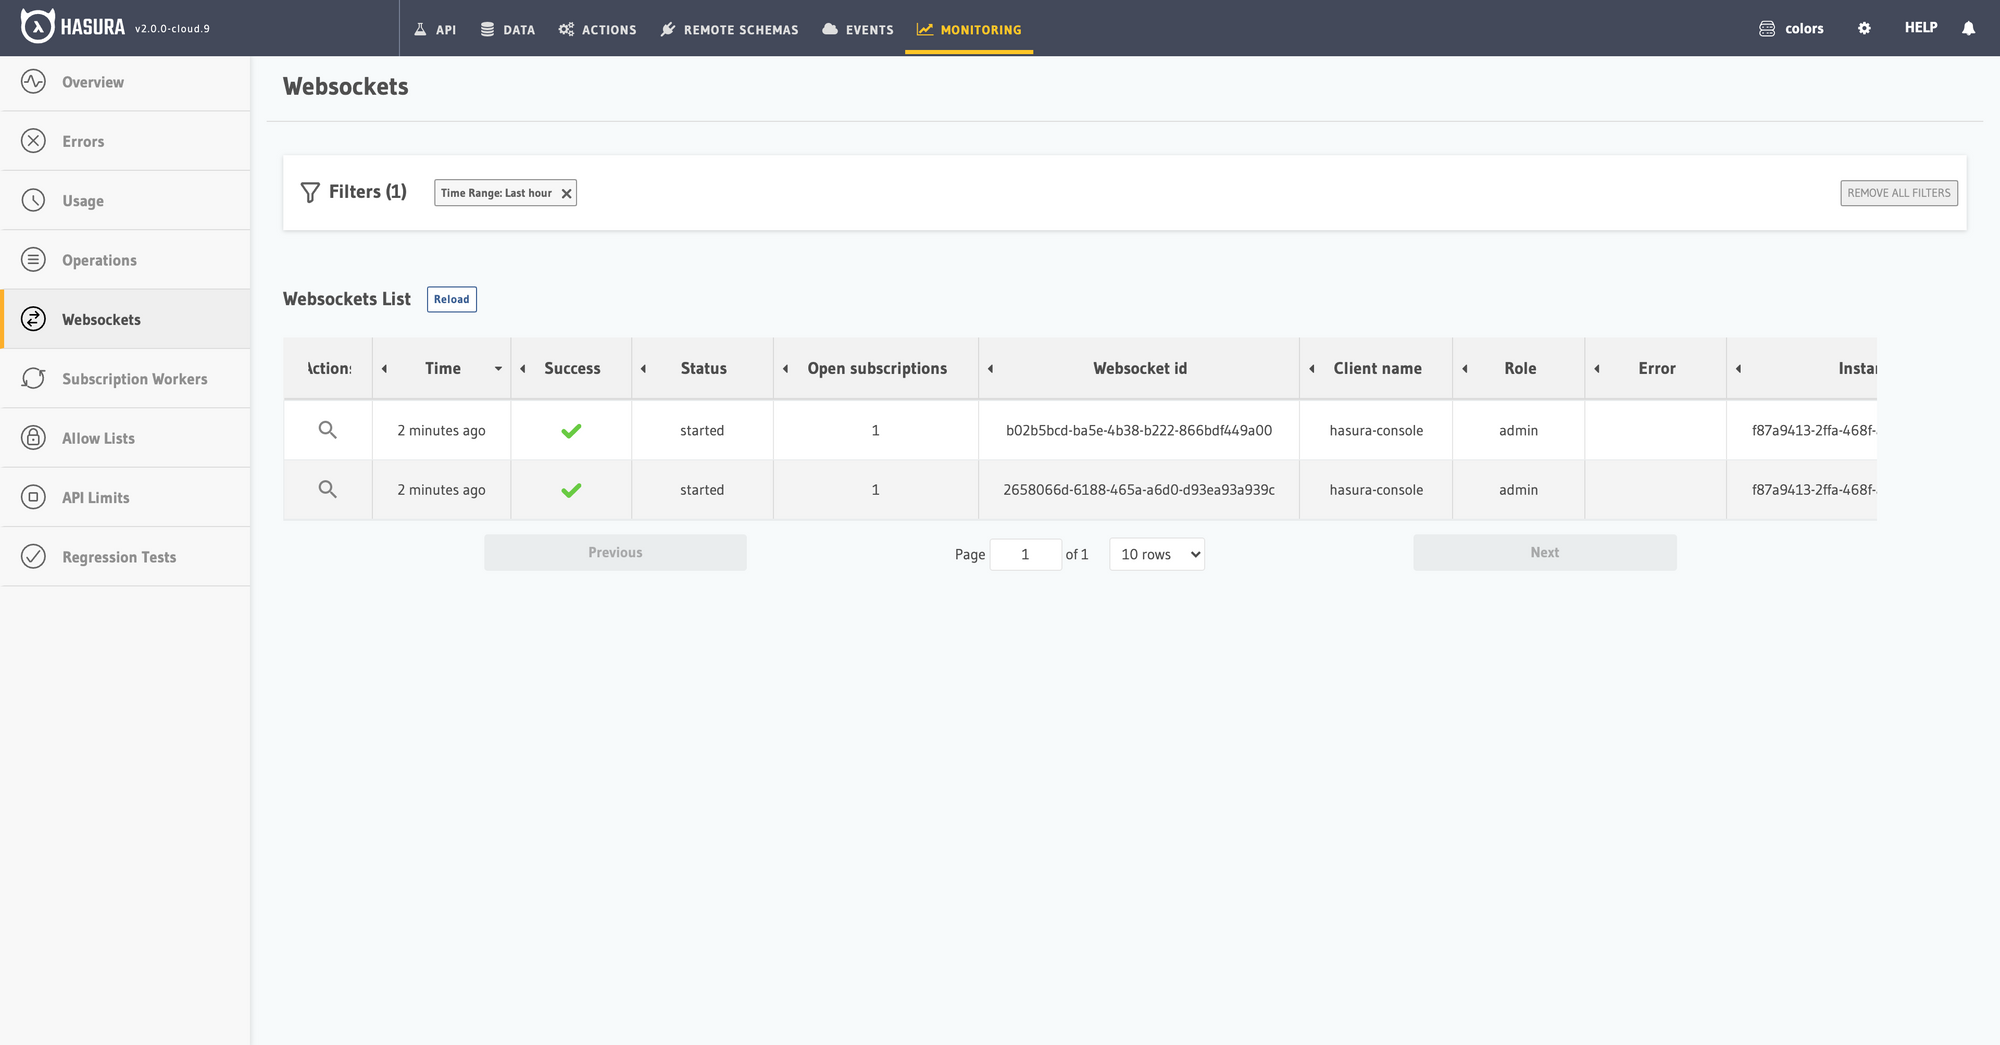
Websockets
Websockets show you the active, concurrent, websocket connections to Hasura. You can see if any clients are running unusually long, their health metrics, and how well they are performing.
Websockets Tab
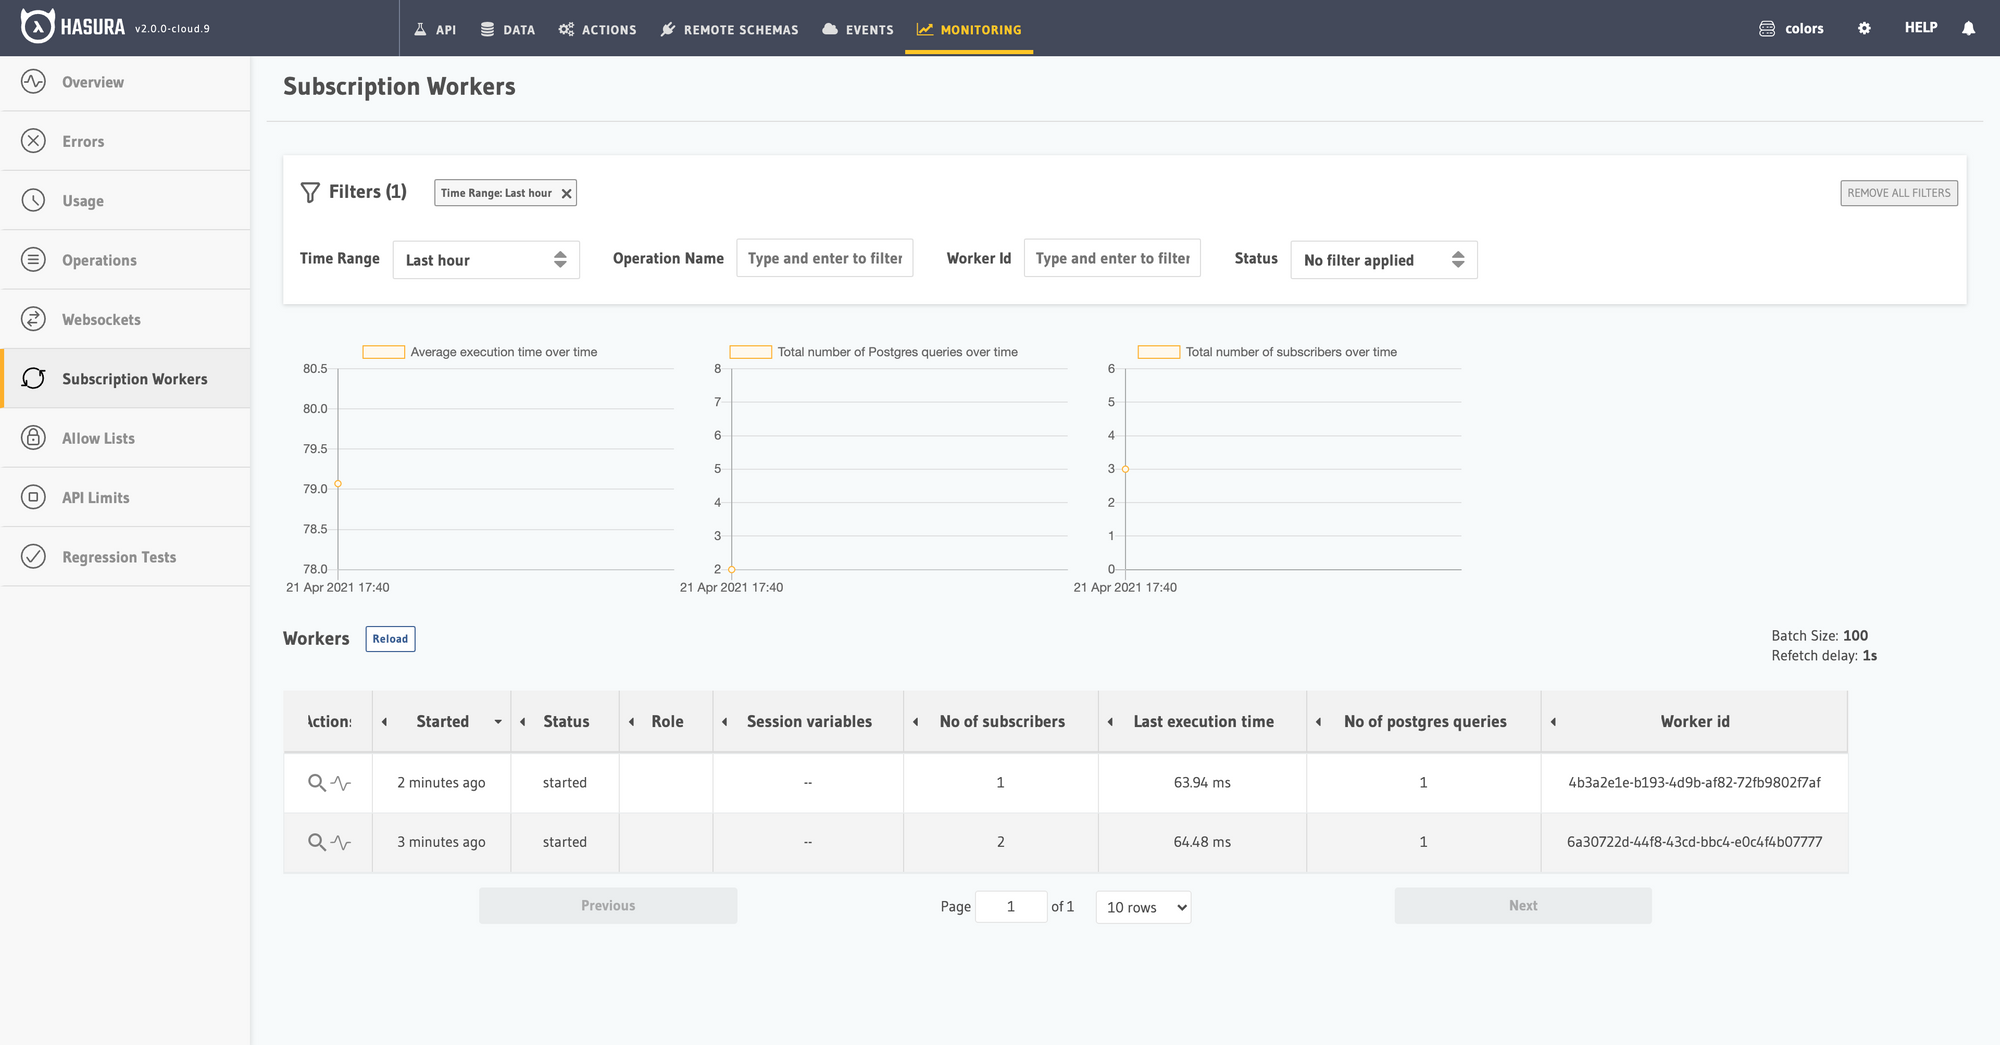
Subscription workers
Subscriptions are the other half of the websocket analysis as these two are typically bundled together. Subscription workers show you what is being queried, what the responses are, the payload size, and again how many workers are currently running.
Subscriptions Tab
You can view the monitoring tab walk through in this attached video.