Using OpenTelemetry Traces to observe your Hasura-powered applications
In our previous post, we talked about the importance of observability, the three pillars of observability, and an overview of how to use logs, metrics, and traces emitted by Hasura to monitor, troubleshoot, and diagnose your application.
In this blog post, we’ll talk more about how you can use traces exported in the OpenTelemetry format to the observability tool of your choice from Hasura Cloud and Hasura Enterprise.
What are traces and why are they important?
To recap, traces are used to find where the problem is in your application and provide end-to-end visibility into a system’s operations by tracing requests through all the different services. Traces can show how a system is functioning, identify bottlenecks, and improve performance. A span is an operation that represents a part of the workflow.
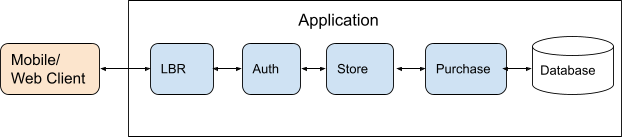
For example, in an e-commerce application, we have three services – Auth, Store, and Purchase – that help users of mobile or web clients make a purchase.
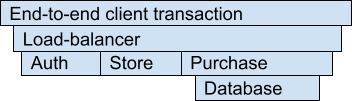
A trace shows the end-to-end workflow and is typically represented by a flame graph as shown below:
Each individual operation (e.g., on the Auth/Store services) represents a span.
Since Hasura acts as a central gateway for your application stack, it's imperative that we provide traces to analyze the performance of GraphQL queries, mutations, and subscriptions and their interactions with data sources.
For example: If the database span (the leaf node of the trace) of the trace takes too long, we can consider adding an index to the table or cache the response using the @cached annotation. If the second to last span is large, there is high latency between Hasura and the database, so bringing them close geographically is a good option.
Traces and OpenTelemetry
OpenTelemetry is a CNCF incubating project and provides a free, open source, and vendor-neutral collection of tools, APIs, and SDKs for telemetry data. OpenTelemetry is adopted and supported by industry leaders in the observability space.
To use tracing in your observability stack, you need to instrument your applications via OpenTelemetry libraries and use observability tools like DataDog, New Relic, Dynatrace, and Sumo Logic to analyze and monitor traces. Hasura is committed to open source and open standards, and therefore we have instrumented code for API queries, mutations, and subscriptions with traces for our Cloud and Enterprise products in the OpenTelemetry format that you can then export to the observability tool of your choice.
How do I get started?
To get started, you should first determine how your observability tool expects OpenTelemetry traces. It may either provide an out of the box endpoint (e.g., Dynatrace, New Relic, Sumo Logic), or you may have to set up the OpenTelemetry collector with the appropriate exporter.
Once you have determined how you are going to ingest traces, the next step is to simply configure Hasura to send traces to the OTLP endpoint.
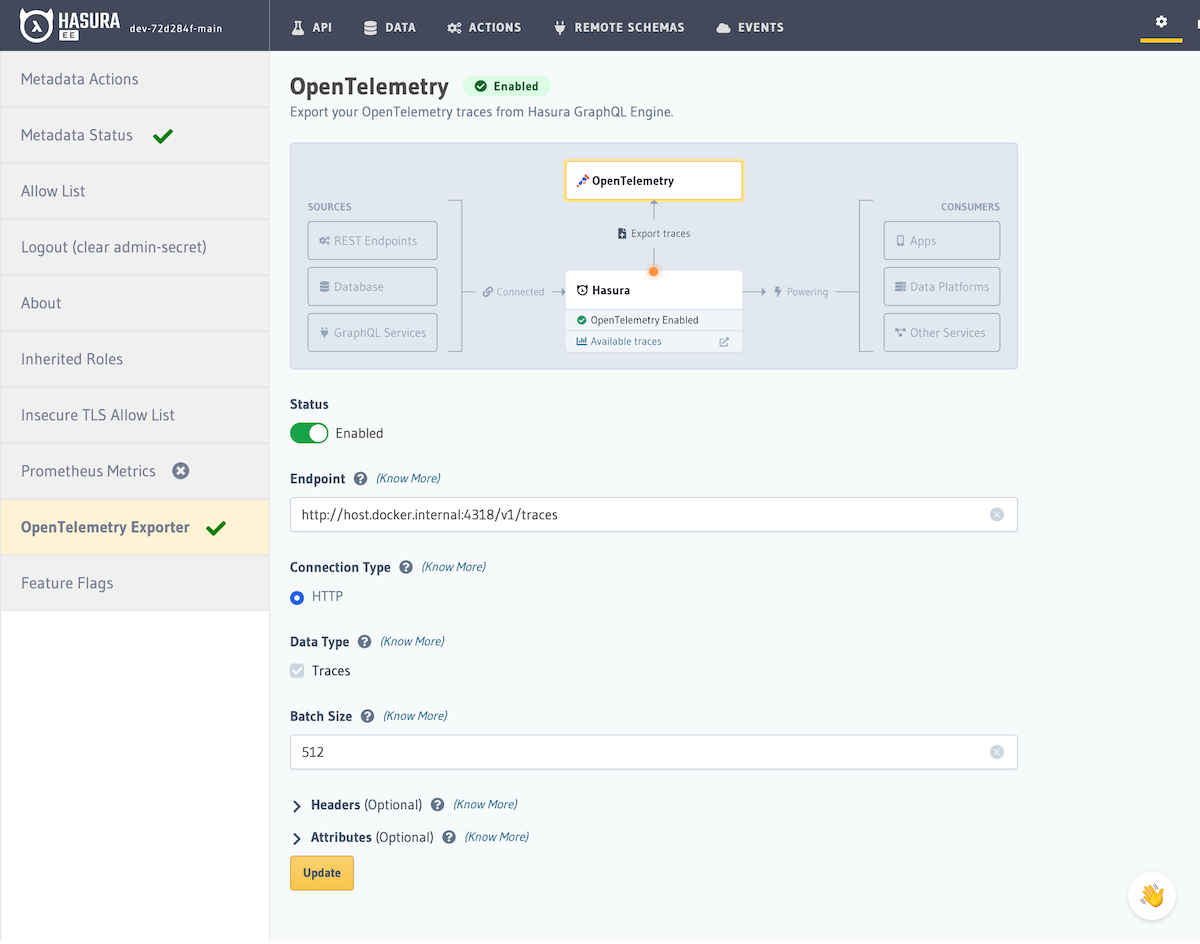
For example, if you would like to export traces from Hasura Enterprise, in the Hasura console, you can navigate to your Settings → OpenTelemetry Exporter and then configure how to set up your OpenTelemetry compliant receiver endpoint.
The key fields in this form are:
The Endpoint URL:The endpoint exposed by the OpenTelemetry collector or the OTLP endpoint of your observability tool.
Connection Protocol:HTTP is supported for Hasura Enterprise, and both gRPC and HTTP are supported for Hasura Cloud.
Data Type:We support only traces for now.
Batch Size:This is the number of data points or spans that are included in every export, which is an integer value that goes up to 512.
Headers:Optional header values are added to every export request to your APM tool. These are typically authorization or API keys that may be required by your observability tool.
Attributes:These custom tags are added to telemetry data can identify sources (e.g., a dev/test/stage/prod environment) and will help you filter specific traces in your observability tool.
Once the endpoint is set up, Hasura begins exporting traces to your endpoint.
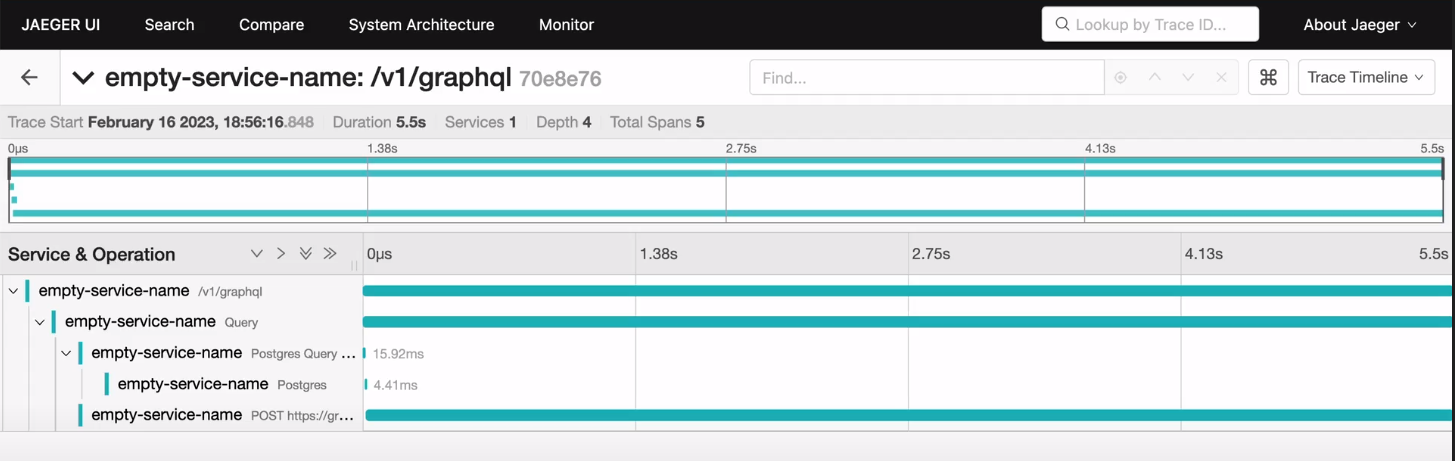
Use your observability tool's UI to visualize and perform further analytics on trace data to monitor how your application is performing and to diagnose and troubleshoot issues with your application. Traces and their spans are listed out and selecting a trace shows a flame graph with spans that show where each operation spent its execution time.
In the picture, we see the flame graph for trace of a GraphQL query that took 5.5 seconds, out of which 4.41 ms was spent in executing a query in Postgres. The bulk of the time was spent in executing the POST request (the last span of the trace) which in this case is a GraphQL API request to a remote schema.
Summary
In this blog post, we discussed how traces can help diagnose and troubleshoot application issues in production and how Hasura has adopted the OpenTelemetry standard to enable you to collect and analyze your traces in the observability tool of your choice.
To get started now, sign up for Hasura Cloud or contact us to trial Hasura Enterprise.