With great engineering comes great monitoring! Or rather that’s how we think about it at Hasura. Welcome to today’s blog as part of the April launch month! In building Hasura Data Delivery Network (DDN), we wanted to give our users complete transparency and control over their Hasura API. So to do just that, we introduce our latest observability powerhouse – Hasura’s GraphQL operation tracing!
Traces are one of the core tenets of API observability, the other two being metrics and logs. When it comes to microservices and multiple system components, observability becomes a key requirement for a peaceful night’s sleep! With GraphQL operation tracing, we enter into end-to-end distributed tracing to observe the journey of a request from the client to the database and back. This helps in quick debugging and system optimization as we build our supergraph.
With Hasura DDN’s tracing capabilities, you can observe exactly how long each operation is taking and identify bottlenecks or latencies in various components or services in your system. Hasura DDN instruments all API operations with the OpenTelemetry standard and supports tracing OOTB.
Hasura DDN’s tracing is extremely powerful with real-time insights and the ability to visualize all the components on your system, from the client, Hasura server, data connectors, and to your database. For every operation run against your Hasura API endpoint, you can view the query plan, models involved, commands accessed, various steps in each call, and time taken in each span. Such granularity and control over your observability and tracing OOTB with your API provider is unparalleled!
×
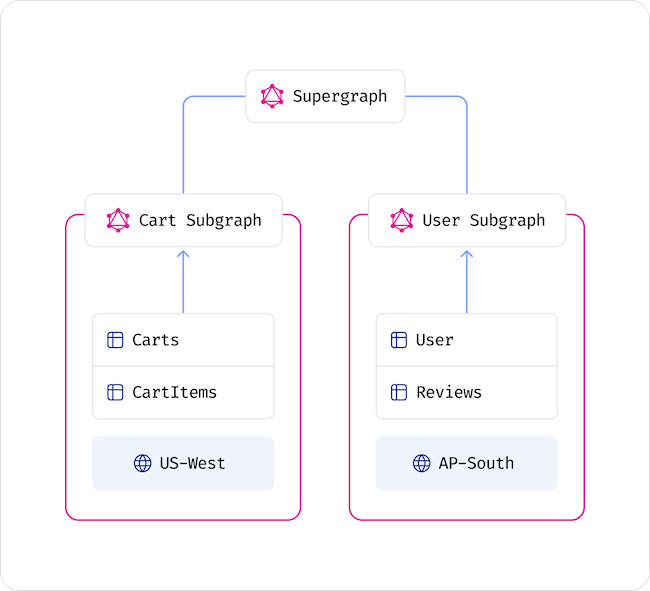
For this blog, I’m exploring end-to-end tracing for my simple e-commerce application. I have two subgraphs: User and Cart, both from PostgreSQL databases (Cart in North America and User in Asia Pacific), connected to my Hasura DDN.
We’ll try querying this system through the Hasura Console.
×
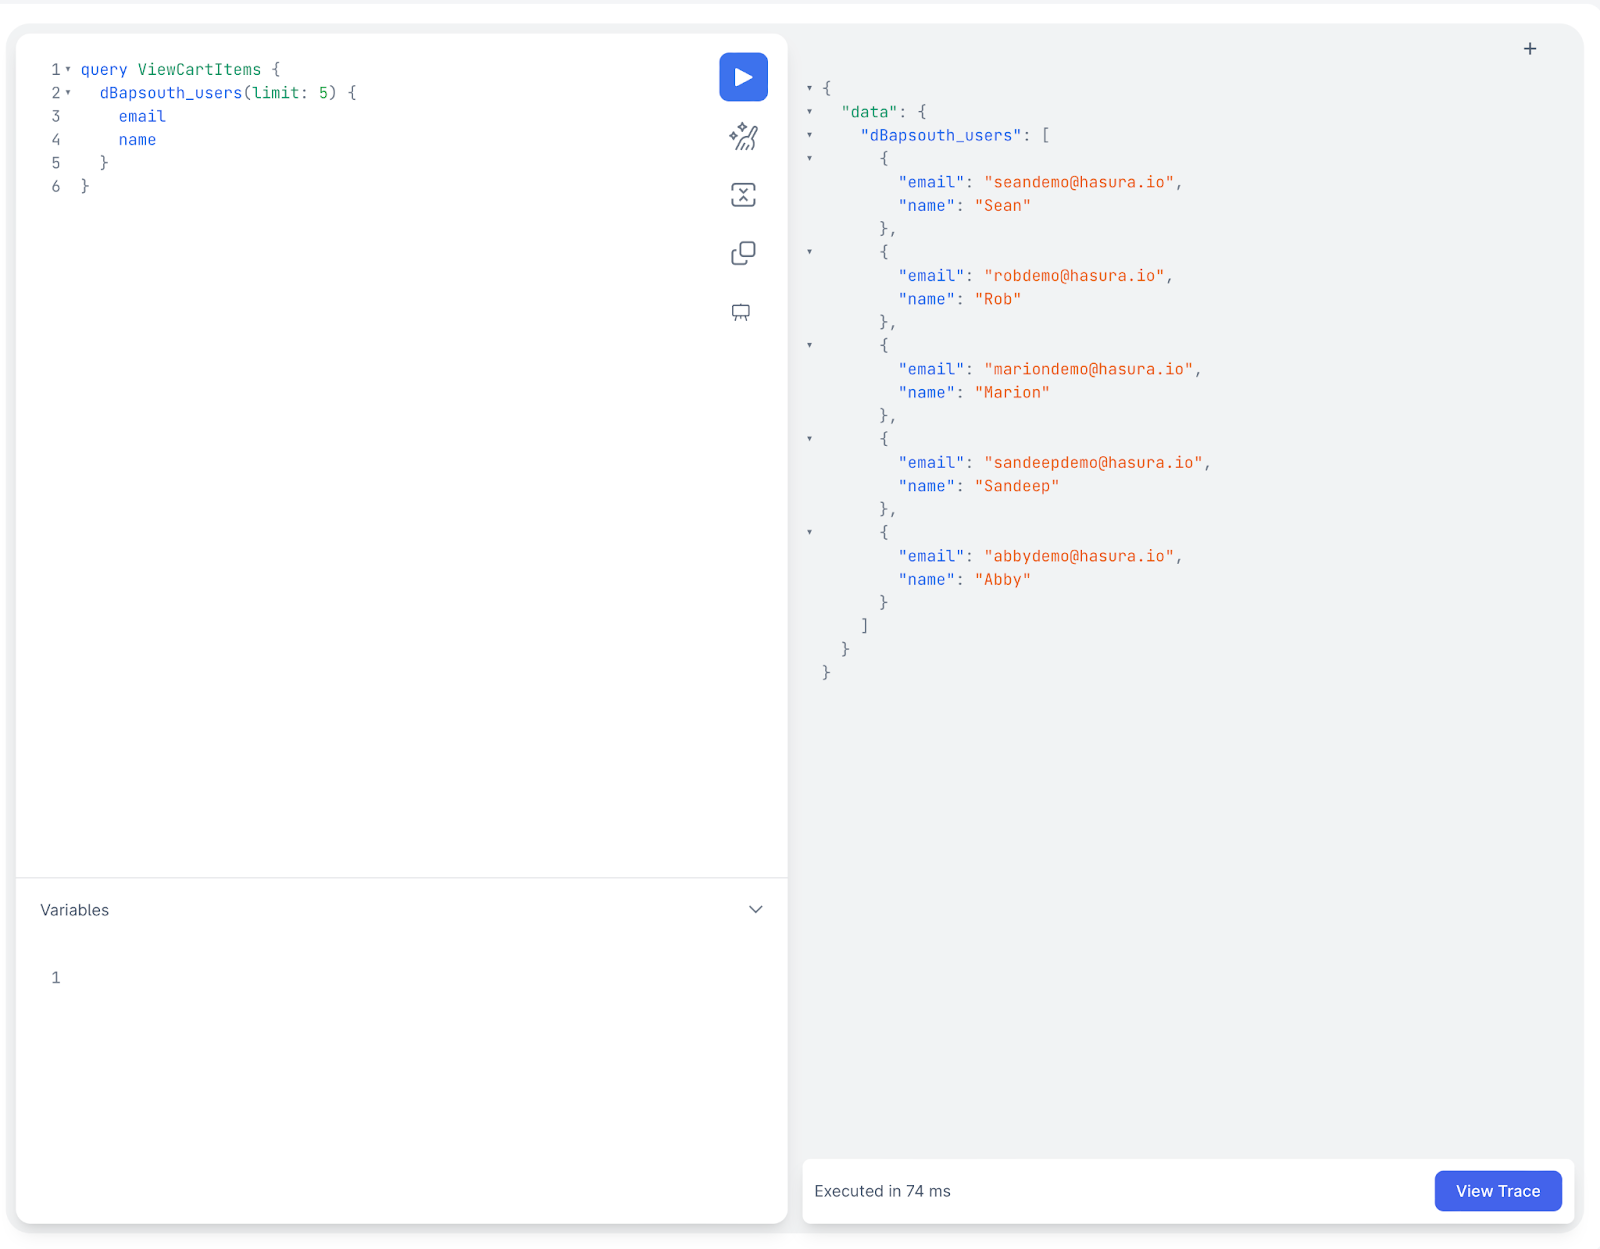
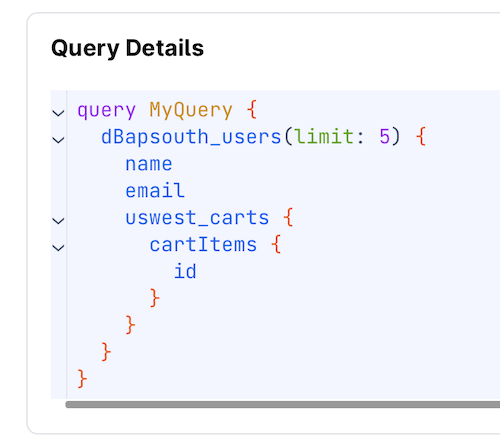
To start, let’s try to query a list of five users from the User subgraph:
×
With every query run, Hasura instantaneously gives me a trace for it. Let’s take a deeper look at the trace to see how the query traverses and what components exist in the system.
The path of a query can be visualized in the Topology diagram, where the query from the Hasura Console, which is the client in our example, first hits the Build API and then through the PostgreSQL data connector, fetches the data items from the database.
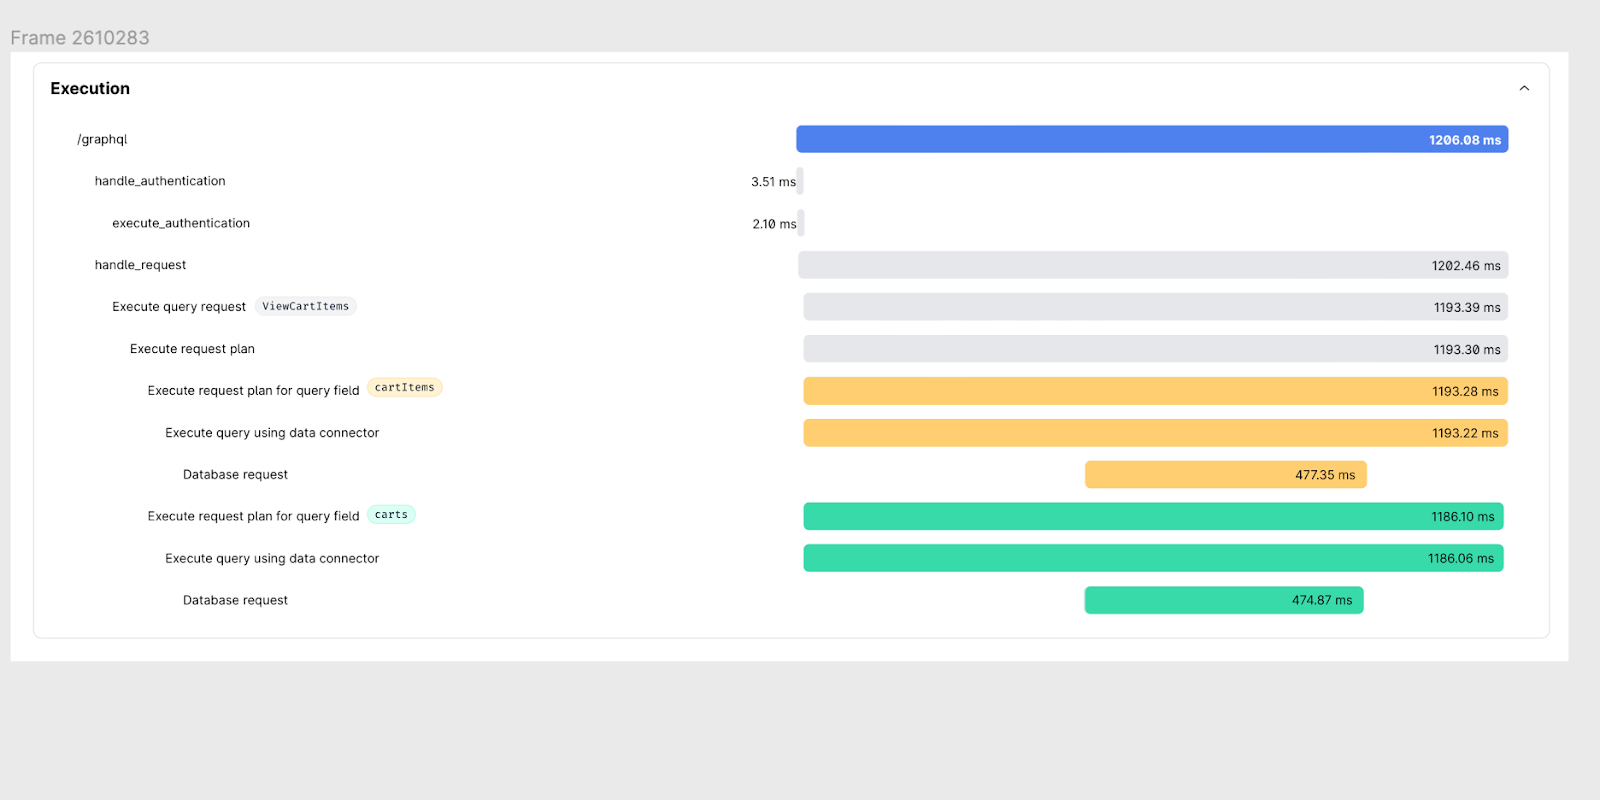
Trace viewer
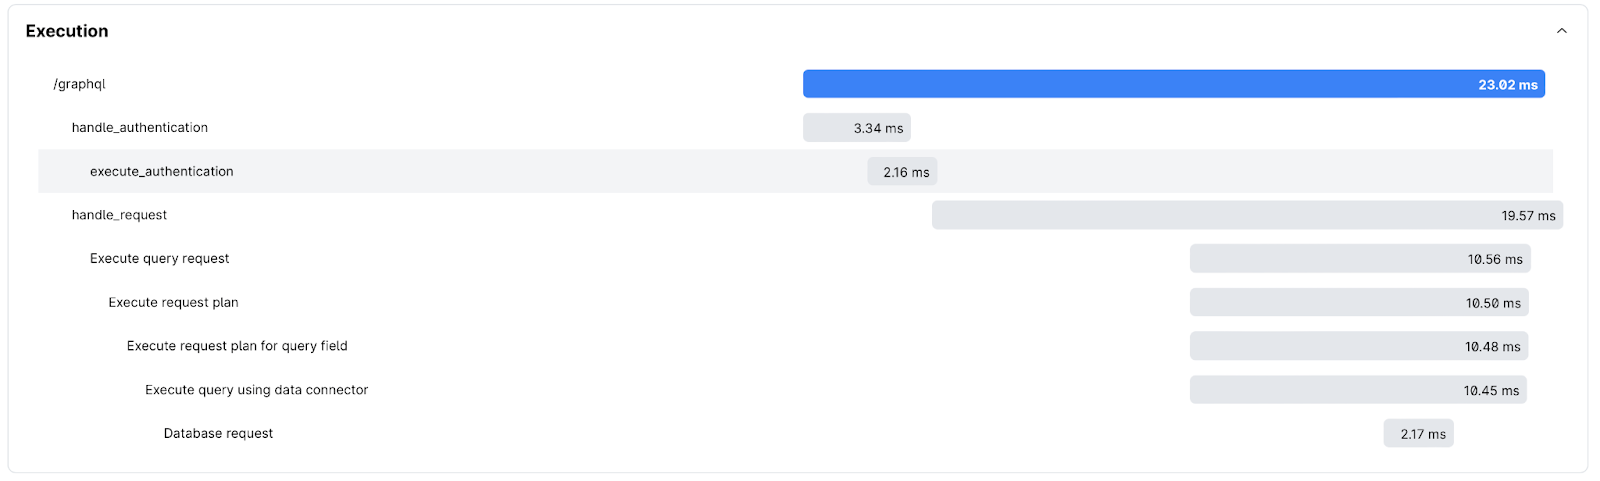
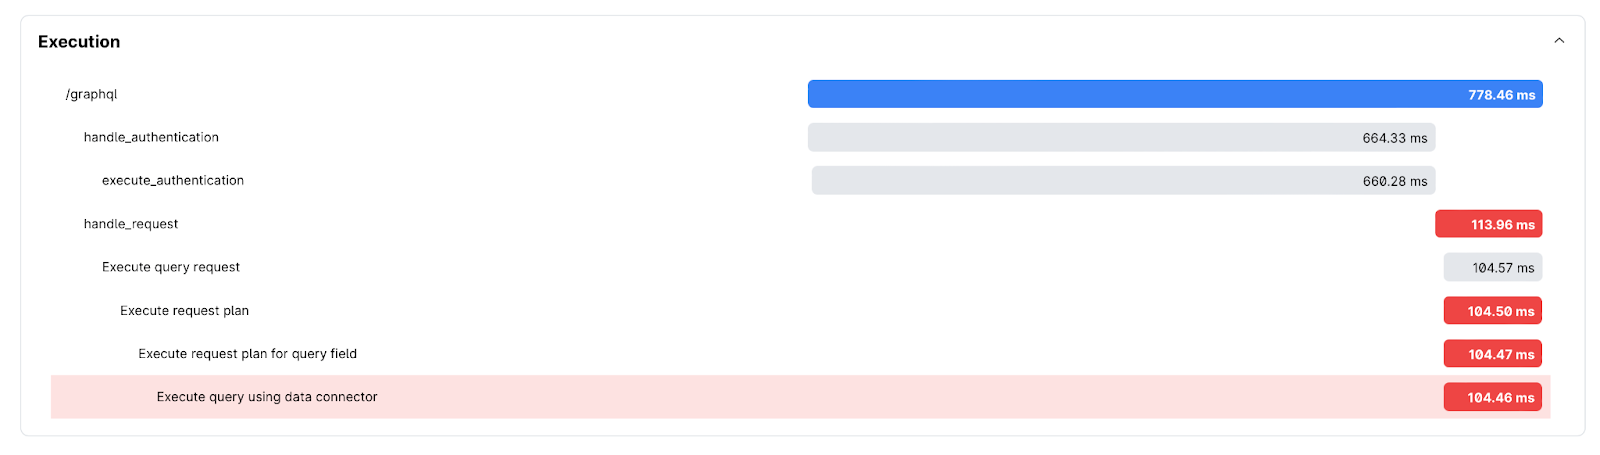
The trace viewer then shows how long the query took in each execution stage. I can now know specifically which stage of the waterfall is latent, giving us insights into the query performance and even helping debug error cases.
×
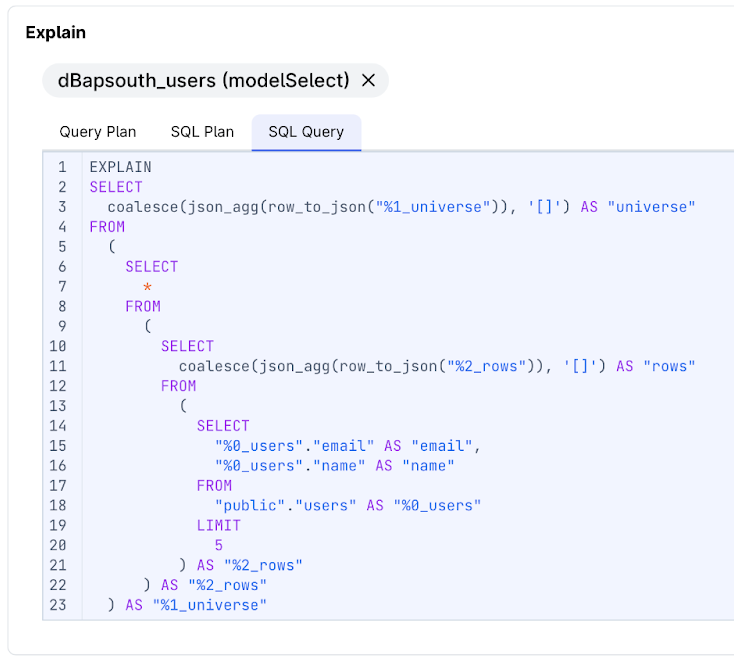
Query planning
You can also see how Hasura DDN plans the execution of the queries. Our Explain API shows how the GraphQL query transforms into the SQL query for database execution. More on our query planning capabilities here.
×
Traces are especially useful when you want to debug or optimize your system.
In the following example, I attempt to query the Cart information in a nested query from my database in North America while having the client in the Asia Pacific.
×
Looking at the trace helps us identify which database calls are latent, and by how much, to quickly help us identify ways to improve performance by optimizing our region infrastructure and our database calls.
×
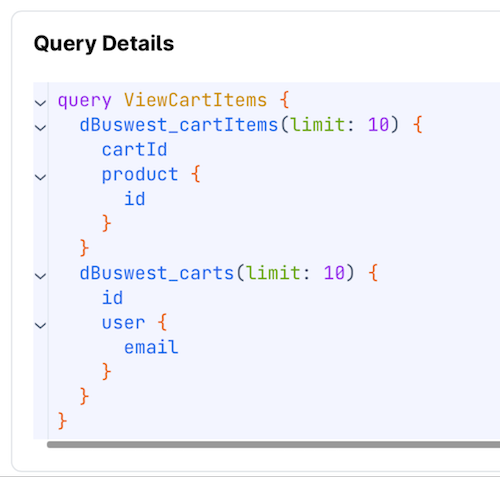
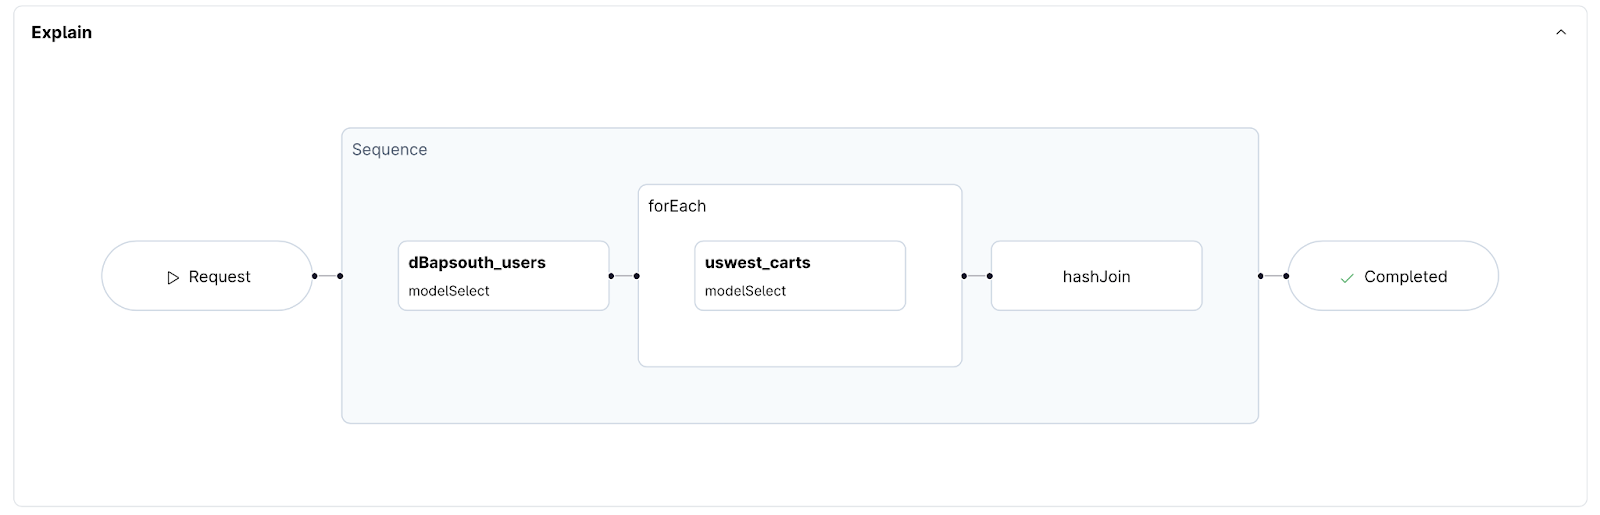
Let’s now look at a nested query across databases and regions:
×
For five users in subgraph ‘User’ I want to query Cart details from the subgraph ‘Cart.’ From the query Explain view we understand how the query is executed as a series of sequential steps.
×
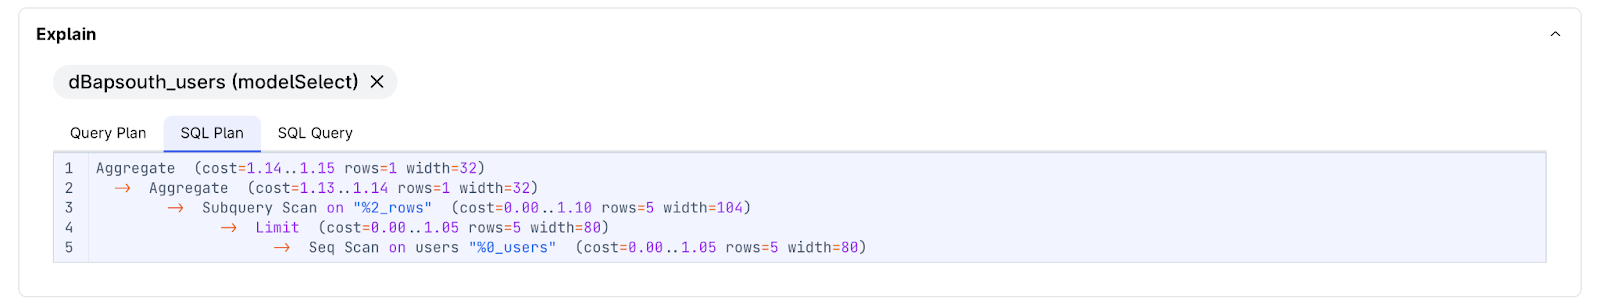
For highly complex queries, digging deeper into the Query Plan and SQL Plan can also help us tune the performance of our queries, which was otherwise a difficult and opaque task without Hasura’s GraphQL operation tracing!
×
Hasura traces are useful in error debugging
Different stages of your trace waterfall view show details of the corresponding failures and help quickly rectify them. Here’s an example error trace for an unreachable database.
The PostgreSQL data connector, in this case, is unable to reach the database:
×
We're adding more capabilities to the trace explorer to highlight these errors at prominent places to make it easy for developers to understand why requests are failing.
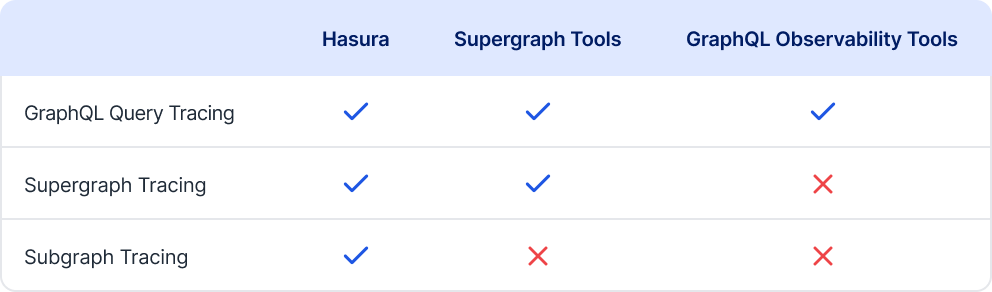
Where architectures are becoming increasingly distributed and complex, we’re focused on making Hasura’s observability and tracing your go-to resource to have complete control over your Hasura API with transparency and actionable insights. At every level of your architecture, right from the supergraph to the subgraph level, our observability empowers you to identify and resolve errors and tune performance effectively.
×
We have many more exciting things in store for you with team-level insights in the Supergraph Watchtower, API evolution, model analytics, and much more. So stay tuned, try out Hasura DDN tracing, and keep the love coming!
Ready to take Hasura DDN in beta for a spin? Simply click here to start your journey toward a more streamline, modern approach to data architecture and access!