/

hasura-header-illustration

Hasura DDN: The most incredible API for ClickHouse

Our commitment has always been to empower developers to build and scale applications effortlessly. As part of that commitment, we ensured Hasura’s Data Delivery Network (DDN) can harness the strength of the world's most advanced real-time analytics database, ClickHouse.

Introduction to Hasura DDN

With Hasura DDN, we're transforming how developers work with microservices and data sources. By enabling the instant creation and operation of a supergraph – a unified data API layer that simplifies the complex web of microservice – you can now focus on what matters most: building great applications.

Hasura DDN accelerates development by providing reusable data connections, allowing for easy creation of subgraphs that stitch together into a semantic supergraph. This eliminates the need for teams to build and operate microservices for data accessibility, reducing operational overhead and ensuring security and performance from the get-go.

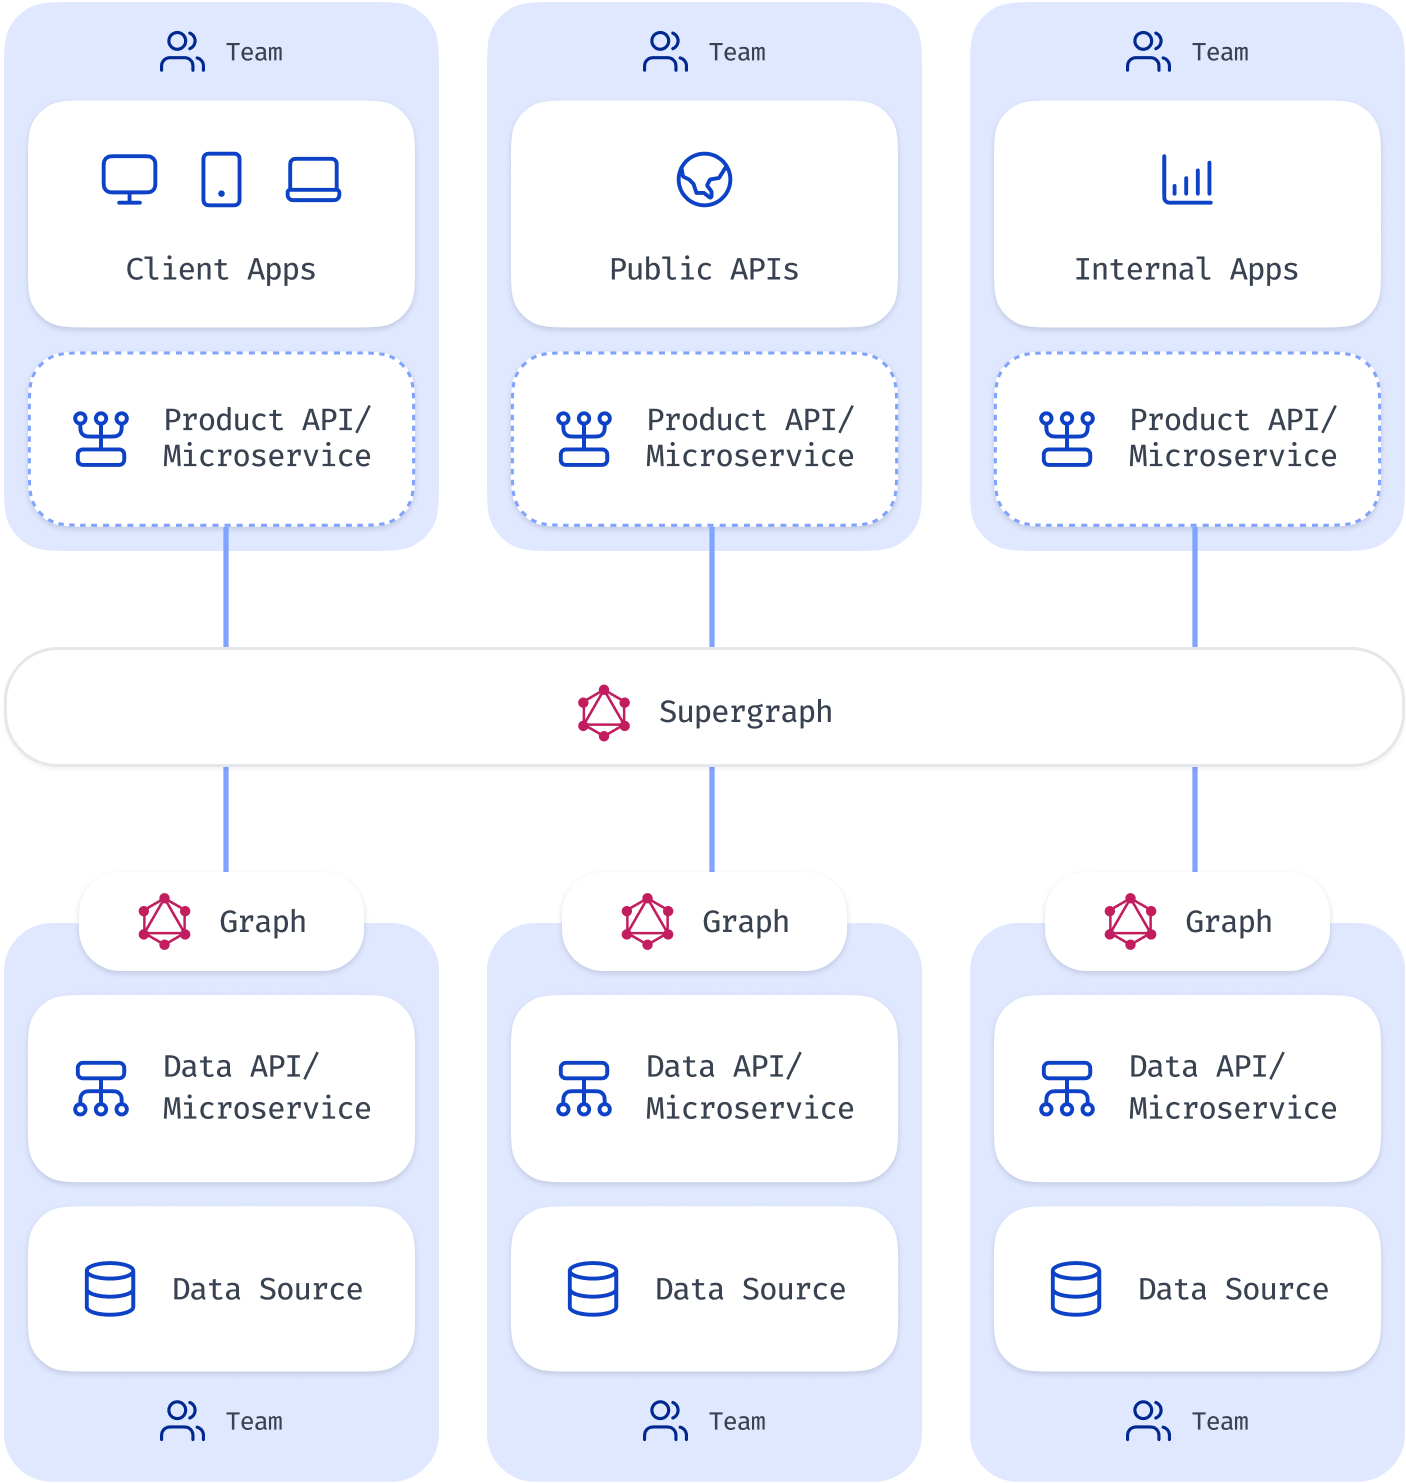
Hasura DDN benefits for all API stakeholders

API consumers get access to a blazing-fast composable API:

  • Composable API: Hasura DDN can easily be configured for your PostgreSQL database immediately generating GraphQL Queries that enable sorting, filtering, and pagination.
  • Supergraph federation:  Hasura DDN excels at complex compositions like cross-domain joins, nested filtering, and sorting. These types of API features are notoriously challenging to code and optimize. With Hasura, you get these features out of the box.
  • Performance: The Hasura query planner and the data connectors work together to leverage the native database capabilities. The query execution plan also intelligently sequences, batches, and distributes a composite query to avoid common performance challenges like N+1.

API producers can rapidly author rich APIs

  • Easy configuration: Rapidly author APIs on one (or many) sources with an intuitive and declarative domain-first modeling framework. Simply model your data domain, permissions, and relations via Hasura metadata to get a standardized API endpoint.
  • Connector ecosystem: Adding new databases or data services into your API is a step away. With a rich ecosystem of open source native data connectors, and the ability to build your own, getting a powerful GraphQL or REST API on your data is easy.

Platform teams get operational guarantees without the operational work

Hasura DDN instantly deploys your API on a global serverless runtime infrastructure. Get operational guarantees without the operational work.

  • Reliability and HA: Distributed multi-region edge network with instant rerouting away from impacted regions.
  • Global performance: Smart edge routing minimizes round trip between client → Hasura runtime → data replica.
  • Instant autoscaling: Sub-millisecond cold start – instantly scale out to quickly handle traffic spikes without a hiccup.
  • Deep observability: Accelerate debugging and reduce MTTR with deep end-to-end visibility down to database query.

When to use ClickHouse?

ClickHouse is a powerful open source columnar database that offers a range of features designed for speed and efficiency in processing large volumes of data. ClickHouse is an excellent choice for a database when you are dealing with large volumes of data and require high-speed data retrieval, aggregation, and analysis. It's particularly well-suited for real-time analytics and handling time-series data, log data, or any scenario where read operations vastly outnumber writes.

ClickHouse thrives in environments where query performance and the ability to generate reports quickly are critical, such as in financial analysis, IoT data management, and online analytical processing (OLAP). Furthermore, its column-oriented architecture makes it ideal for queries that need to scan large datasets but only access a subset of columns.

Here are some key features of ClickHouse:

  • Columnar storage model: ClickHouse stores data by column rather than by row, which is ideal for analytical queries that typically only require a subset of data fields. This model significantly reduces the amount of data read from the disk, enhancing query performance and data compression rates.
  • Real-time query processing: ClickHouse is designed for real-time data analysis. It can perform queries on large datasets with minimal latency, making it suitable for applications that require immediate insights from the most recent data.
  • Massive scalability: It supports horizontal scaling, which allows it to manage and query petabytes of data efficiently across a distributed cluster. This makes ClickHouse an excellent choice for big data applications.
  • Vectorized query execution: ClickHouse uses vectorized query execution which processes data in batches, rather than row by row. This approach optimizes CPU usage and speeds up data processing tasks.
  • Data compression: It offers excellent data compression, reducing storage costs and improving I/O speeds. ClickHouse uses different compression codecs optimized for specific data patterns and types.
  • SQL support: ClickHouse supports SQL for querying data, which makes it accessible to those familiar with SQL. It also includes additional optimizations and functions for time series data.
  • High availability and fault tolerance: ClickHouse ensures high availability and fault tolerance through replication and other mechanisms, supporting deployment in mission-critical applications.
  • Materialized views: These are used to automatically aggregate data and refresh the aggregated results as data is ingested. This feature is particularly useful for speeding up complex queries.
  • Projections: Projections are a feature in ClickHouse that enhance query performance by storing additional copies of the data sorted differently from the primary key. This allows for faster retrieval of data based on commonly queried columns or expressions, thereby optimizing read operations for specific queries.

These features make ClickHouse an appealing option for businesses and organizations looking to leverage large datasets for analytical and reporting purposes. Whether you're analyzing financial transactions, monitoring IoT devices, or managing user analytics, ClickHouse provides a robust platform to build powerful, real-time analytical solutions.

When should you not use ClickHouse? ClickHouse will not be the best fit for transactional applications requiring frequent updates or deletions of records, as ClickHouse is optimized for batch updates and high-speed data ingestion rather than transactional integrity.

Optimize queries using ClickHouse views and projections

In ClickHouse, both views and projections are used to optimize data access and query performance, but they serve different purposes and are implemented in distinct scenarios. Let’s have a look at when one might use each.

For the examples below, we will be using the New York Taxi Data sample dataset – one of the sample datasets provided by ClickHouse at the time of writing this article. Steps for adding the dataset to included in the Getting Started section below.

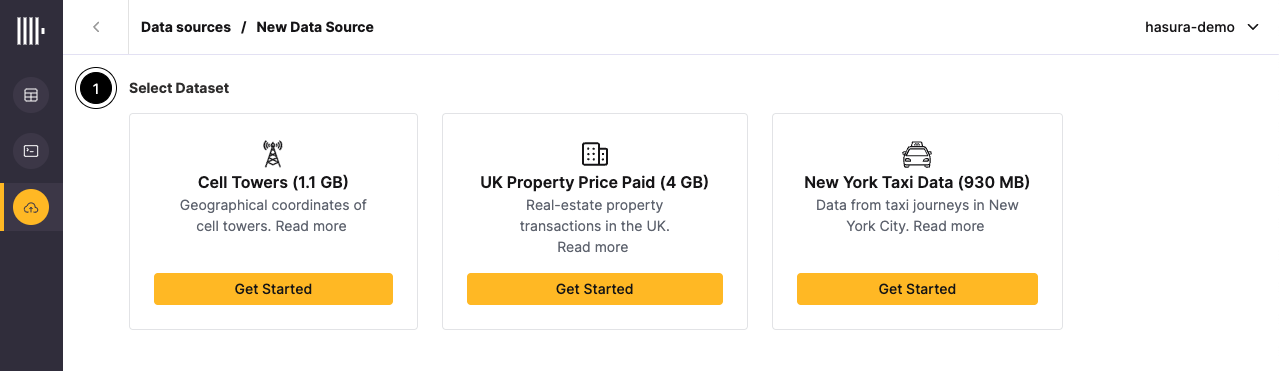
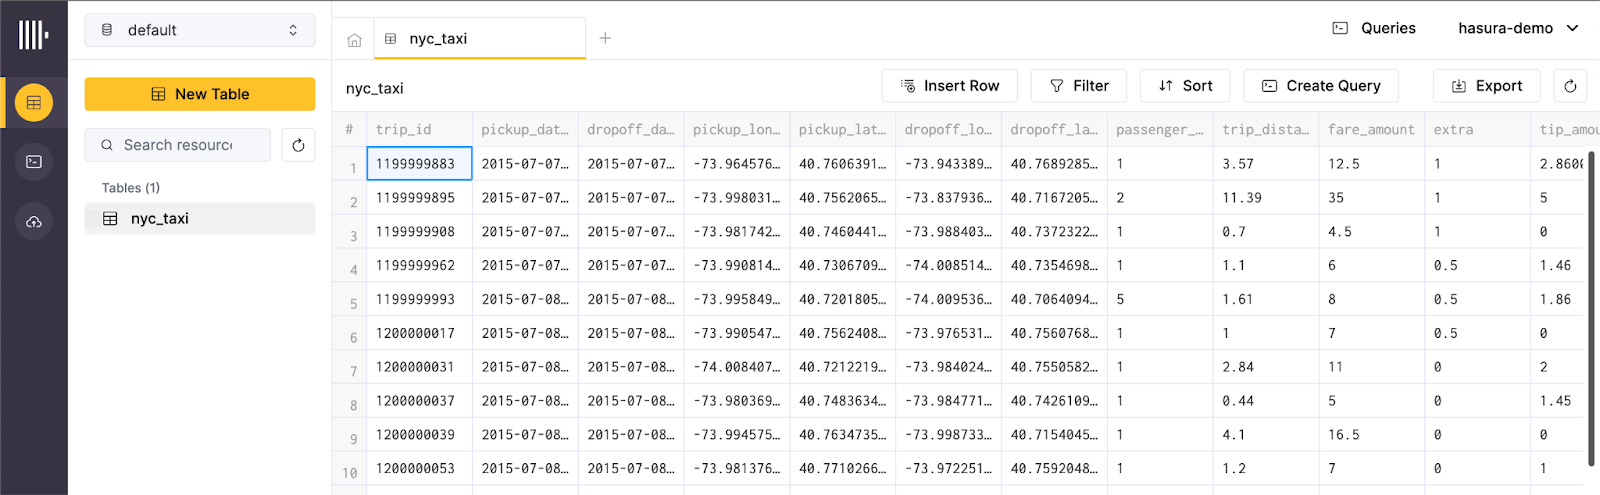
Using a View in ClickHouse with the NY Taxi Data

Scenario: Monthly revenue analysis

Example: To frequently analyze the monthly revenue from taxi trips, it's useful to create a view that aggregates total earnings by month and by taxi type (cab type). This makes it easy to track and compare performance across different types of cabs.

Implementation: Define a view that calculates the total fare and tip amounts by month and cab type.

CREATE VIEW monthly_revenue AS
SELECT 
  cab_type, 
  toMonth(pickup_datetime) AS month, 
  sum(fare_amount + tip_amount) AS total_revenue
FROM trips
GROUP BY cab_type, month;

Use: Analysts can directly query this view to retrieve monthly revenue figures, simplifying their queries and avoiding the need to re-aggregate data each time.

Using a Projection in ClickHouse with the NY Taxi Data

Scenario: Optimizing geospatial queries

Example: Given that queries involving the pickup and drop off locations are common (for example, to analyze trips within specific geographic boundaries), a projection that optimizes for these fields can significantly improve performance.

Implementation: Create a projection that pre-sorts the data based on pick up and drop off longitude and latitude, facilitating faster geospatial queries:

ALTER TABLE trips ADD PROJECTION geo_optimized 
(SELECT * ORDER BY pickup_longitude, pickup_latitude, dropoff_longitude, dropoff_latitude);

Use: This projection is beneficial when running queries that involve spatial operations, like finding trips that started or ended within a certain distance of a landmark or specific coordinates, as it reduces the computational load by utilizing pre-sorted data.

Getting started

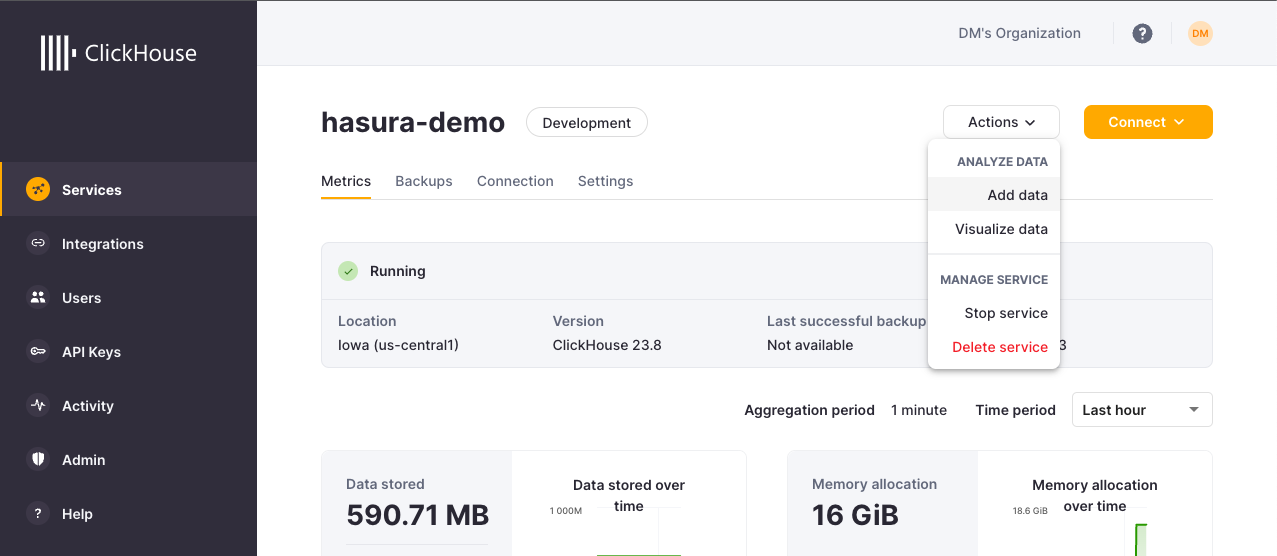
Create a free ClickHouse Cloud project

You can connect Hasura to an open source or cloud-hosted version of ClickHouse. This example will cover connecting a Hasura Cloud project to a ClickHouse Cloud deployment.

To get started, first, create a free ClickHouse Cloud trial. You will be prompted with several questions regarding what type of deployment and cloud provider you would like to use. You can connect Hasura to any type of ClickHouse deployment. For this demo, we recommend you select “Anywhere” to simplify things.

Note: It is recommended that you host your Hasura and ClickHouse deployments in the same cloud provider and region, if possible, to reduce latency.

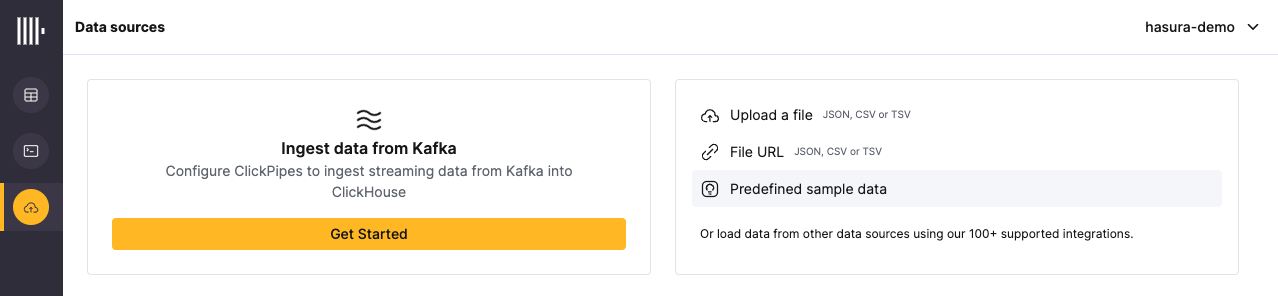
Add sample data to your ClickHouse deployment

Once you have created your ClickHouse Cloud deployment, you can add some sample data.

Luckily, ClickHouse makes it easy to get started with a number of sample data sets. From the ClickHouse dashboard, click the Actions dropdown and select add data. This will launch the console for the ClickHouse service you created.

You will be presented with several options to add data to ClickHouse. You can choose any of these options to get started. For this example, we will choose one of the predefined sample data sets ClickHouse provides.

You can see the predefined sample data offered by ClickHouse as of writing this post below. You can use any data to connect to Hasura. For this example, we’re using New York Taxi Data.

After you import the data into your ClickHouse service, you should see the following table and data in the ClickHouse console.

Connect to Hasura

Please refer to the Getting Started - Create an API documentation if you get stuck during any of the steps outlined below.

Prerequisites

  1. Install the new Hasura CLI – to quickly and easily create and manage your Hasura projects and builds.
  2. Install the Hasura VS Code extension – with support for other editors coming soon(recommended)!
  3. ClickHouse account with a service to connect to that either allows access from anywhere or includes your Hasura IP address in the service’s list of allowed IP addresses.

Create project and connect ClickHouse

Login to Hasura Cloud with the CLI.

ddn login

Create a new project using the create project command in the CLI and change to the new directory that was generated.

ddn create project --dir ./my-first-supergraph
cd my-first-supergraph

Run the add connector-manifest command to create a connector for ClickHouse in your project.

ddn add connector-manifest clickhouse_connector --subgraph app --hub-connector hasura/clickhouse --type cloud

Add values for your ClickHouse username, password, and connection string to corresponding definition found in: app/clickhouse/connector/clickhouse_connector.build.hml

kind: ConnectorManifest
version: v1
spec:
  supergraphManifests:
    - base
definition:
  name: clickhouse_connector
  type: cloud
  connector:
    type: hub
    name: hasura/clickhouse:v0.2.5
  deployments:
    - context: .
      env:
        CLICKHOUSE_PASSWORD:
          value: ""
        CLICKHOUSE_URL:
          value: ""
        CLICKHOUSE_USERNAME:
          value: ""

Note: You can also use environment variables for these values. Please refer to our Getting Started - Add a connector manifest for more details.

Update connector, track models, and build

At this point, you can either run the dev mode to watch your project and create new builds as changes are made to your metadata using Hasura’s LSP and VSCode extension.

ddn dev

Alternatively, you can run the following commands to add specific models: In this example, the Trips table and MonthlyRevenue view will be added as models to your API.

ddn update connector-manifest clickhouse_connector
ddn update data-connector-link clickhouse_connector
ddn add model --data-connector-link clickhouse_connector --name Trips
ddn add model --data-connector-link clickhouse_connector --name MonthlyRevenue
ddn build supergraph-manifest

Try out some GraphQL queries
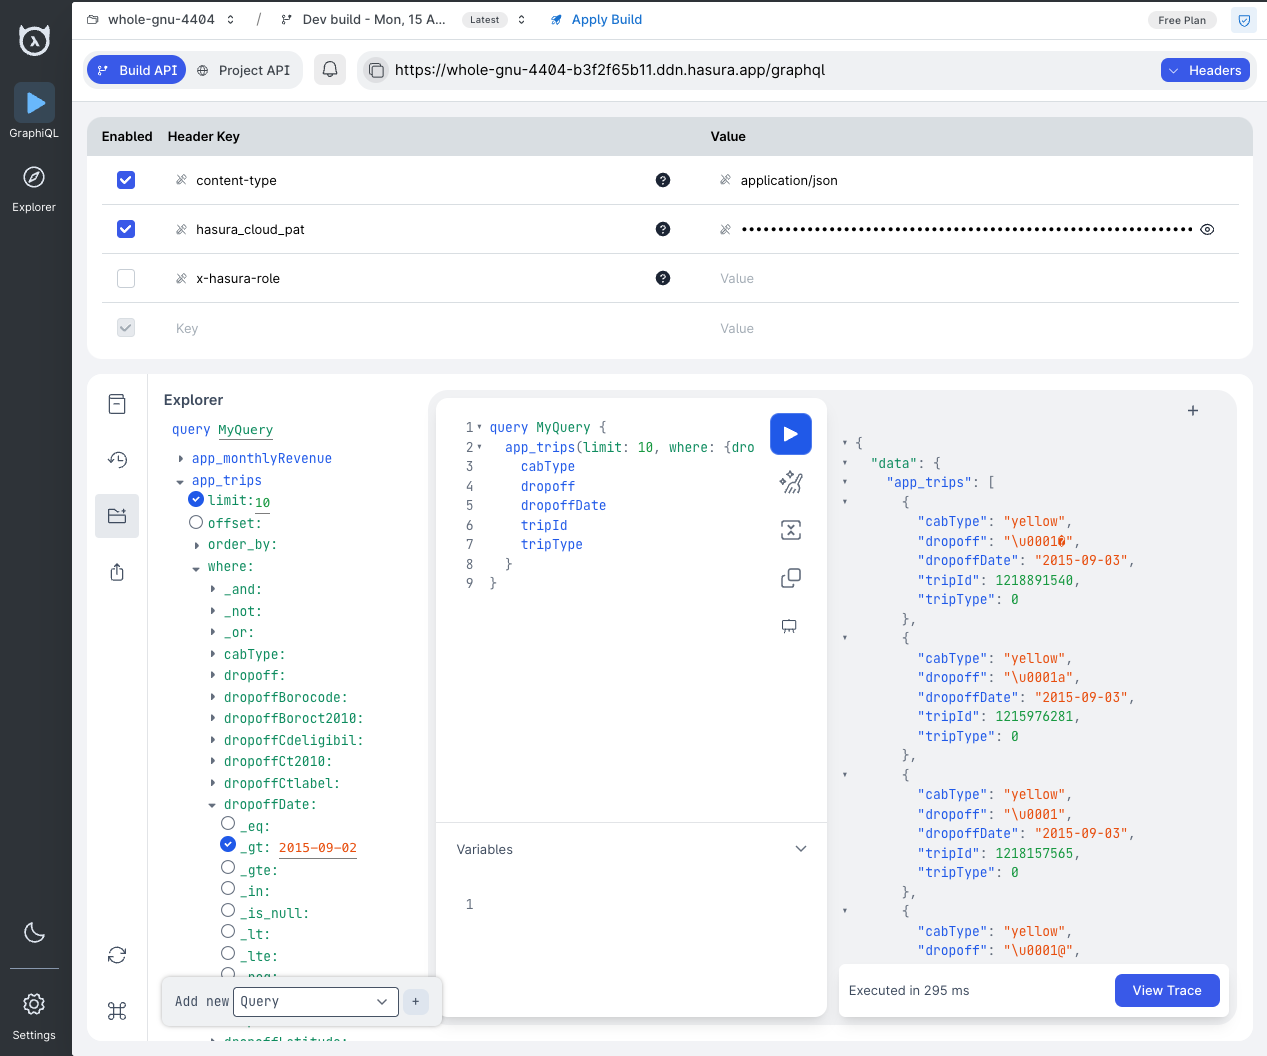
You are now ready to start using your API!

During the previous step, the console will return some information including the Console URL. Load this link in your browser to explore the API you have created for your ClickHouse database. The UI will resemble something like this:

You can now use the GraphiQL UI to make requests to your API and start trying out some queries.

For example, this query will return 5 results where the dropoffDate is after 2015-09-02. As well as the results of the view we created earlier.

GraphQL query:

query MyQuery {
  app_trips(limit: 5, where: {dropoffDate: {_gt: "2015-09-02"}}) {
    cabType
    dropoff
    dropoffDate
    tripId
    tripType
  }
  app_monthlyRevenue {
    cabType
    totalRevenue
    month
  }
}

Results:

{
  "data": {
    "app_trips": [
      {
        "cabType": "yellow",
        "dropoff": "\u0001�",
        "dropoffDate": "2015-09-03",
        "tripId": 1218891540,
        "tripType": 0
      },
      {
        "cabType": "yellow",
        "dropoff": "\u0001a",
        "dropoffDate": "2015-09-03",
        "tripId": 1215976281,
        "tripType": 0
      },
      {
        "cabType": "yellow",
        "dropoff": "\u0001",
        "dropoffDate": "2015-09-03",
        "tripId": 1218157565,
        "tripType": 0
      },
      {
        "cabType": "yellow",
        "dropoff": "\u0001@",
        "dropoffDate": "2015-09-03",
        "tripId": 1216075068,
        "tripType": 0
      },
      {
        "cabType": "yellow",
        "dropoff": "\u0001C",
        "dropoffDate": "2015-09-03",
        "tripId": 1218693991,
        "tripType": 0
      }
    ],
    "app_monthlyRevenue": [
      {
        "cabType": "yellow",
        "totalRevenue": 5663768.081338277,
        "month": 7
      },
      {
        "cabType": "yellow",
        "totalRevenue": 16364225.173764862,
        "month": 8
      },
      {
        "cabType": "yellow",
        "totalRevenue": 7528500.511831259,
        "month": 9
      }
    ]
  }
}

Ready to explore?

Discover how our latest release can transform your application development by leveraging the strengths of PostgreSQL and the innovation of Hasura DDN. Start for free or book a demo!

Get in touch with us to talk to an expert who will work with you to get you set up with a supergraph powered by the Hasura DDN – ASAP.

Blog
16 Apr, 2024
Email
Subscribe to stay up-to-date on all things Hasura. One newsletter, once a month.
Loading...
v3-pattern
Accelerate development and data access with radically reduced complexity.