Analyzing Query Plans
Postgres has great tooling that helps you analyze the performance of queries. You can execute a SQL statement using EXPLAIN to ask the database why a particular query is slow. For example, in our slack model, we can make the following query in the SQL tab of the Data page of the console:
EXPLAIN (FORMAT JSON, ANALYZE, BUFFERS)SELECT *FROM channelWHERE name = 'daily-standup';
The above would return a JSON response with data for Total Cost, Planning Time, and Execution Time, among other metrics. These metrics help you understand how long a query takes and what parts to optimize. For example, this returned a plan type Seq Scan (Sequential Scan), and for large datasets, this could be relatively slower.
PostgreSQL Indexes
Postgres indexes are a way of increasing performance on a column that is queried frequently. The concept is similar to the one of an index in a book. It helps access the data you’re looking for more quickly by maintaining additional metadata.
Let’s say the database receives a large number of requests for selecting channels that are queried by their name, for example:
SELECT * FROM channel WHERE name = 'daily-standup';
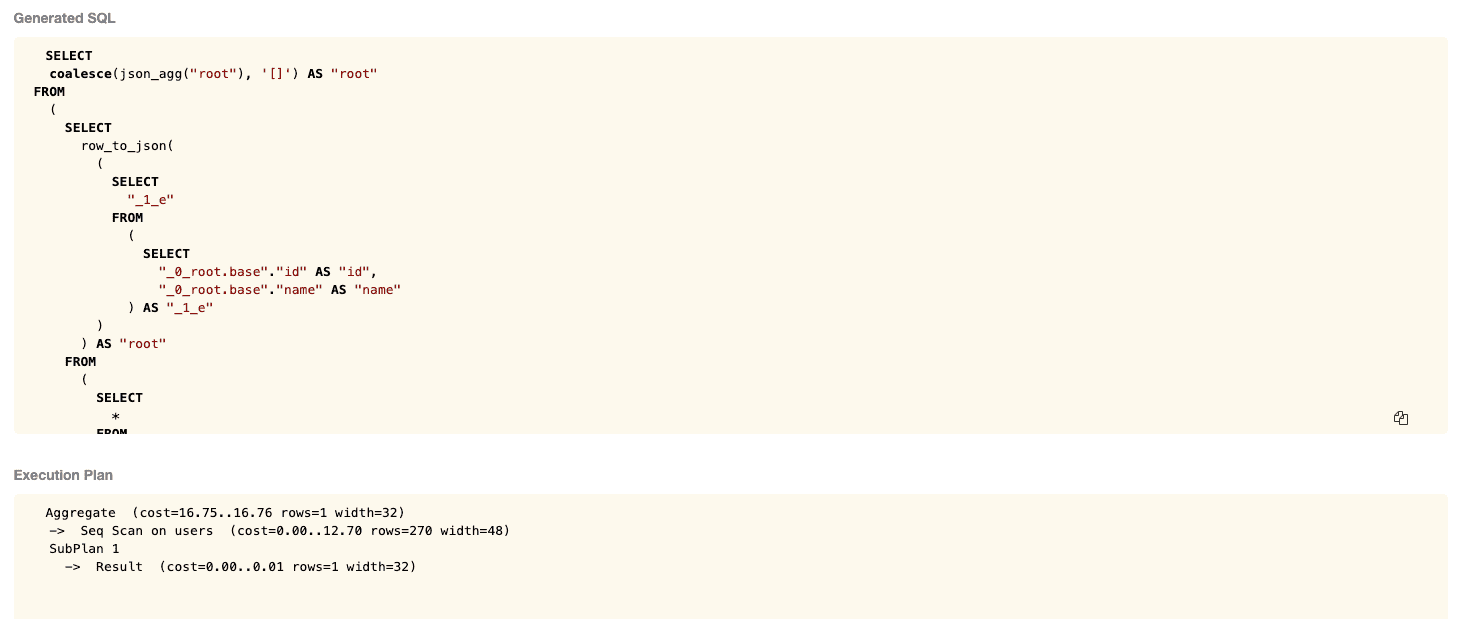
In the API Explorer, run the following query:
query {channel {idname}}
And click on the Analyze button.

You can notice that there is a Sequential Scan. This could become slower if there are a lot of records in the database.
To improve the performance, we can create an index on the name column of the channel table. Head to the Data tab in the Hasura Console and navigate to the SQL tab.
Execute the following statement:
CREATE INDEX channel_name_index ON channel (name);
Since the database can now look up the result of these queries more quickly, the performance of these queries will increase significantly.
Build apps and APIs 10x faster
Built-in authorization and caching
8x more performant than hand-rolled APIs


