Edit on GitHub
Observability
Observability means you can answer any questions about what’s happening inside the system by observing metrics from outside.
In a GraphQL application, these are the essential metrics and context to capture:
- time of query and query execution time
- actual query payload/query hash
- response status codes of queries/mutations/subscriptions
- graphql server version
- the IP address from which the query originated
And specifically, in the case of Hasura GraphQL Engine, you might want to capture context like:
- the user ID of the user who made the query
- the role of the user
- metadata of the query
With this information available, you can ask meaningful questions in a production deployment to find out what went wrong internally or why your Hasura GraphQL API is behaving the way it is. For example, suppose you see anomalies in the query execution time for a particular query. In that case, you can identify what is wrong with the query (maybe there is a database bottleneck that you need to optimize).
Monitoring
Hasura Cloud has built-in metrics for monitoring errors, WebSocket connections, and subscriptions, with drill-down into individual operations.
Here's what the errors tab on Cloud looks like:
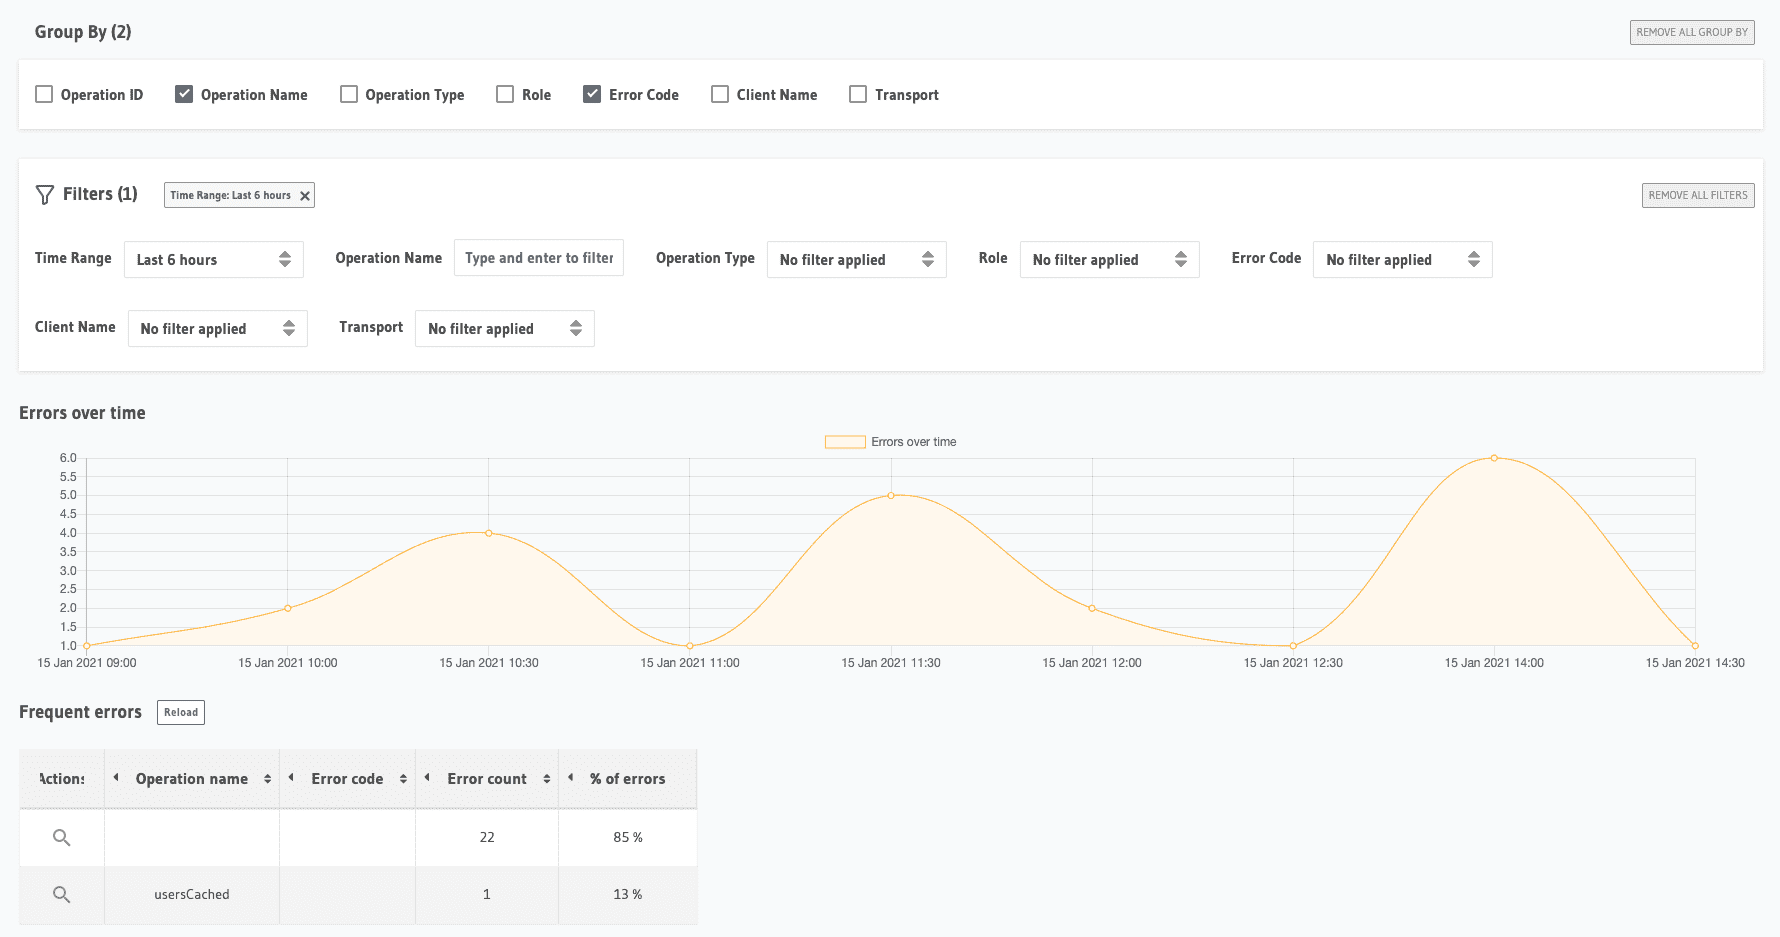
Looking more closely, you can identify what requests are failing and why. With GraphQL, you don't have status codes to identify errors uniquely. So the requests need to be inspected for the errors object in response.
Distributed tracing
The tracing in Hasura Cloud works across databases, remote schemas, event triggers and auth webhooks, and actions.
Here's an example of tracing a request. This is explicitly hitting just the database.
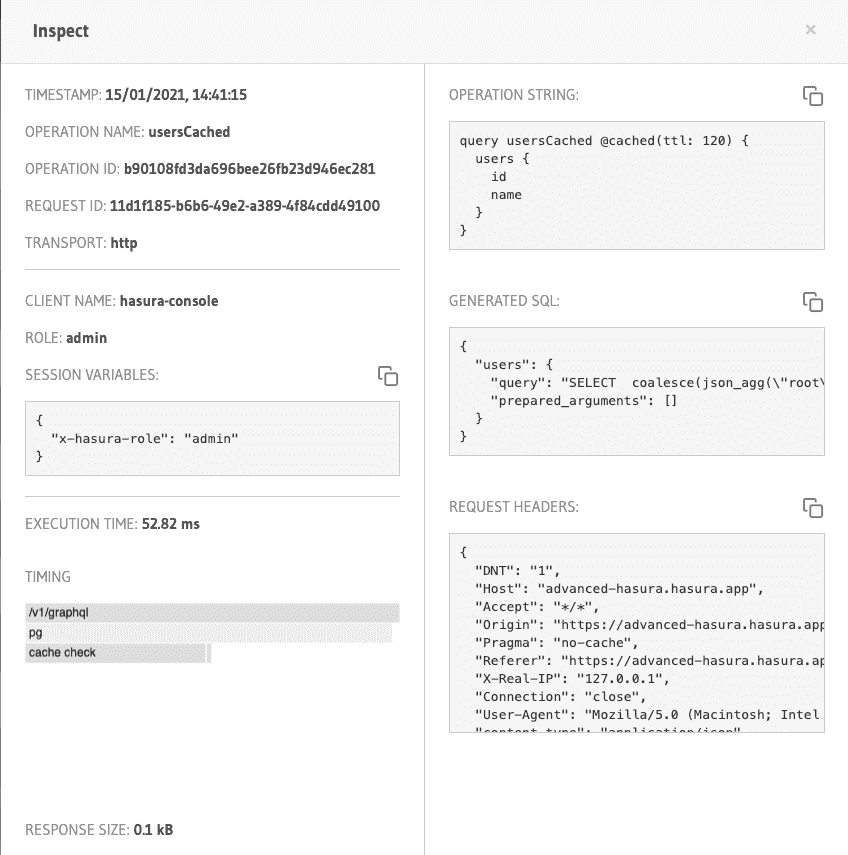
The cached query is being inspected here. Inspecting an individual request gives more detailed metrics like the headers, tracing of the request, and unique identifiers for debugging later.
Similarly, any request made to the remote schema, actions, and events can be traced.
 Build apps and APIs 10x faster
- Built-in authorization and caching
- 8x more performant than hand-rolled APIs