Improving Observability of Subscriptions and Event Triggers in Hasura – a Golden Signals approach
In the world of modern application development, observability is a critical aspect of ensuring the reliability and performance of systems. Hasura, a powerful GraphQL engine, understands the importance of observability and is continuously working to enhance it.
Taking inspiration from the Golden Signals monitoring approach described in the SRE book by Google, Hasura has made significant improvements to the observability of subscriptions and event triggers.
In this blog, we will explore these enhancements and how they can help you monitor and debug your Hasura-based applications effectively.
“The four golden signals of monitoring are latency, traffic, errors, and saturation. If you can only measure four metrics of your user-facing system, focus on these four.”
Subscription Observability
Observing the performance and behavior of subscriptions is crucial for ensuring the reliability and efficiency of GraphQL-based applications. Considering subscriptions deal with real time data, the performance and load on the database needs to be observed and balanced in an efficient manner. This would require internal visibility on how Hasura processes a subscription and keep the data in sync on different stages.
At Hasura, we have taken inspiration from the Golden Signals monitoring philosophy outlined in the SRE book by Google to enhance the observability of subscriptions. Hasura incorporates the four golden signals – latency, traffic, errors, and saturation – into subscription observability and more details on how each of these signals can be monitored with the exported metrics is documented here.
For example, If you see a performance issue you may want know:
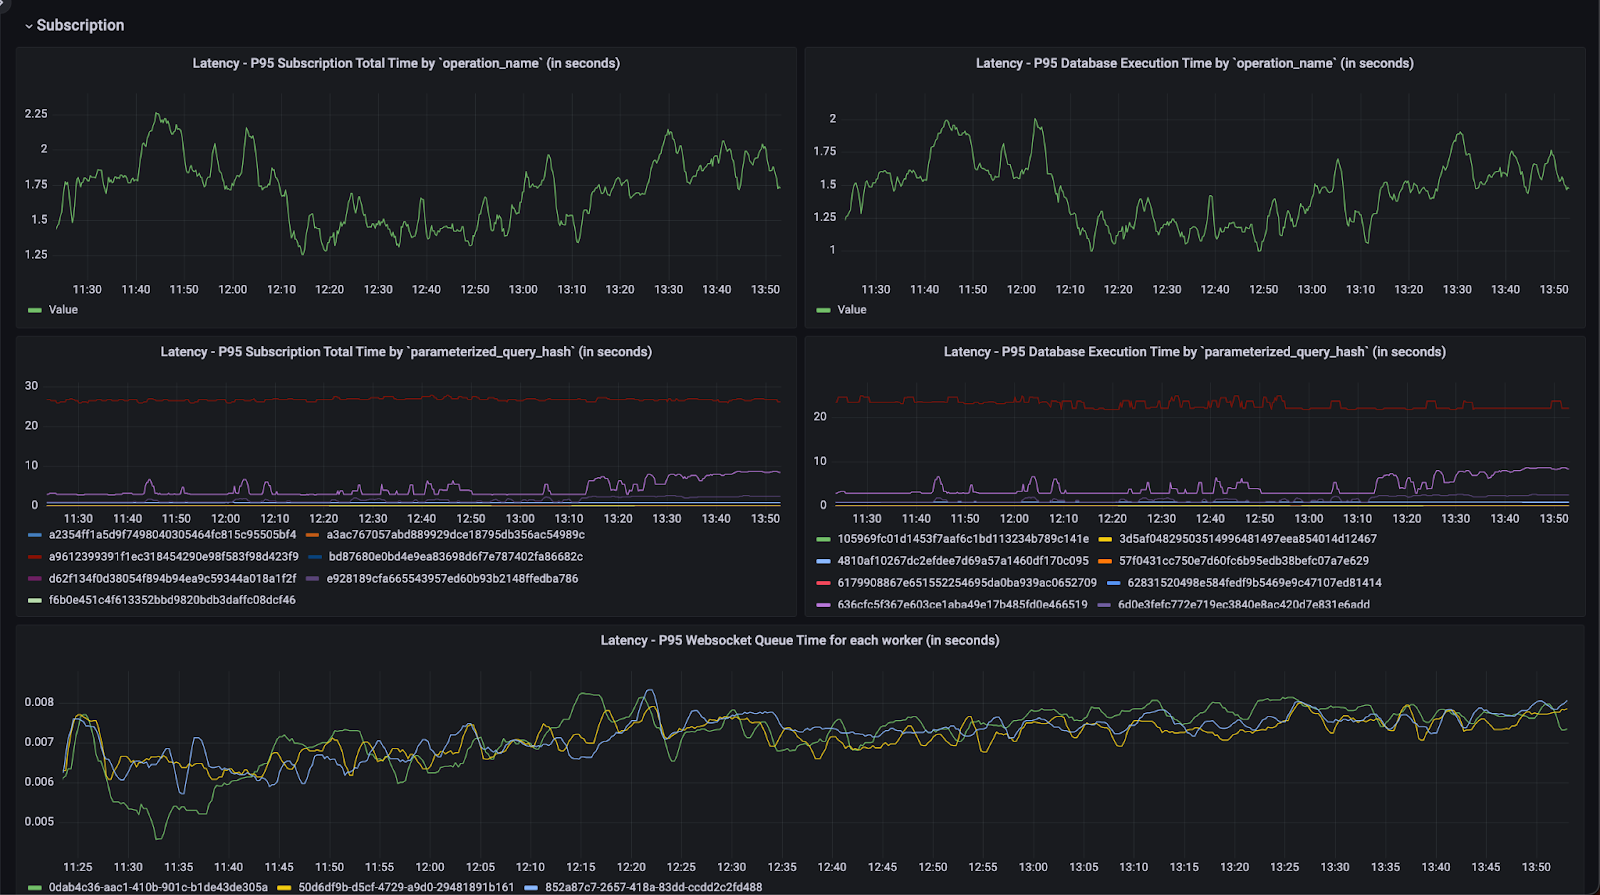
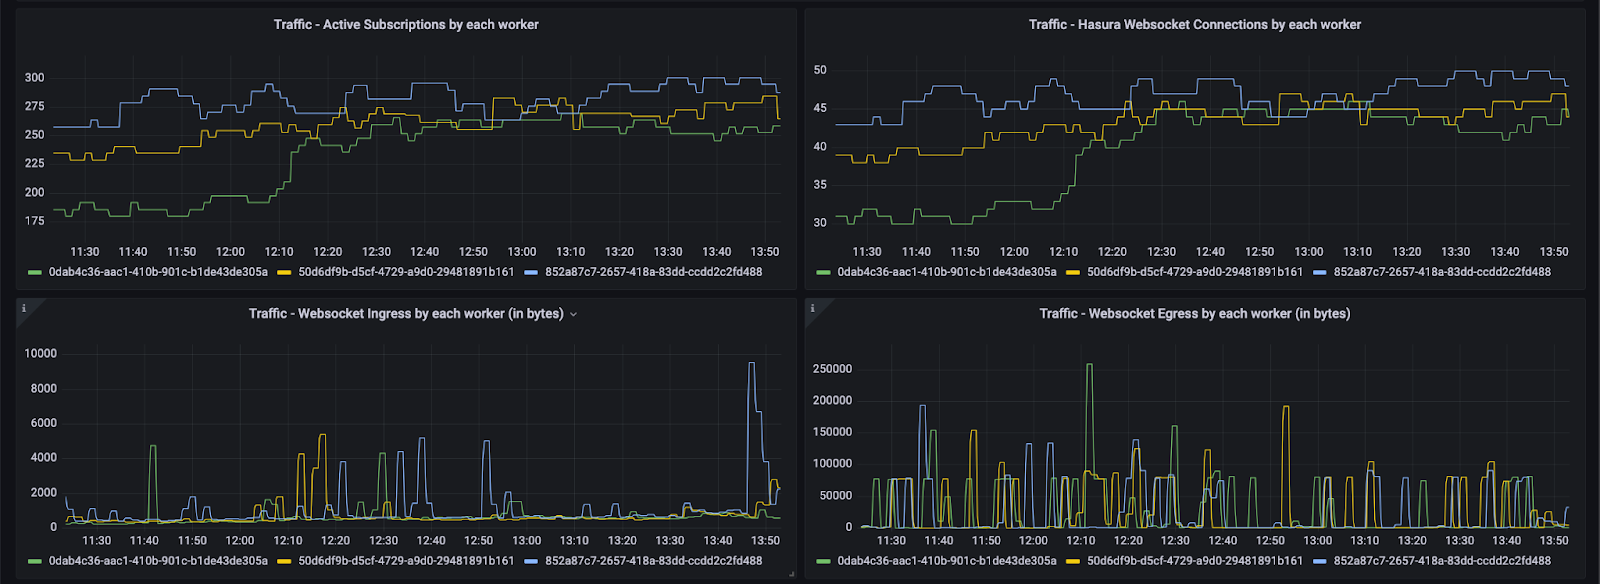
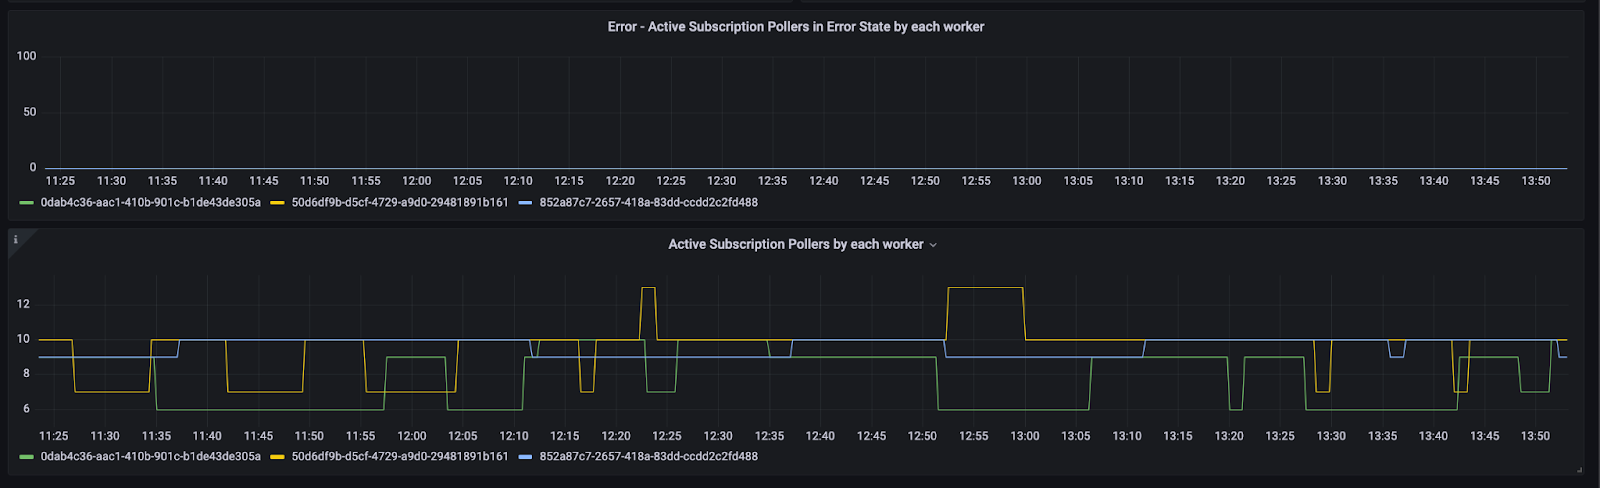
Latency
Subscriptions (by operation name / query hash)
Database Execution Time (by operation name / query hash)
The following screenshots shows an example Grafana dashboards rendered using the metrics exported using OpenTelemetry exporter from Hasura.
Hasura empowers developers to proactively monitor, debug, and optimize their GraphQL-based applications. Leveraging these signals enables improved reliability, performance, and scalability, providing users with real-time data updates seamlessly.
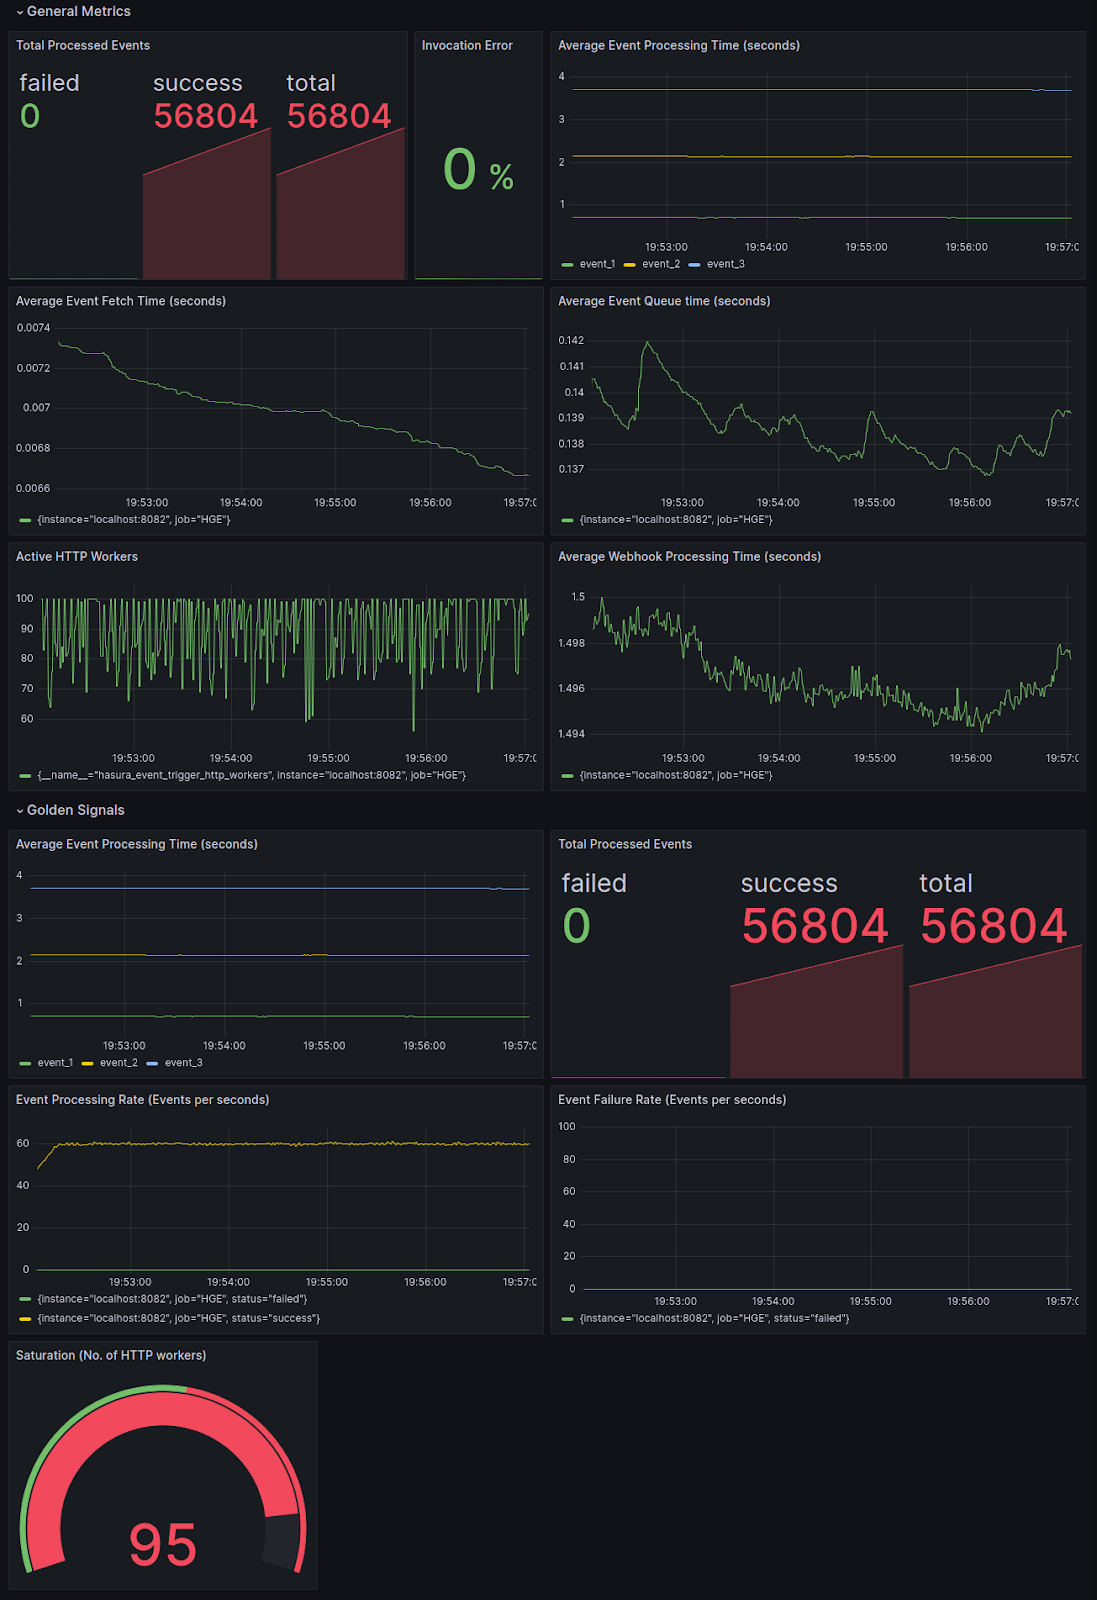
Event Triggers Observability
Event triggers in Hasura allow you to react to database events and invoke webhooks. Considering the source of these events may or may not be user events, the traffic is very much connected to your business logic and in many cases unpredictable in nature. Which makes it more important to have an enhanced observability on each stages of an event trigger execution.
For instance, you watch the overall success rate and processing time first, and if you notice changes in the processing time (latency), you may want to look into the internal latency at every stage of an event trigger operation such as Event fetch time, Queue time, HTTP webhook processing time, active HTTP workers to process these events from the queue etc.
Or if you notice any errors or increasing error rates, you may want to look at the HTTP workers saturation rate, or how your event webhook service is processing the requests.
The following screenshots shows an example Grafana dashboards rendered using the metrics exported using OpenTelemetry exporter from Hasura.
Monitoring these metrics helps identify saturation and take necessary actions, such as increasing the number of HTTP workers or scaling the Hasura instance.
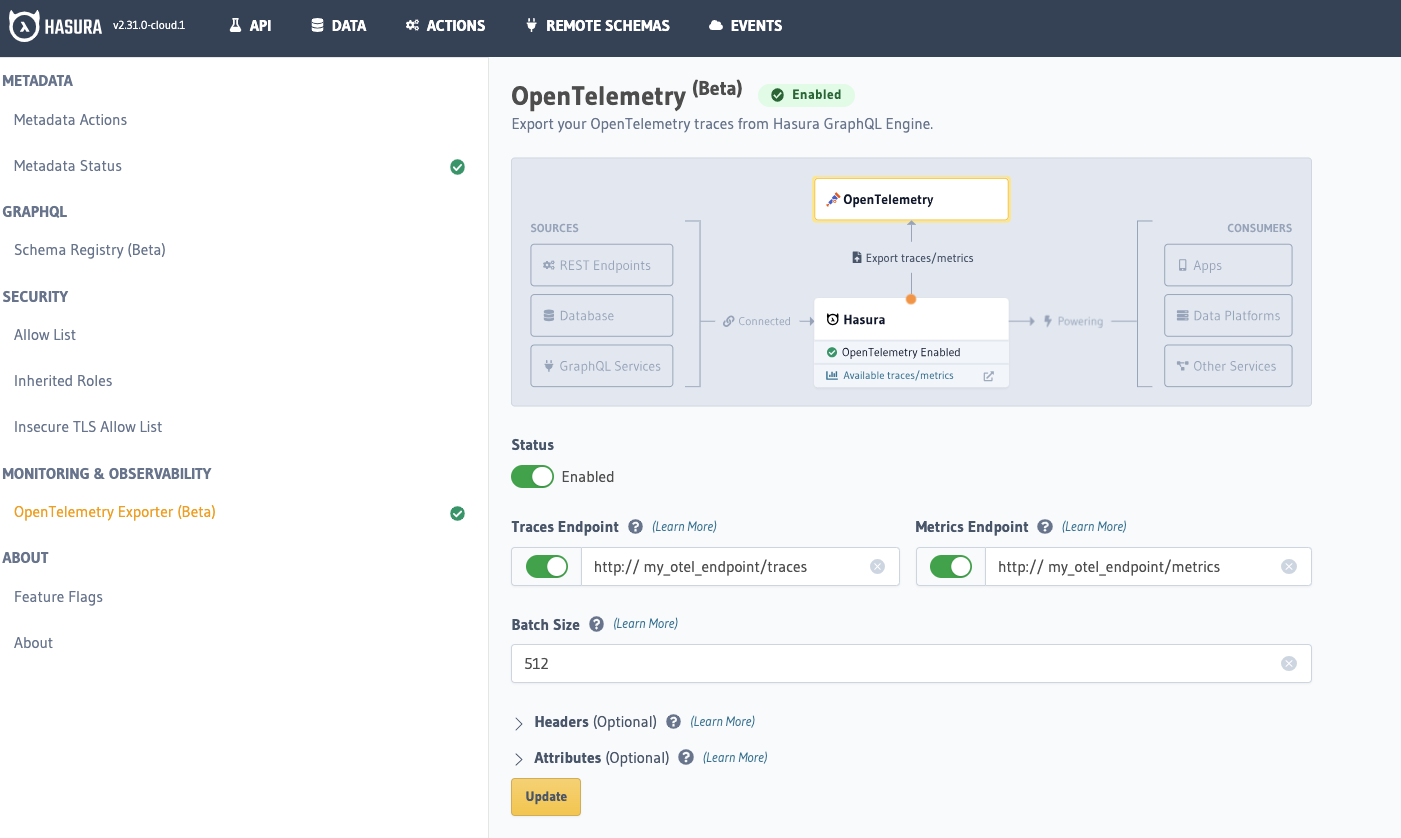
Exporting observability data from the Hasura cloud is now easier than ever!
Sign up now to try out the new observability metrics from Hasura.
Create a new project and click on “Launch Console” from the project details page.
Head to the settings page and select “OpenTelemetry Exporter (Beta)” from the sidebar.
Enable the service and provide valid OLTP endpoints for traces and (or) metrics, then save the configuration by clicking on the “Update” button.
5. Violà 🎉 That's it! You will now be getting trace and metrics information exported to the OLTP endpoint in the OpenTelemetry format based on the configuration!
Stay tuned for more updates from Hasura as they continue to enhance observability and provide a seamless GraphQL experience for developers worldwide.