Edit on GitHub
SQL Server Performance Tuning
Performance monitoring includes monitoring the MS SQL Server database. MS SQL Server and the Microsoft Windows OS provide monitoring utilities to optimize the resources and improve performance.
System/Performance Monitor
This tool monitors the utilization of system resources.
Go to Start > Run, type perfmon and select OK.
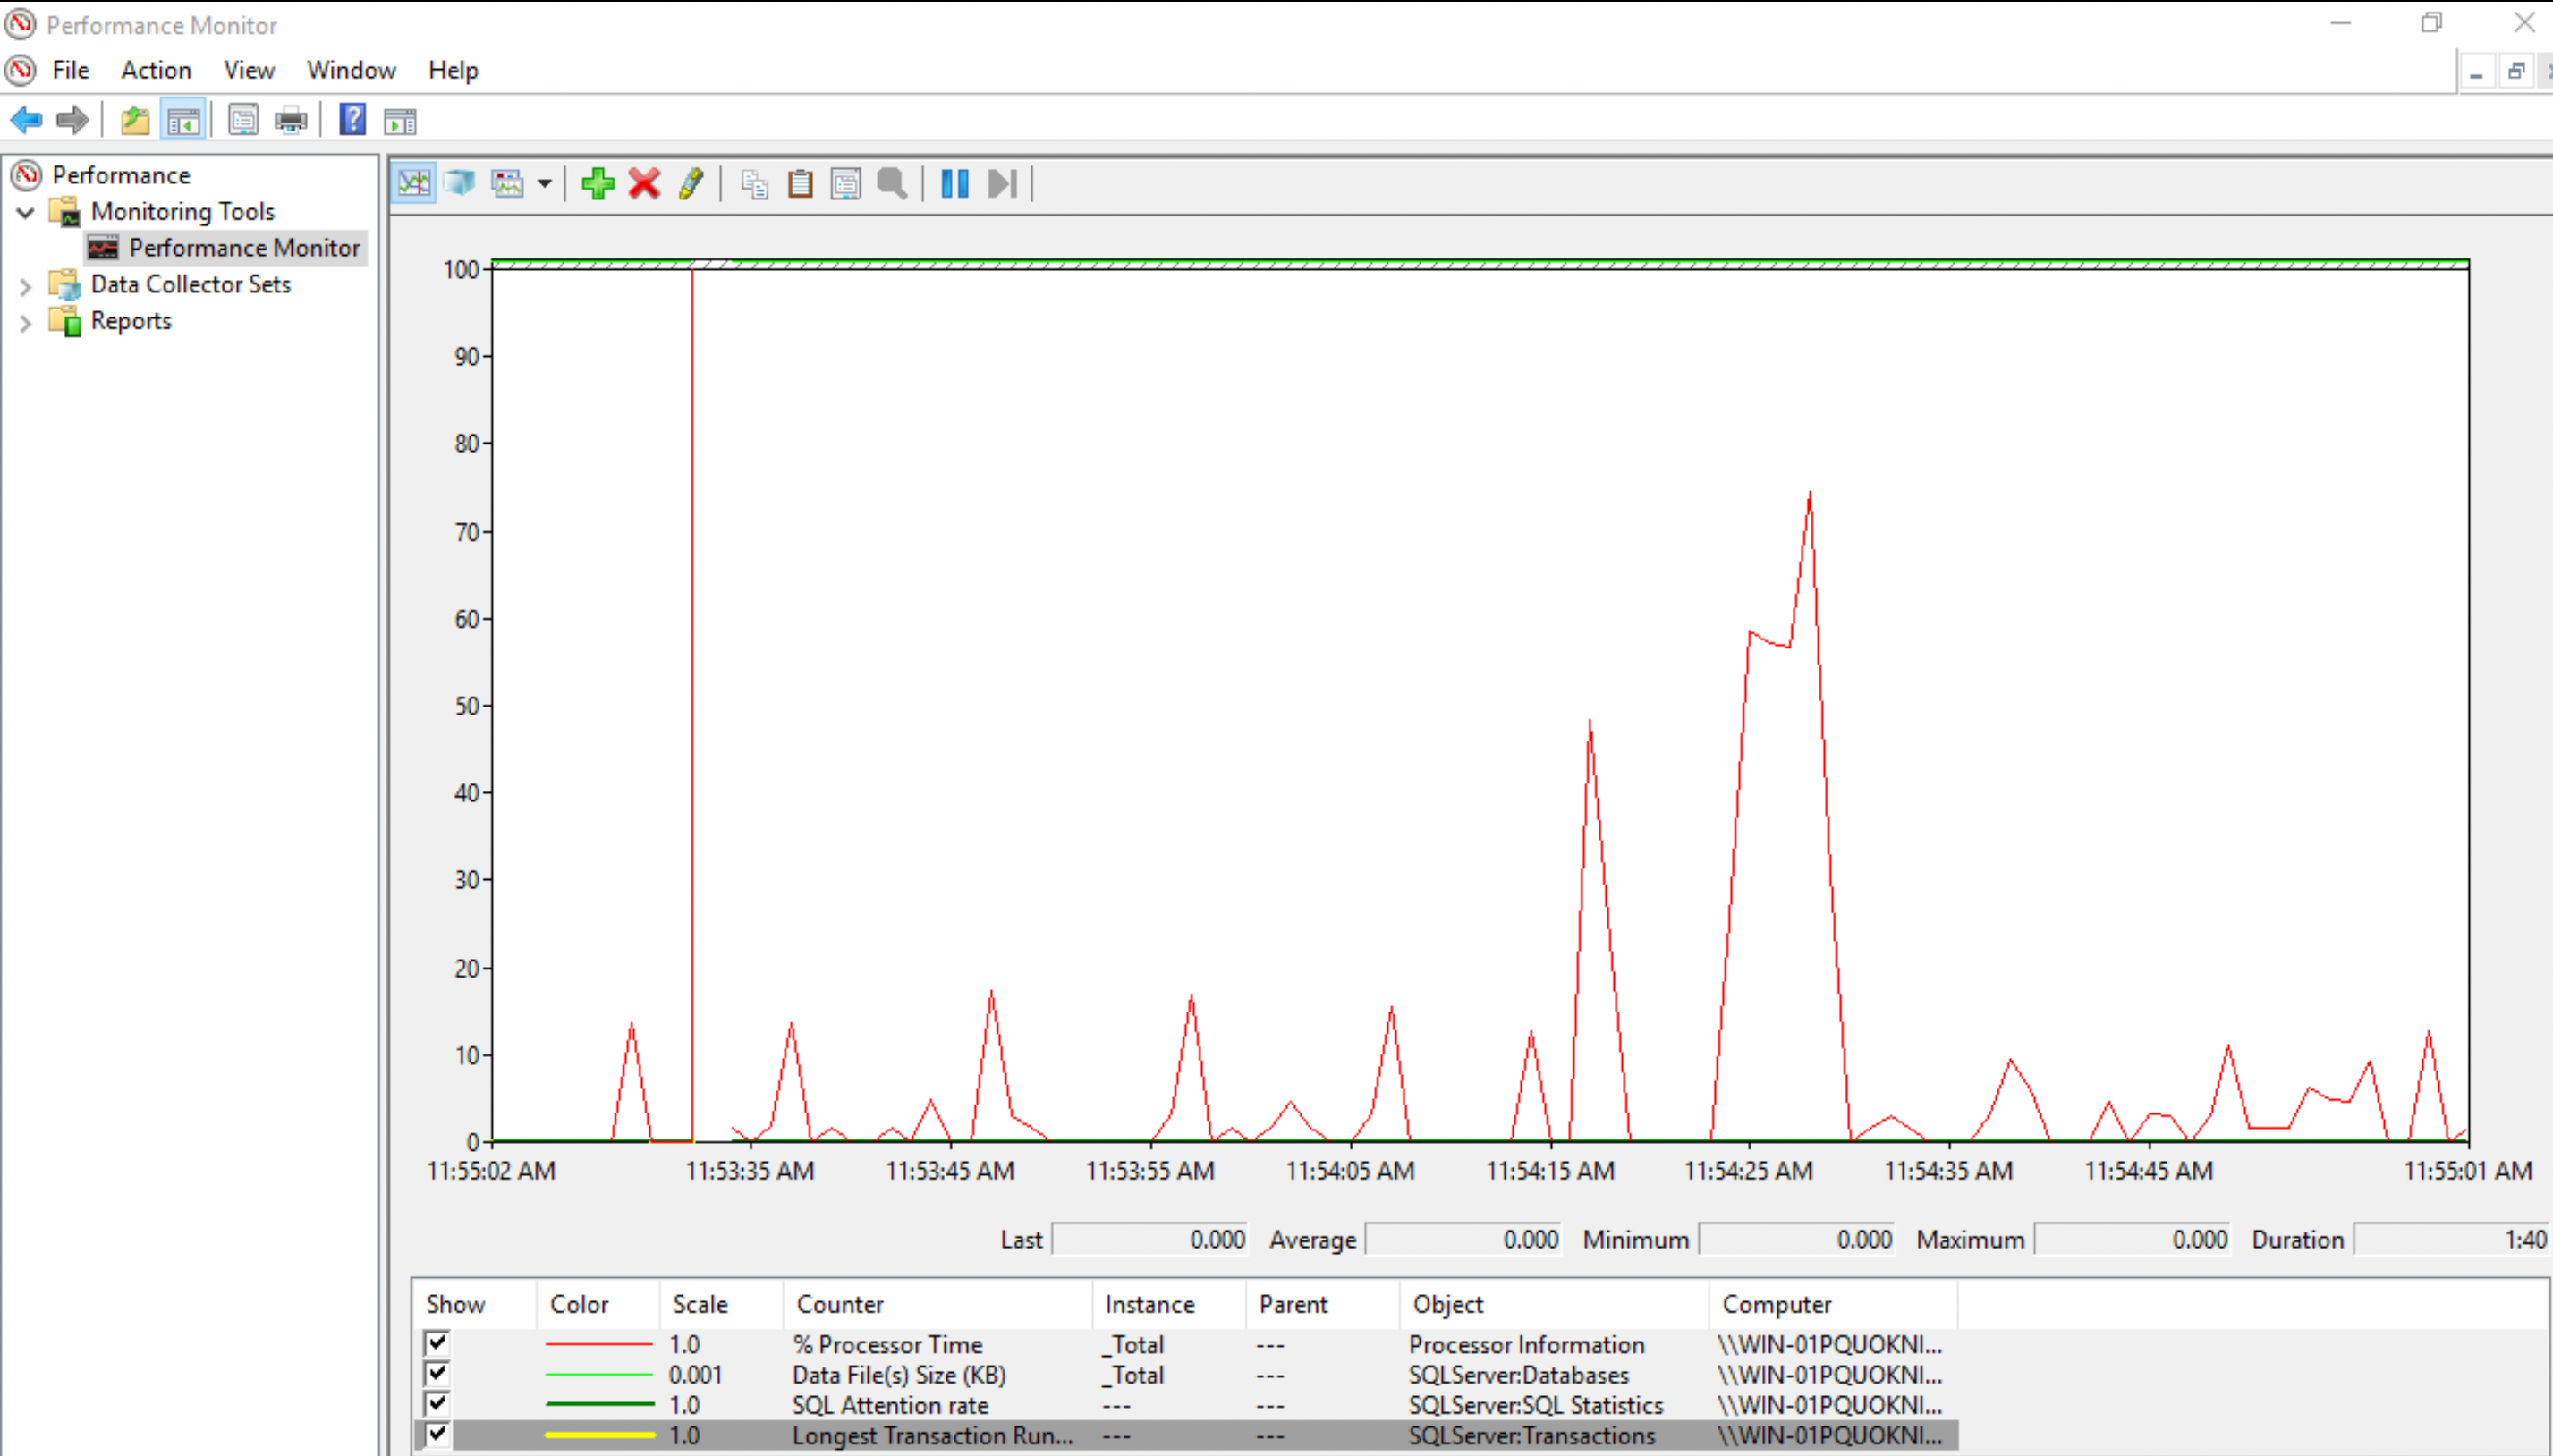
To add/delete the key parameters, use the Add (green) and Delete (red) keys on the Performance Monitor screen.
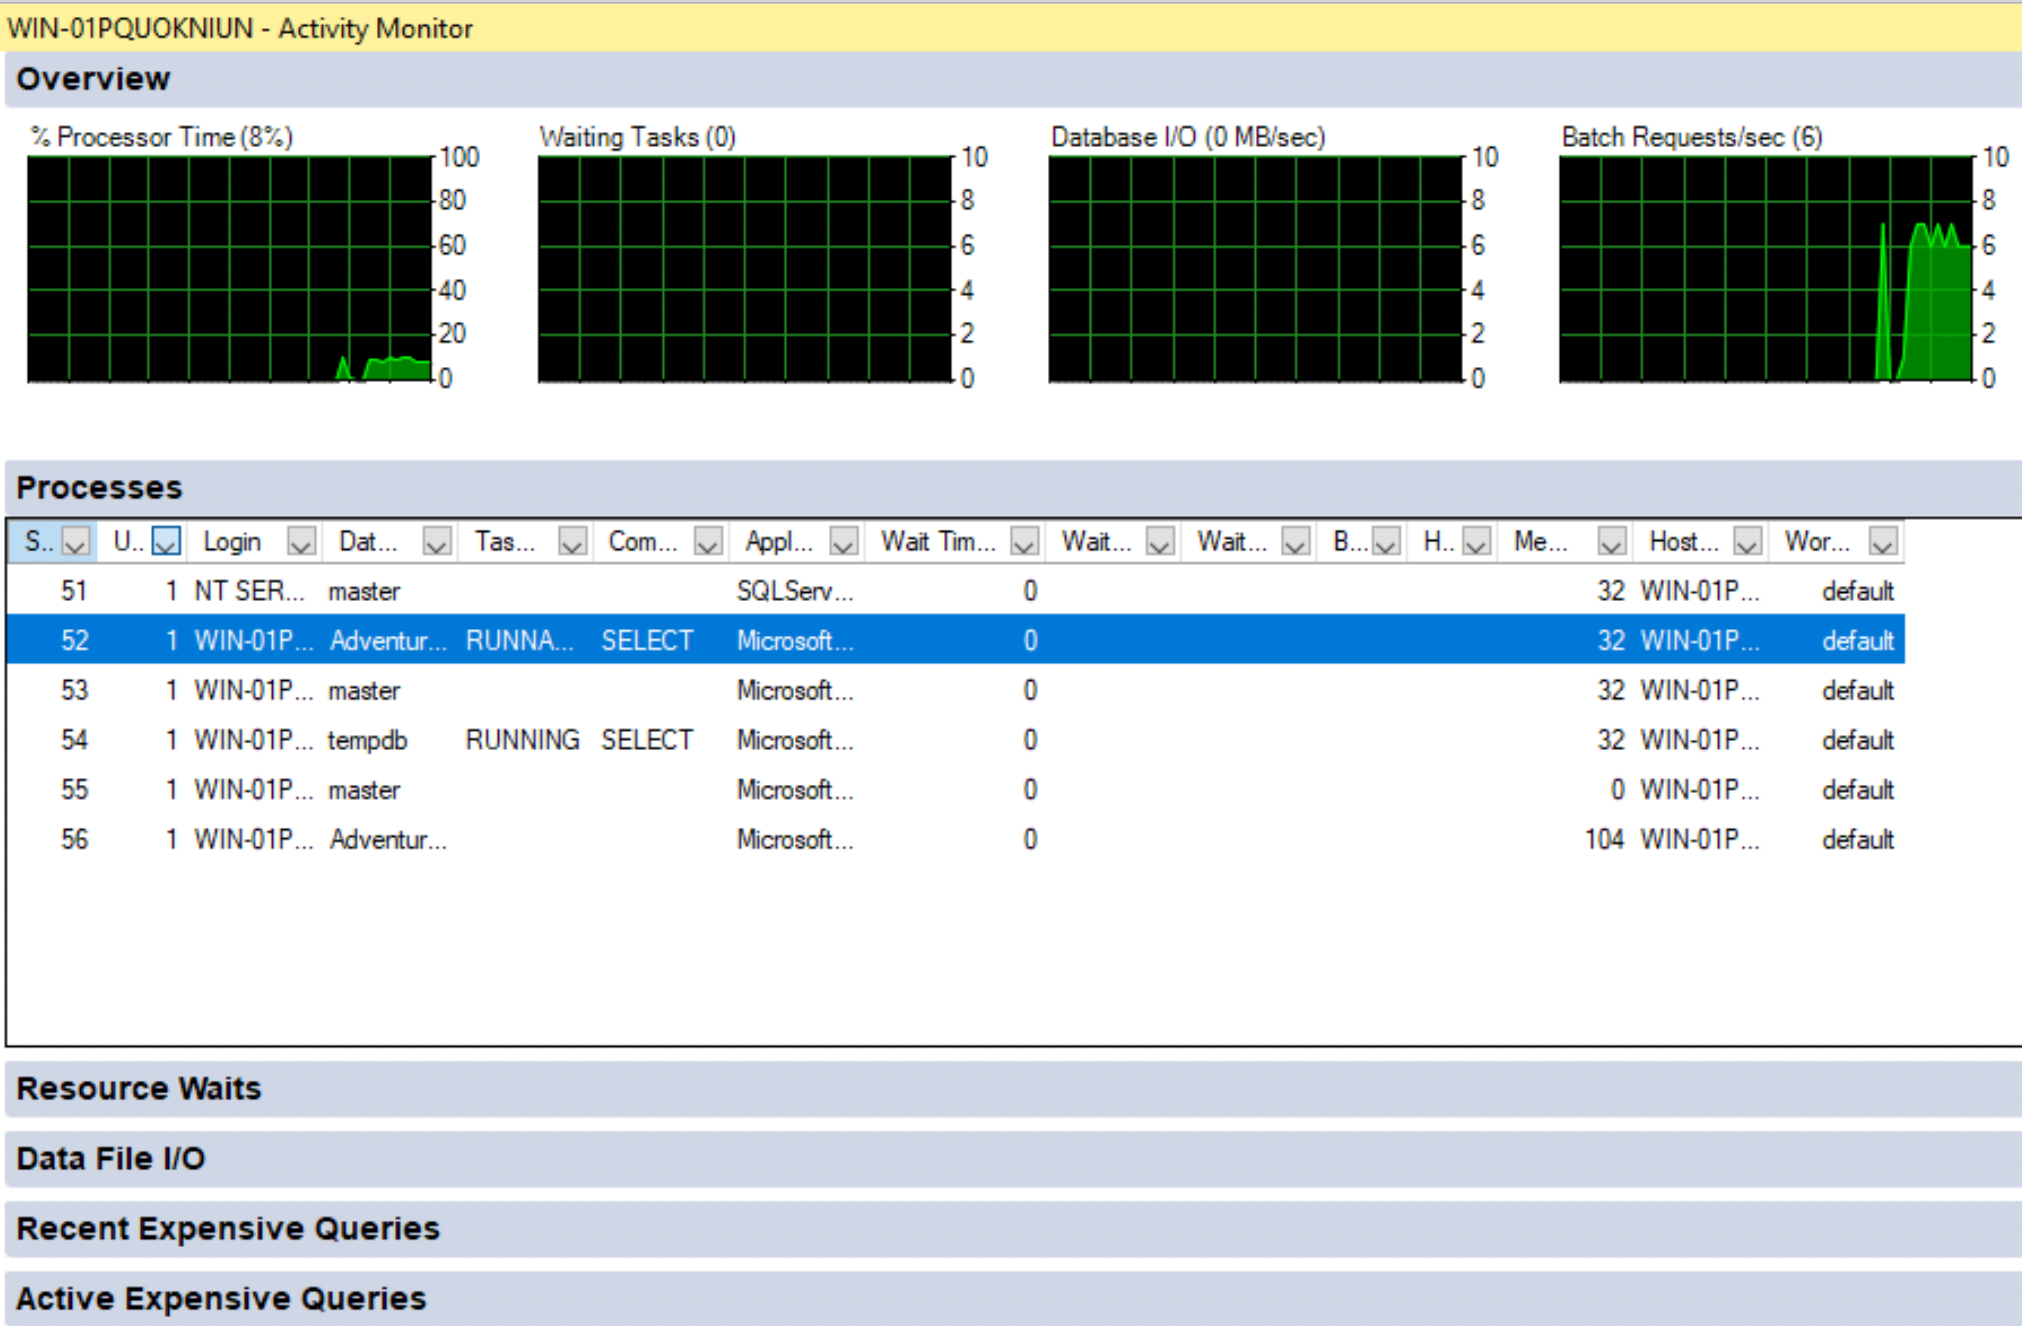
Activity Monitor in SSMS
The Activity Monitor monitors the query execution and displays statistics such as Processes, Resource Waits, Recent and Active Expensive Queries.
- Open SSMS, and connect to your server instance.
- Select Activity Monitor from the top ribbon bar.
Performance Dashboard in SSMS
The dashboard provides visual insights into the performance of the SQL Server instance.
Right-click on the SQL Server instance name in the Object Explorer on the right. Then select Reports > Standard Reports > Performance Dashboard.
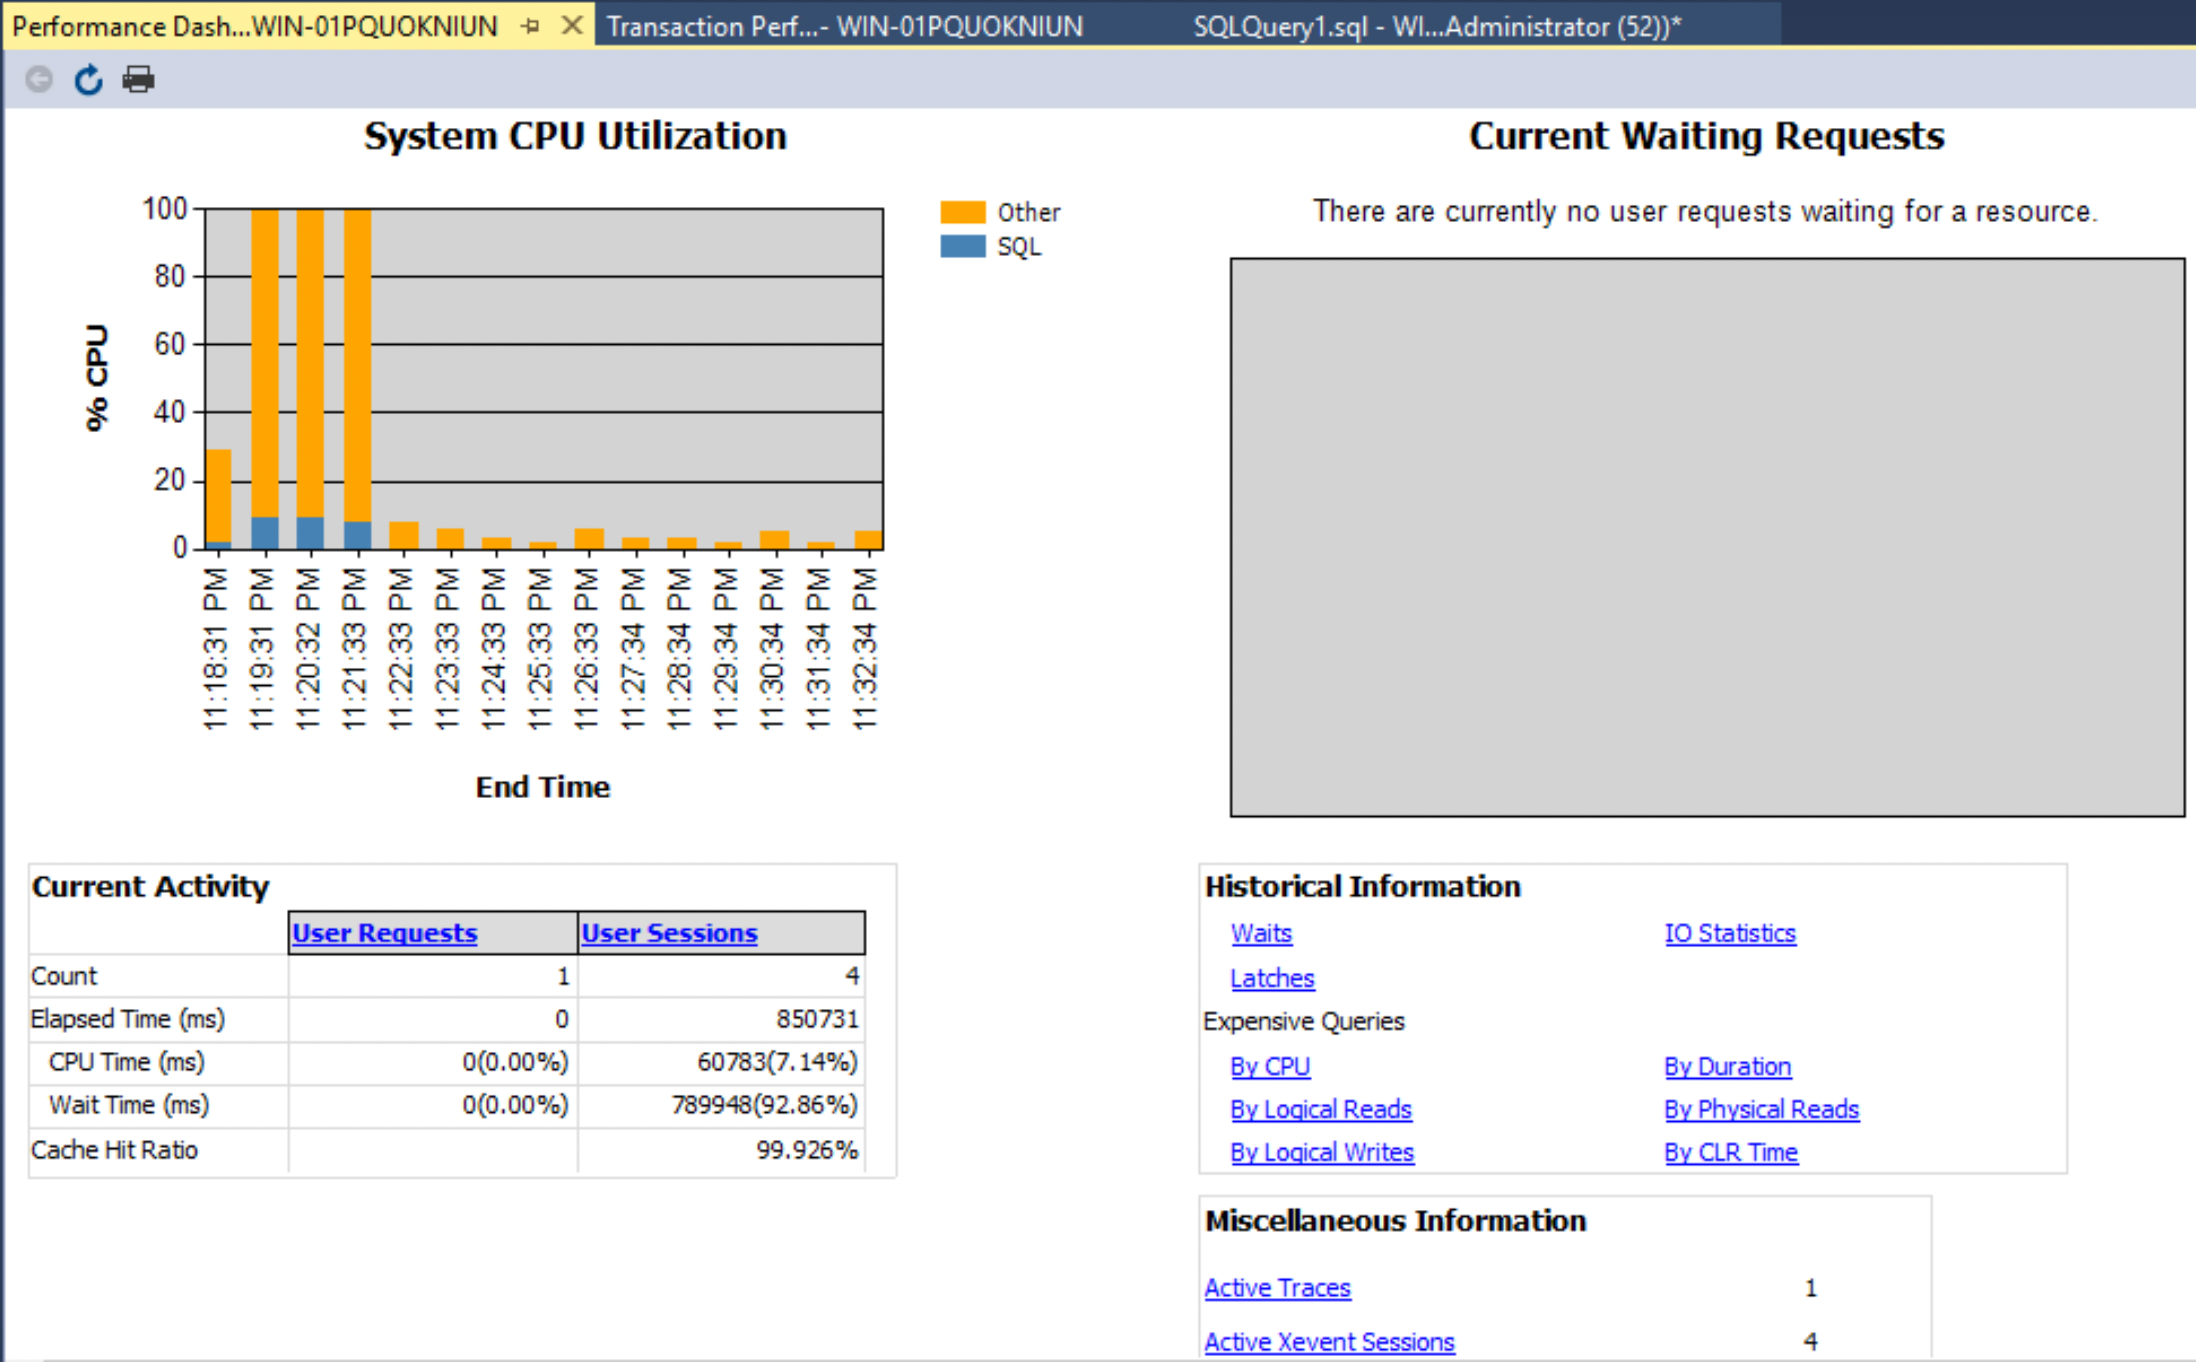
The Performance Dashboard helps to identify System CPU Utilization, Current Waiting Requests, and performances measured based on the listed metrics.
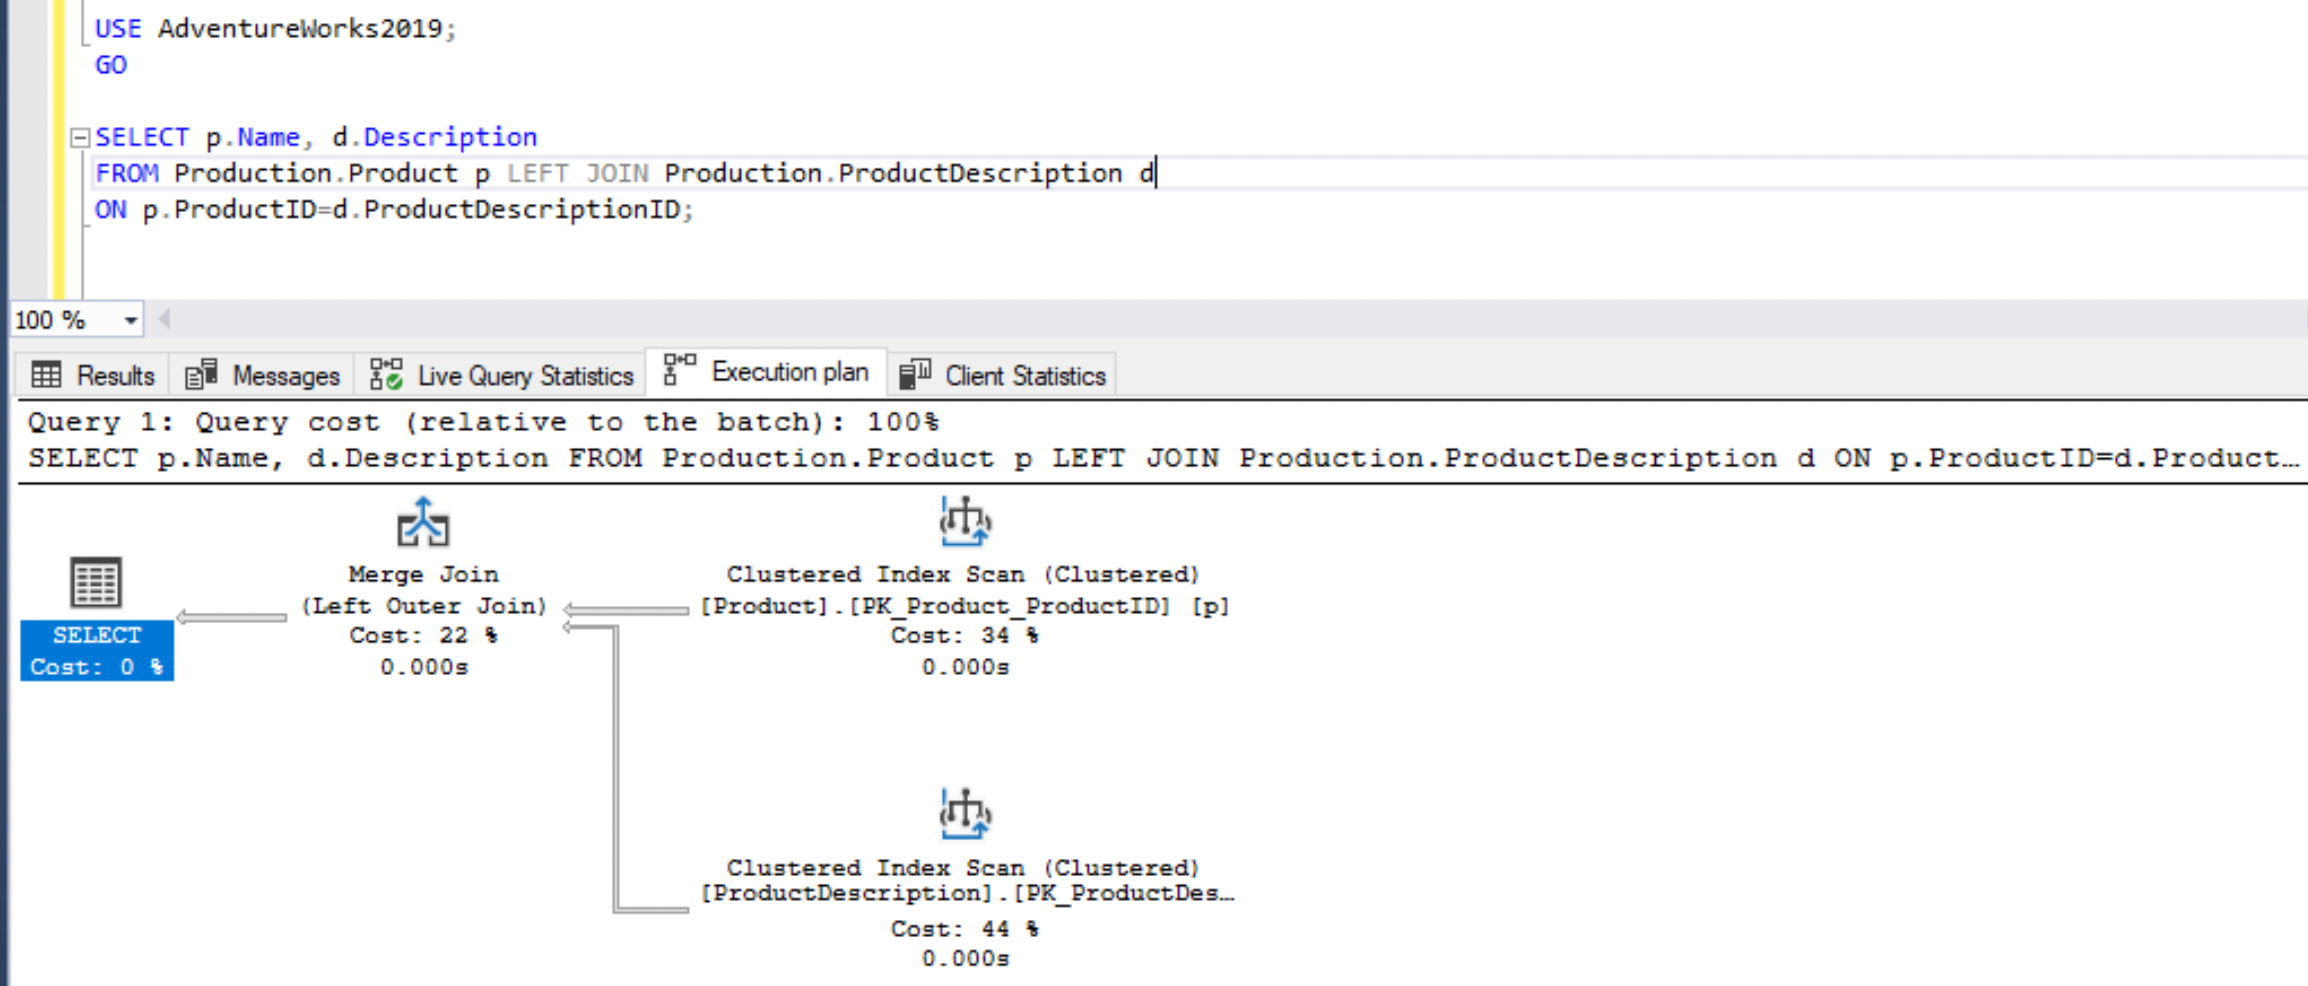
Execution Plan - Estimated and Actual
The cost-based query optimizer in SQL Server calculates costs based on multiple possible plans. Click the Estimated Execution Plan and Actual Executed Plan button next to the Execute button in SSMS.
The actual execution plan includes runtime statistics. To capture an actual execution plan, you must execute the query.
In general, you can use the estimated execution plan to monitor the performance of your query. The actual execution plan determines the runtime performance of the query.
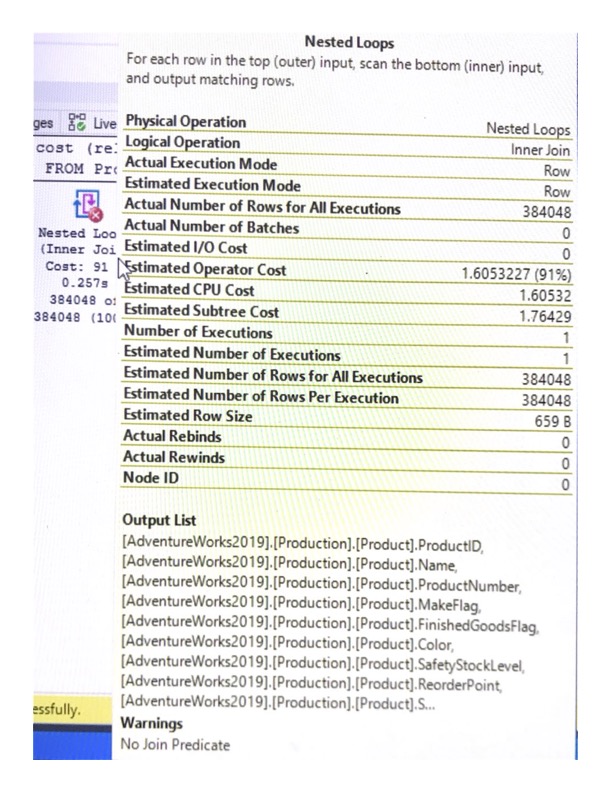
In the actual execution plan, the Nested Loops component indicates a red cross.
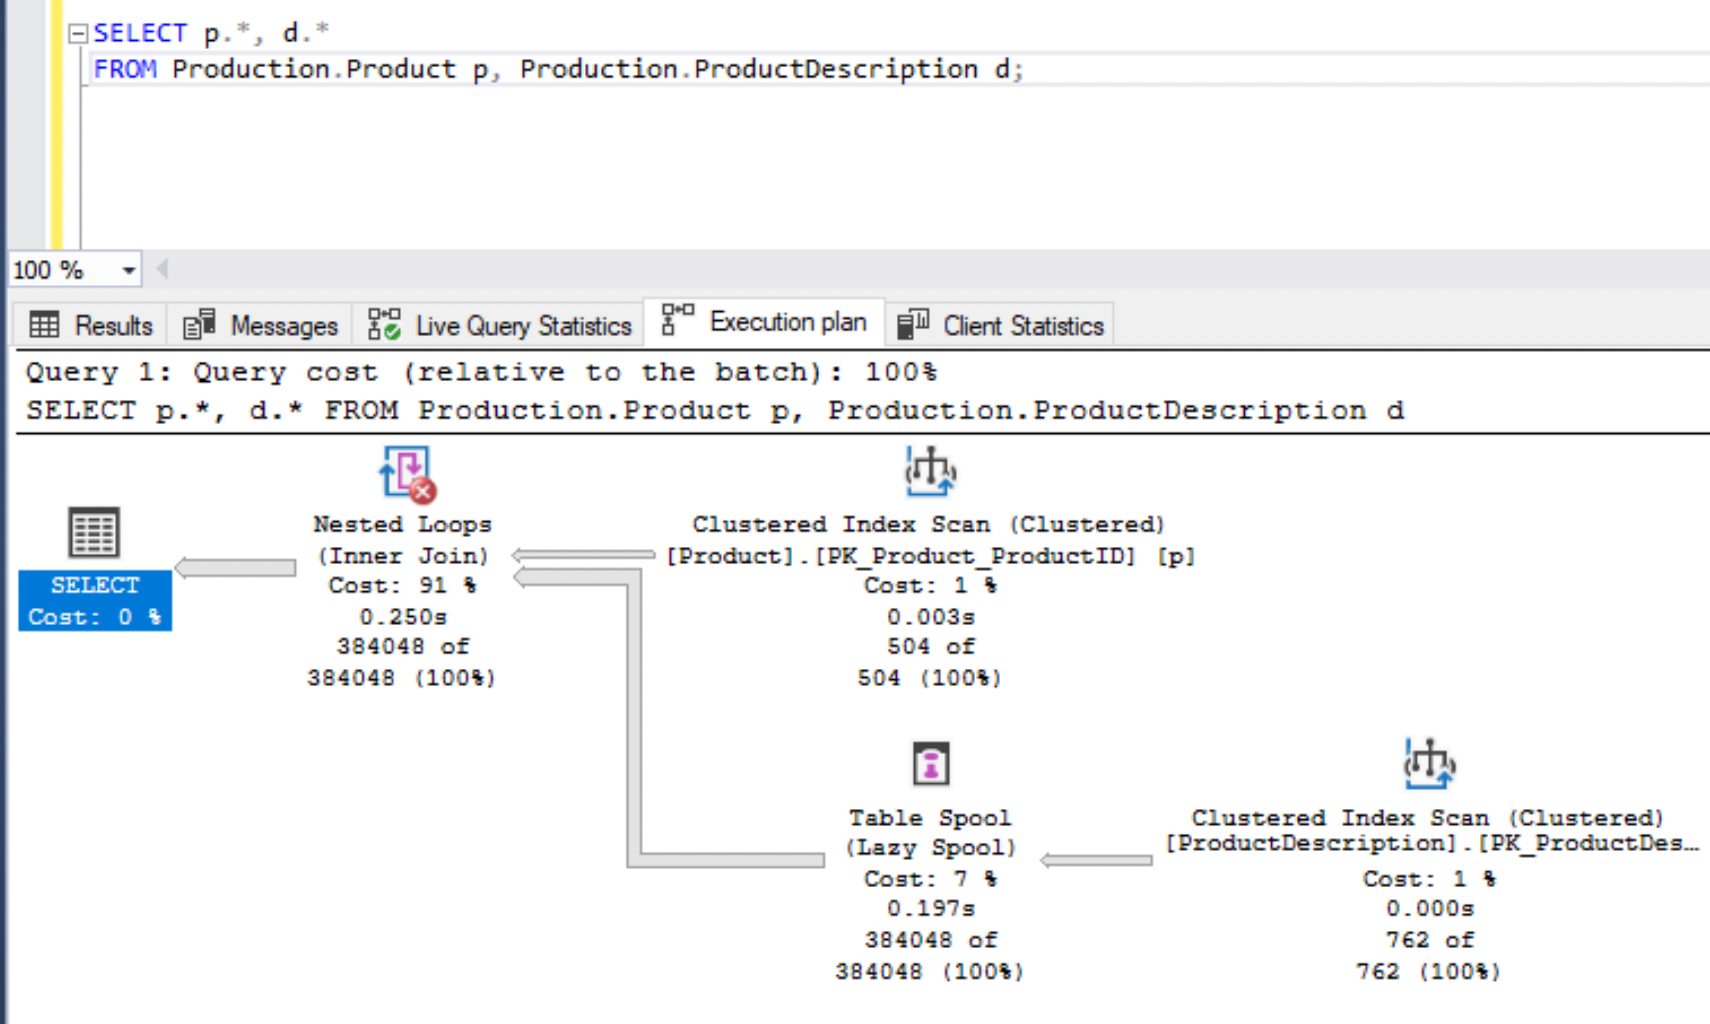
When you hover over each component, you can view additional information.
To optimize the query, rewrite the first query with selected columns and a join clause.
Query Optimization
Here are some of the SQL query best practices that you may follow for better SQL Server database performance.
- Instead of
SELECT *query, use specific column names. Fetching all rows result in CPU, memory, I/O overhead and slows down performance. When you define the fields, the query optimizer queries only the required table data. - The
DISTINCTquery works by grouping all the fields in the query to create distinct rules. Such a grouping of fields consumes enormous processing power. Instead, mention additional and relevant column names in theSELECTquery to yield unique results. - Use wildcards
%sparingly and preferably at the end of the phrase (search text). A random wildcard broadens the search. - Use the
WHEREclause to filter the data first and then use theHAVINGclause for the aggregate data filter. If you useWHEREclause first, the number of rows scanned is limited before applying theHAVINGcondition.
 Build apps and APIs 10x faster
- Built-in authorization and caching
- 8x more performant than hand-rolled APIs